| Param | Original file | Final file |
|---|---|---|
| Filename | modeM0/AS1T03_118T01_9000002962_19874cztM0_level2.evt | modeM0/AS1T03_118T01_9000002962_19874cztM0_level2_quad_clean.evt |
| Size (bytes) | 456,096,960 | 106,030,080 |
| Size | 435.0 MB | 101.1 MB |
| Events in quadrant A | 3,287,721 | 704,958 |
| Events in quadrant B | 3,283,376 | 722,191 |
| Events in quadrant C | 3,271,871 | 693,388 |
| Events in quadrant D | 3,556,453 | 665,513 |
| Mode SS | |||
|---|---|---|---|
| Quadrant | BADHDUFLAG | Total packets | Discarded packets |
| A | 0 | 124 | 0 |
| B | 0 | 124 | 0 |
| C | 0 | 124 | 0 |
| D | 0 | 124 | 0 |
| Mode M9 | |||
|---|---|---|---|
| Quadrant | BADHDUFLAG | Total packets | Discarded packets |
| A | 0 | 13 | 0 |
| B | 0 | 14 | 0 |
| C | 0 | 14 | 0 |
| D | 0 | 14 | 0 |
| Mode M0 | |||
|---|---|---|---|
| Quadrant | BADHDUFLAG | Total packets | Discarded packets |
| A | 0 | 13584 | 2 |
| B | 0 | 13616 | 2 |
| C | 0 | 13420 | 2 |
| D | 0 | 14272 | 2 |
| Quadrant | Total seconds | Saturated seconds | Saturation percentage |
|---|---|---|---|
| A | 6089 | 47 | 0.771884% |
| B | 6089 | 100 | 1.642306% |
| C | 6089 | 98 | 1.609460% |
| D | 6089 | 118 | 1.937921% |
Noise dominated data is calculated using 1-second bins in cleaned event files. If a bin has >2000 counts, and if more than 50% of those come from <1% of pixels, then it is considered to be noise-dominated and hence unusable.
| Quadrant | # 1 sec bins | Bins with >0 counts | Bins with >2000 counts | High rate bins dominated by noise | Noise dominated (total time) | Noise dominated (detector-on time) | Marked lightcurve |
|---|---|---|---|---|---|---|---|
| A | 7409 | 6089 | 9 | 9 | 0.12% | 0.15% | 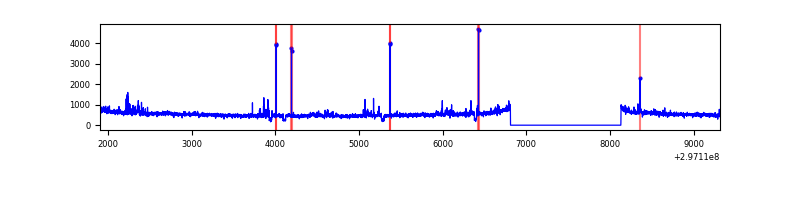 |
| B | 7409 | 6090 | 19 | 19 | 0.26% | 0.31% | 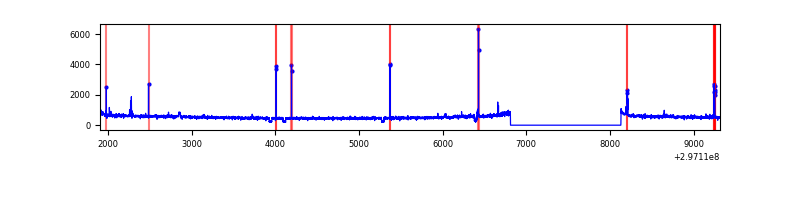 |
| C | 7409 | 6089 | 8 | 8 | 0.11% | 0.13% |  |
| D | 7409 | 6090 | 79 | 79 | 1.07% | 1.30% | 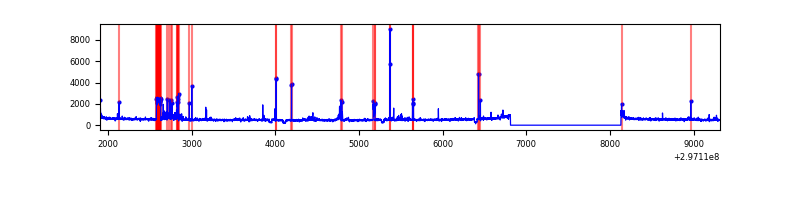 |
Top three noisy pixels from each quadrant. If the there are fewer than three noisy pixels in the level2.evt file, extra rows are filled as -1
| Pixel properties | Quadrant properties | ||||||
|---|---|---|---|---|---|---|---|
| Quadrant | DetID | PixID | Counts | Sigma | Mean | Median | Sigma |
| A | 14 | 238 | 147210 | 894.46 | 808 | 794 | 163.7 |
| A | 11 | 29 | 28069 | 166.62 | 808 | 794 | 163.7 |
| A | 0 | 226 | 6766 | 36.48 | 808 | 794 | 163.7 |
| B | 0 | 197 | 26414 | 169.26 | 813 | 797 | 151.3 |
| B | 0 | 230 | 25981 | 166.4 | 813 | 797 | 151.3 |
| B | 3 | 64 | 24569 | 157.07 | 813 | 797 | 151.3 |
| C | 14 | 238 | 124554 | 671.21 | 793 | 803 | 184.4 |
| C | 9 | 221 | 37318 | 198.05 | 793 | 803 | 184.4 |
| C | 7 | 220 | 17339 | 89.69 | 793 | 803 | 184.4 |
| D | 1 | 52 | 372676 | 1948.03 | 794 | 773 | 190.9 |
| D | 7 | 238 | 113501 | 590.47 | 794 | 773 | 190.9 |
| D | 9 | 85 | 34347 | 175.86 | 794 | 773 | 190.9 |
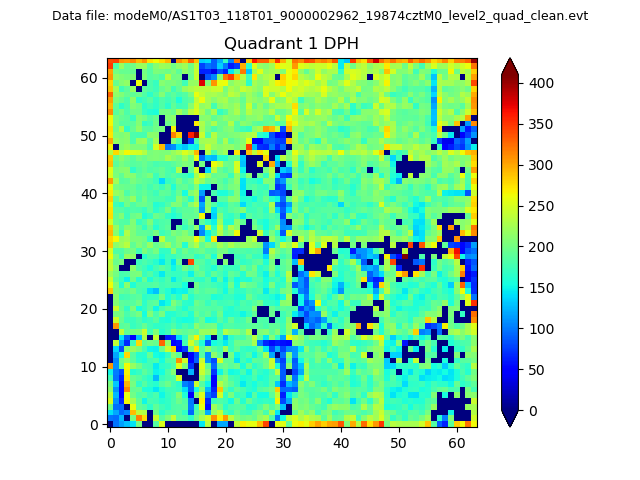
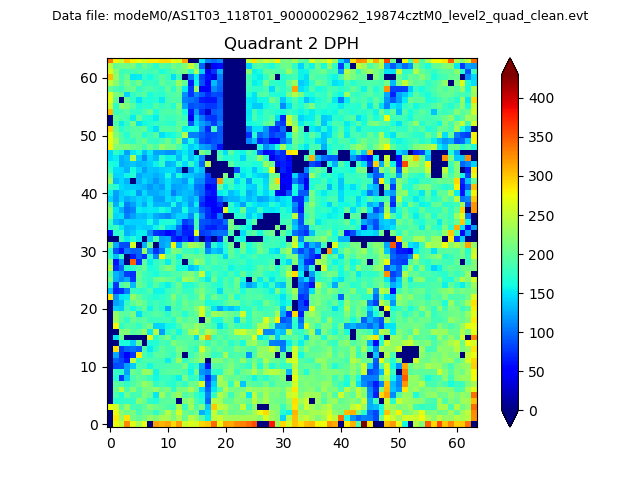
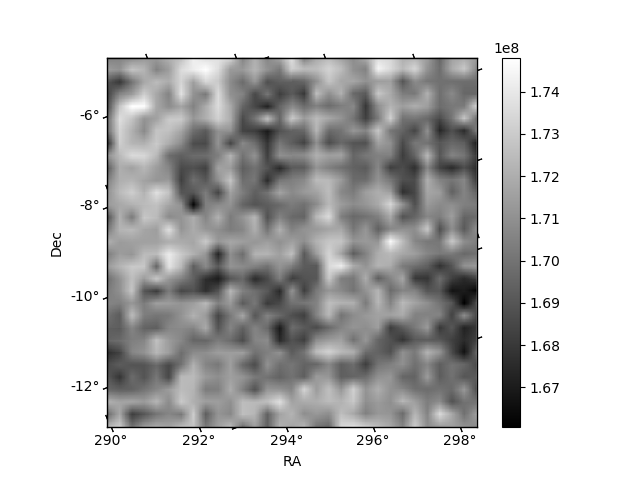
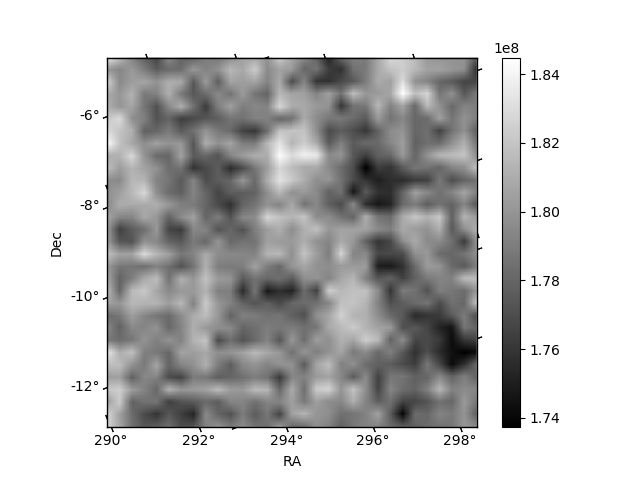
Histogram calculated using DETX and DETY for each event in the final _common_clean file
| Quadrant A | 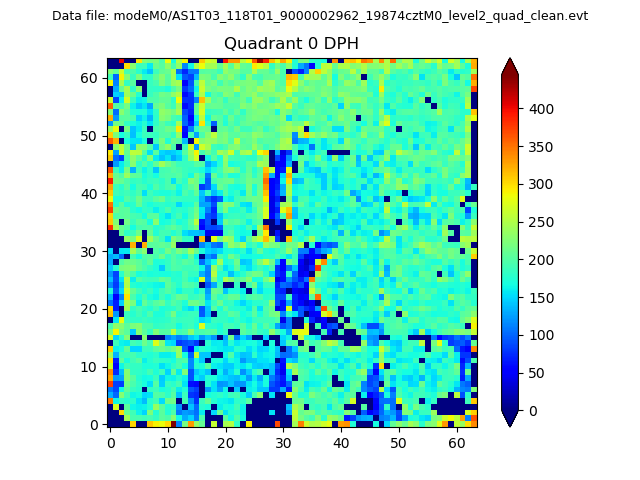 |
 |
Quadrant B |
|---|---|---|---|
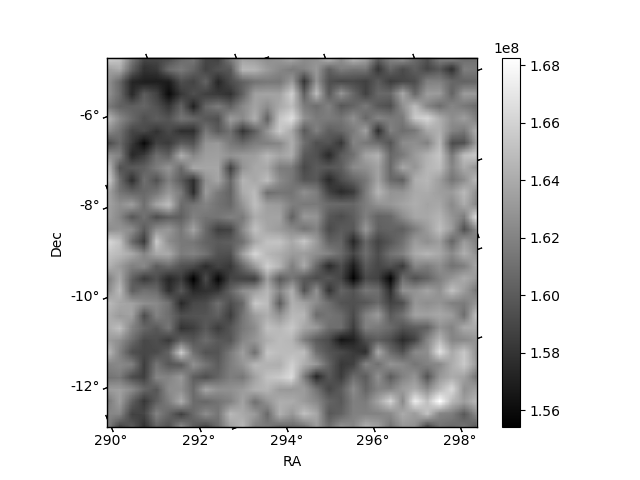
| Quadrant D |  |
 |
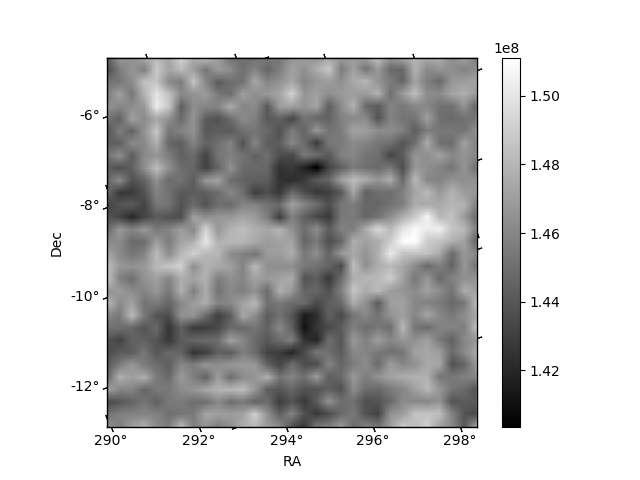
Quadrant C |
| Plot type | Count rate plots | Images |
|---|---|---|
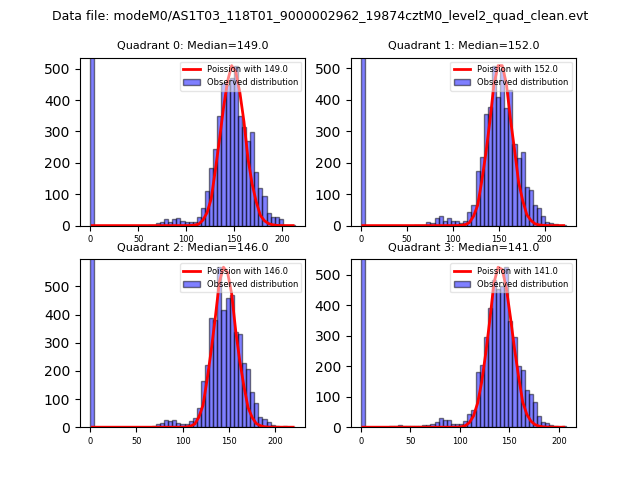
| Comparison with Poisson distribution Blue bars denote a histogram of data divided into 1 sec bins. Red curve is a Poisson curve with rate = median count rate of data. |
 |
 |
| Quadrant-wise count rates Data is divided into 100 sec bins |
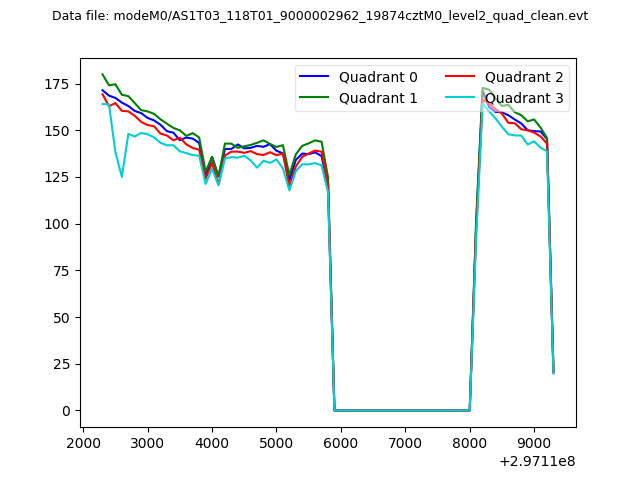 |
|
| Module-wise count rates for Quadrant A Data is divided into 100 sec bins |
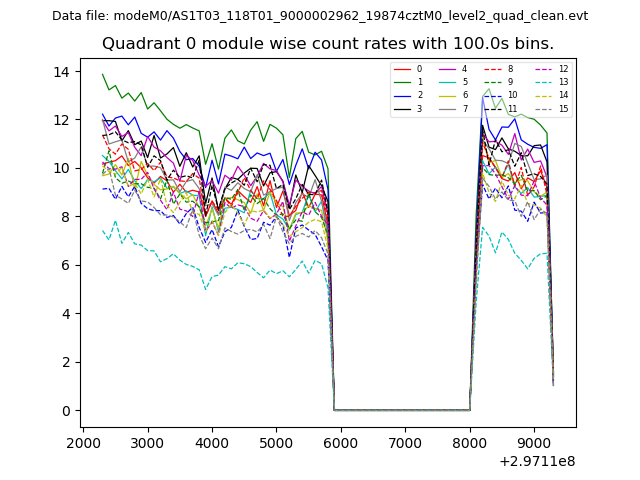 |
 |
| Module-wise count rates for Quadrant B Data is divided into 100 sec bins |
 |
 |
| Module-wise count rates for Quadrant C Data is divided into 100 sec bins |
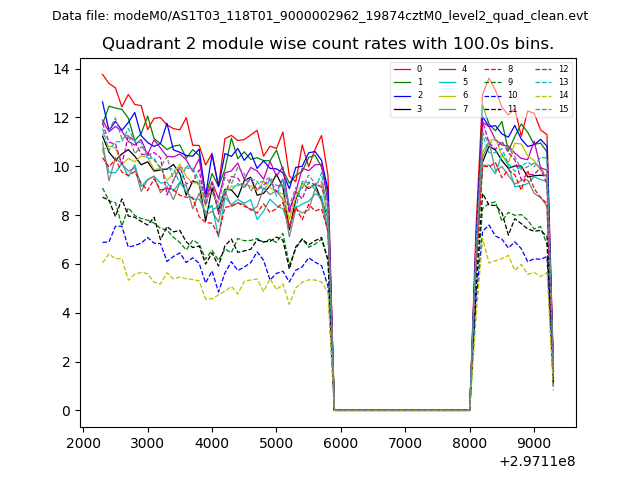 |
 |
| Module-wise count rates for Quadrant D Data is divided into 100 sec bins |
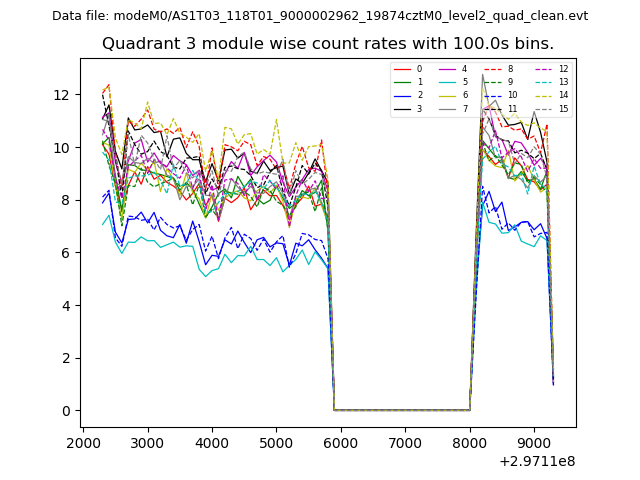 |
 |
| Parameter | Plot |
|---|---|
| CZT HV Monitor |  |
| D_VDD | 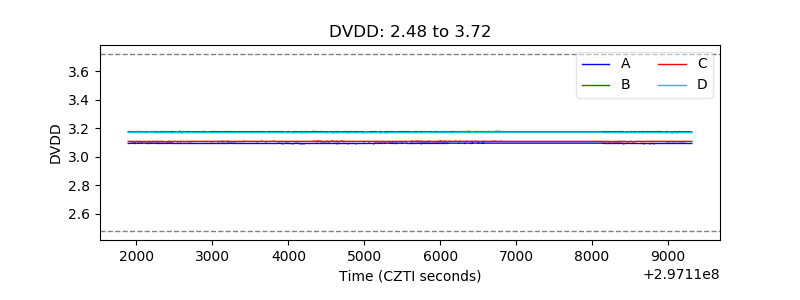 |
| Temperature 1 | 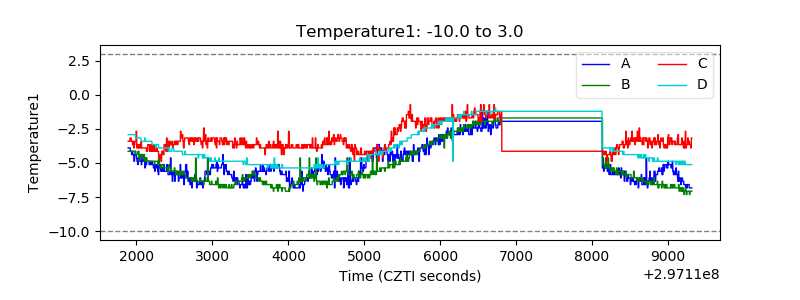 |
| Veto HV Monitor | 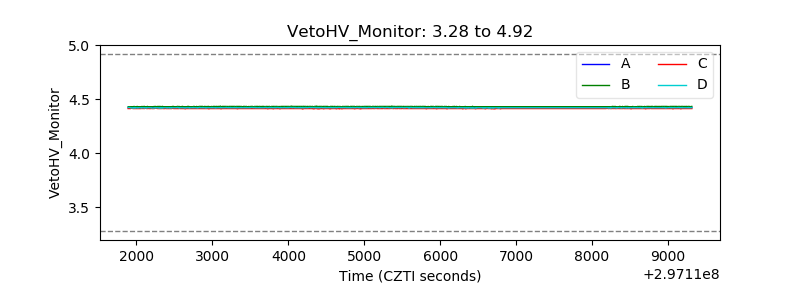 |
| Veto LLD | 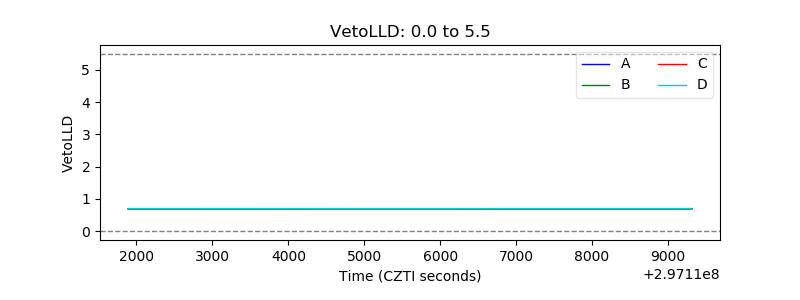 |
| Alpha Counter | 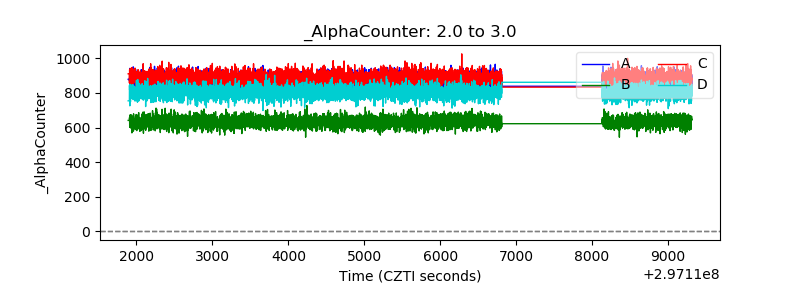 |
| _CPM_Rate | 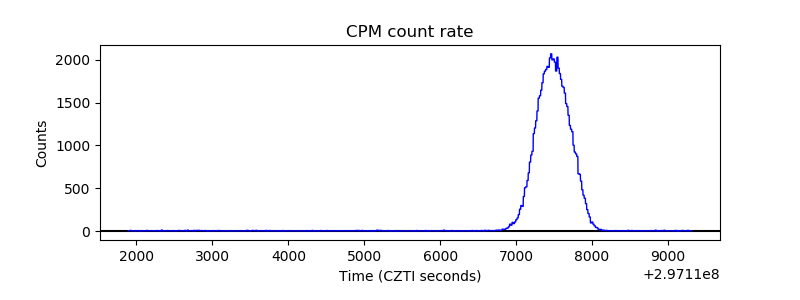 |
| CZT Counter | 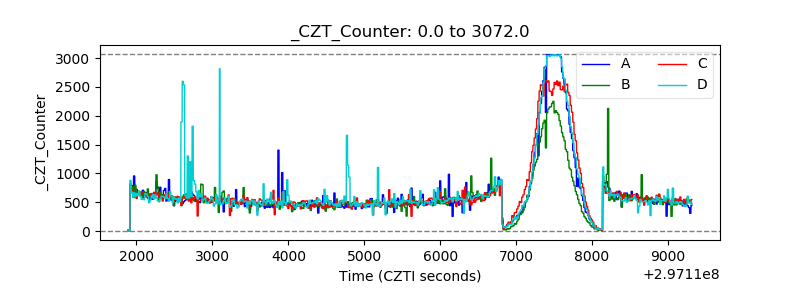 |
| +2.5 Volts monitor |  |
| +5 Volts monitor |  |
| _ROLL_ROT | 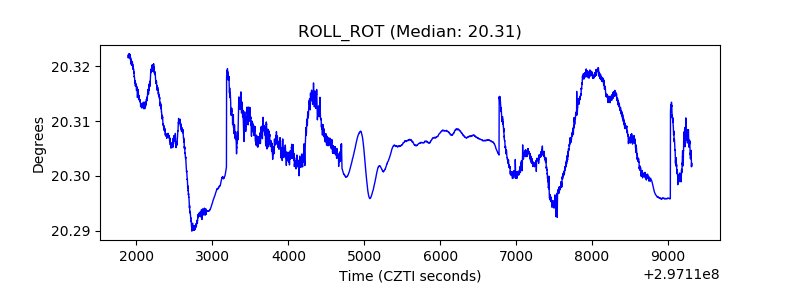 |
| _Roll_DEC | 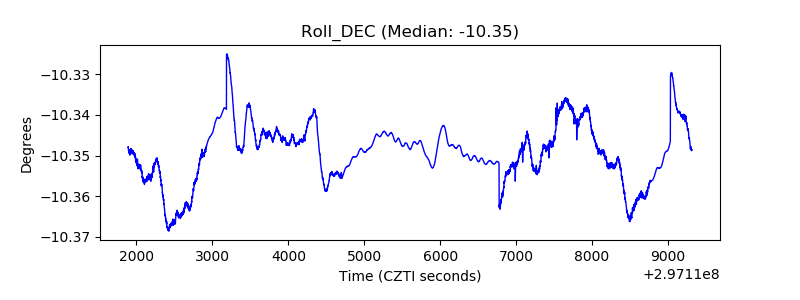 |
| _Roll_RA | 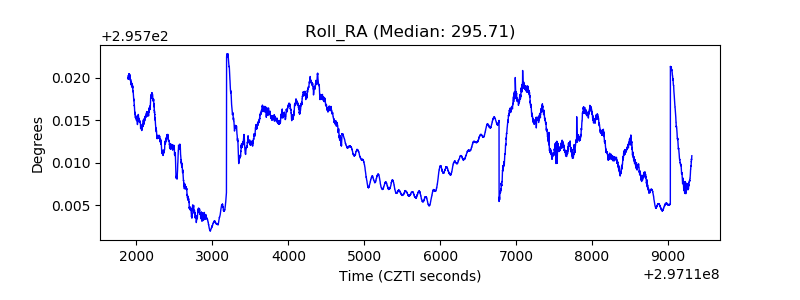 |
| Veto Counter |  |