| Param | Original file | Final file |
|---|---|---|
| Filename | modeM0/AS1T03_118T01_9000002962_19875cztM0_level2.evt | modeM0/AS1T03_118T01_9000002962_19875cztM0_level2_quad_clean.evt |
| Size (bytes) | 483,644,160 | 103,826,880 |
| Size | 461.2 MB | 99.0 MB |
| Events in quadrant A | 3,570,824 | 688,174 |
| Events in quadrant B | 3,319,543 | 701,986 |
| Events in quadrant C | 4,026,137 | 657,285 |
| Events in quadrant D | 3,303,044 | 657,328 |
| Mode SS | |||
|---|---|---|---|
| Quadrant | BADHDUFLAG | Total packets | Discarded packets |
| A | 0 | 128 | 0 |
| B | 0 | 128 | 0 |
| C | 0 | 128 | 0 |
| D | 0 | 128 | 0 |
| Mode M9 | |||
|---|---|---|---|
| Quadrant | BADHDUFLAG | Total packets | Discarded packets |
| A | 0 | 19 | 0 |
| B | 0 | 20 | 0 |
| C | 0 | 20 | 0 |
| D | 0 | 20 | 0 |
| Mode M0 | |||
|---|---|---|---|
| Quadrant | BADHDUFLAG | Total packets | Discarded packets |
| A | 0 | 14579 | 2 |
| B | 0 | 13779 | 2 |
| C | 0 | 15817 | 2 |
| D | 0 | 13730 | 2 |
| Quadrant | Total seconds | Saturated seconds | Saturation percentage |
|---|---|---|---|
| A | 6298 | 44 | 0.698634% |
| B | 6298 | 74 | 1.174976% |
| C | 6298 | 429 | 6.811686% |
| D | 6298 | 30 | 0.476342% |
Noise dominated data is calculated using 1-second bins in cleaned event files. If a bin has >2000 counts, and if more than 50% of those come from <1% of pixels, then it is considered to be noise-dominated and hence unusable.
| Quadrant | # 1 sec bins | Bins with >0 counts | Bins with >2000 counts | High rate bins dominated by noise | Noise dominated (total time) | Noise dominated (detector-on time) | Marked lightcurve |
|---|---|---|---|---|---|---|---|
| A | 7498 | 6299 | 16 | 16 | 0.21% | 0.25% | 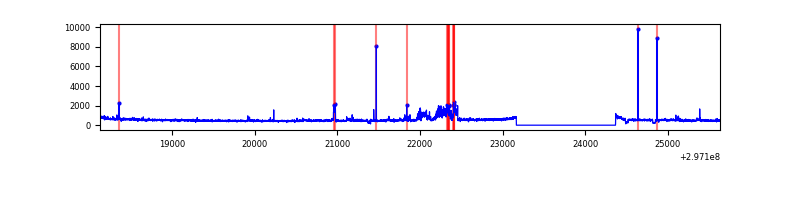 |
| B | 7498 | 6299 | 18 | 18 | 0.24% | 0.29% | 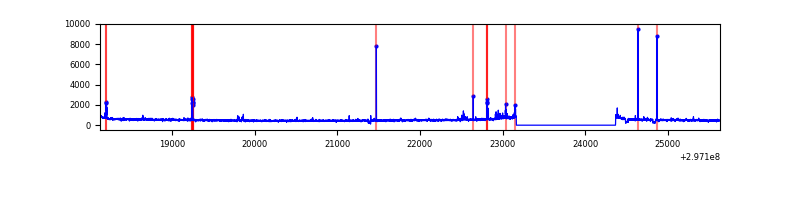 |
| C | 7498 | 6299 | 226 | 226 | 3.01% | 3.59% | 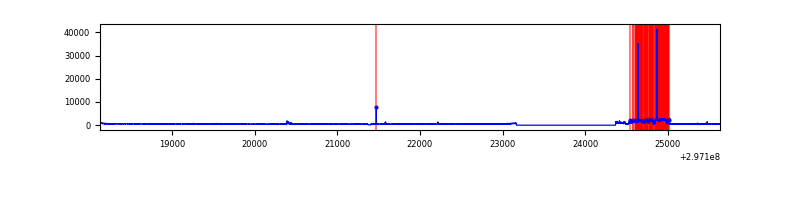 |
| D | 7498 | 6298 | 7 | 7 | 0.09% | 0.11% | 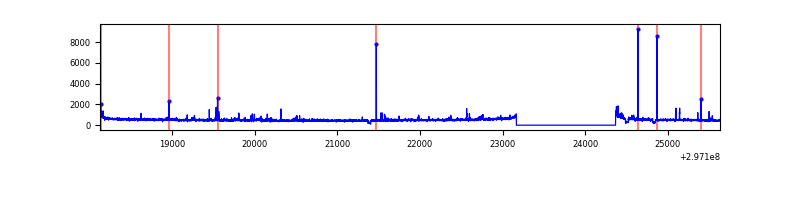 |
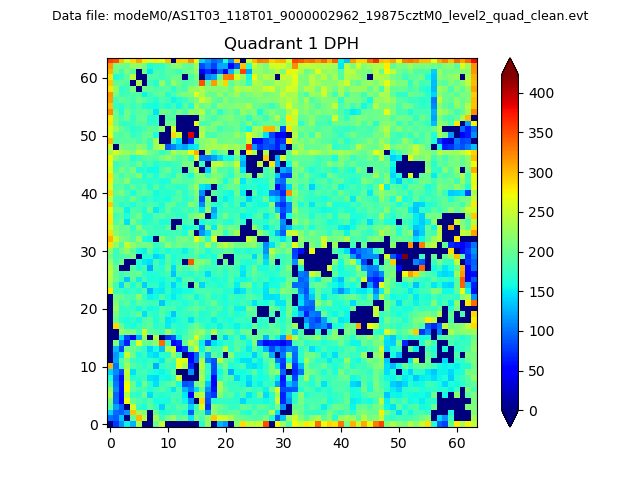
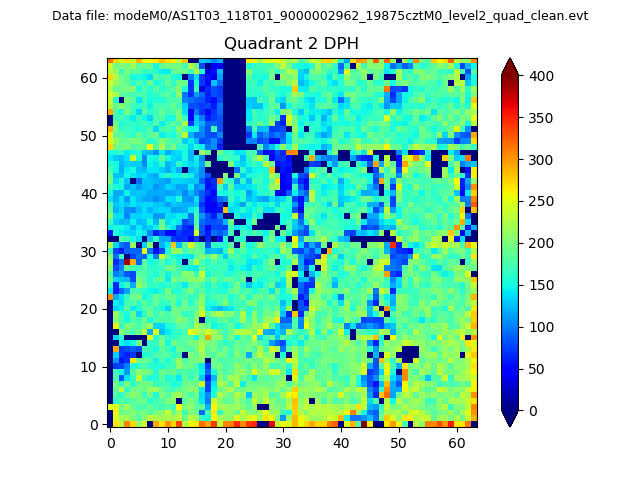
Top three noisy pixels from each quadrant. If the there are fewer than three noisy pixels in the level2.evt file, extra rows are filled as -1
| Pixel properties | Quadrant properties | ||||||
|---|---|---|---|---|---|---|---|
| Quadrant | DetID | PixID | Counts | Sigma | Mean | Median | Sigma |
| A | 14 | 238 | 442493 | 2731.61 | 803 | 789 | 161.7 |
| A | 11 | 29 | 27318 | 164.06 | 803 | 789 | 161.7 |
| A | 12 | 16 | 11027 | 63.31 | 803 | 789 | 161.7 |
| B | 7 | 220 | 54120 | 350.7 | 809 | 790 | 152.1 |
| B | 3 | 64 | 23611 | 150.07 | 809 | 790 | 152.1 |
| B | 0 | 197 | 19754 | 124.71 | 809 | 790 | 152.1 |
| C | 9 | 221 | 884044 | 4848.1 | 774 | 783 | 182.2 |
| C | 14 | 238 | 120784 | 658.67 | 774 | 783 | 182.2 |
| C | 13 | 61 | 5356 | 25.1 | 774 | 783 | 182.2 |
| D | 1 | 52 | 175011 | 903.64 | 792 | 769 | 192.8 |
| D | 2 | 184 | 58178 | 297.73 | 792 | 769 | 192.8 |
| D | 7 | 238 | 53133 | 271.57 | 792 | 769 | 192.8 |
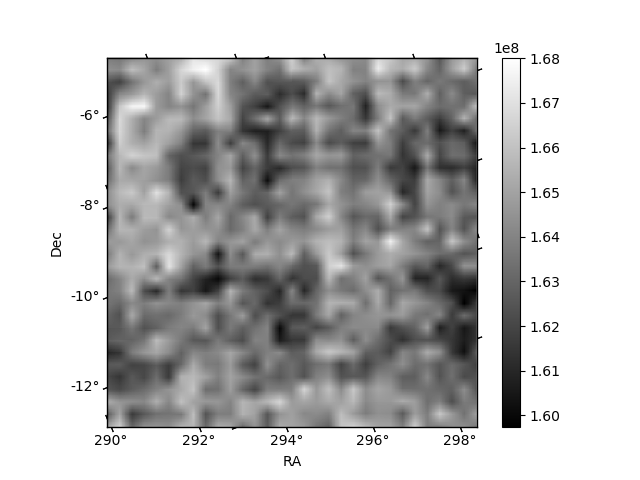
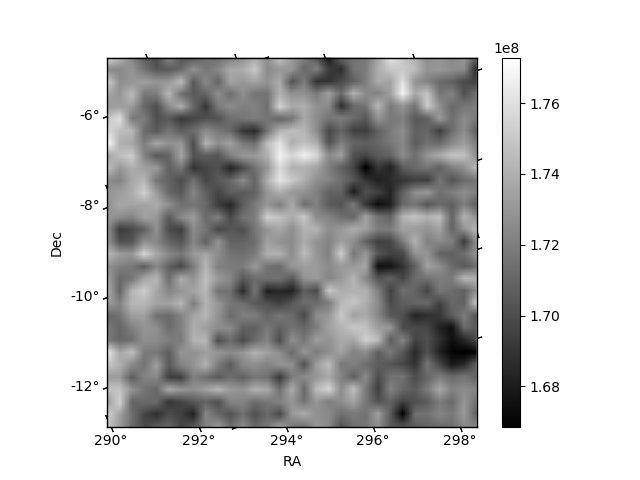
Histogram calculated using DETX and DETY for each event in the final _common_clean file
| Quadrant A | 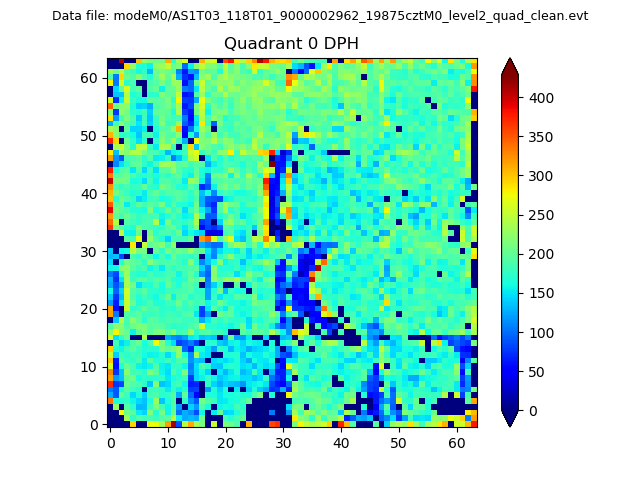 |
 |
Quadrant B |
|---|---|---|---|
| Quadrant D | 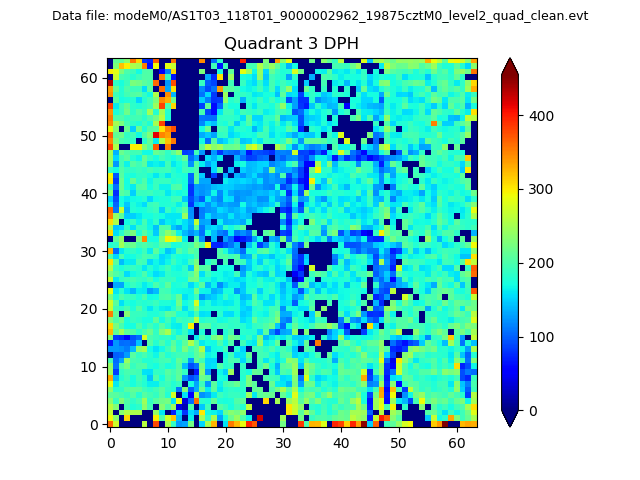 |
 |
Quadrant C |
| Plot type | Count rate plots | Images |
|---|---|---|
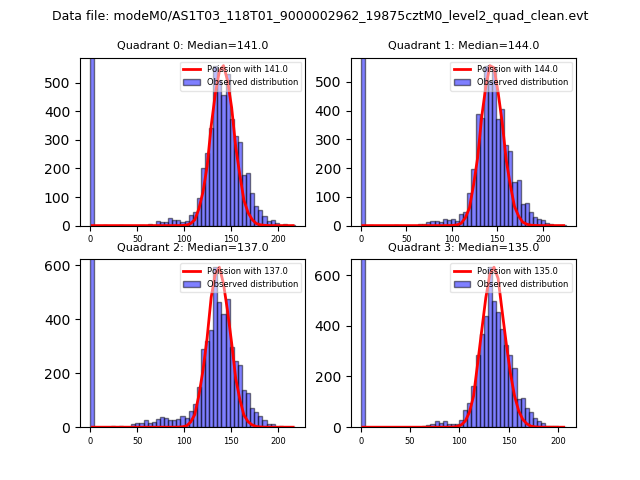
| Comparison with Poisson distribution Blue bars denote a histogram of data divided into 1 sec bins. Red curve is a Poisson curve with rate = median count rate of data. |
 |
 |
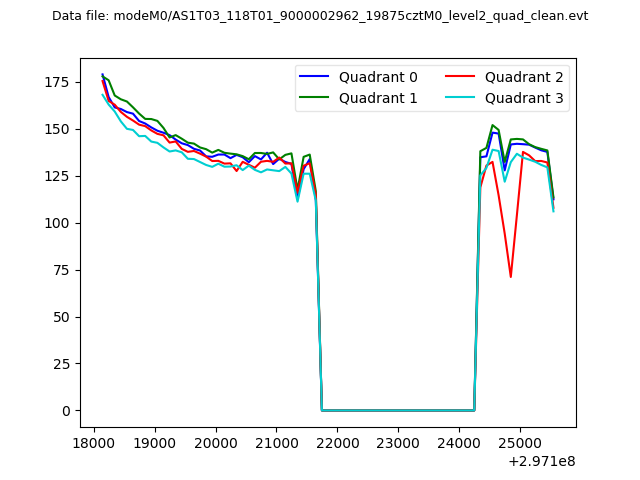
| Quadrant-wise count rates Data is divided into 100 sec bins |
 |
|
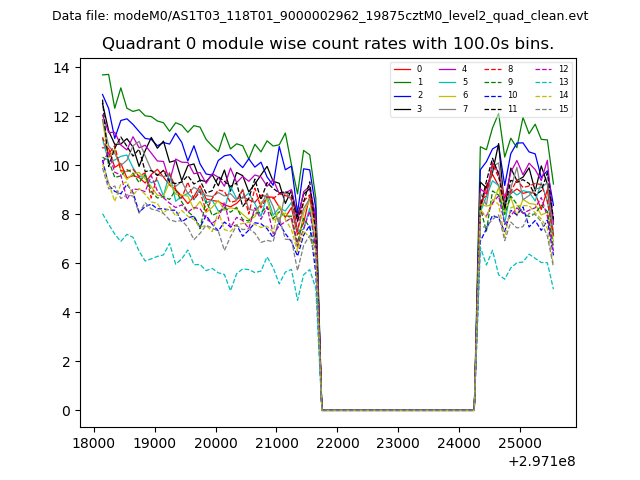
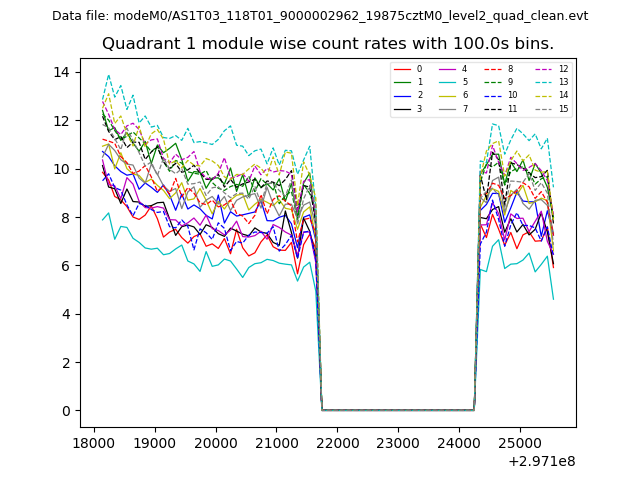
| Module-wise count rates for Quadrant A Data is divided into 100 sec bins |
 |
 |
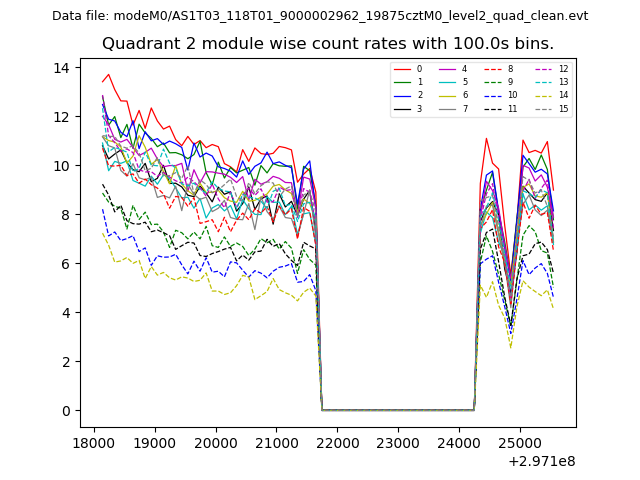
| Module-wise count rates for Quadrant B Data is divided into 100 sec bins |
 |
 |
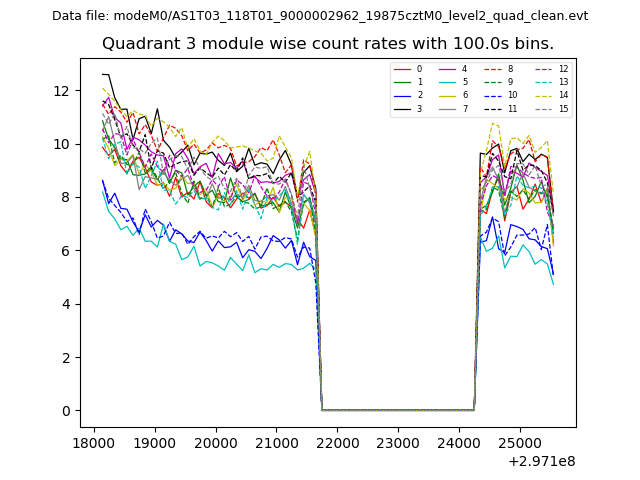
| Module-wise count rates for Quadrant C Data is divided into 100 sec bins |
 |
 |
| Module-wise count rates for Quadrant D Data is divided into 100 sec bins |
 |
 |
| Parameter | Plot |
|---|---|
| CZT HV Monitor | 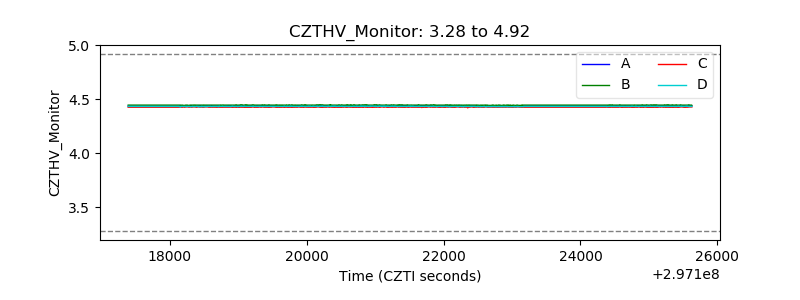 |
| D_VDD | 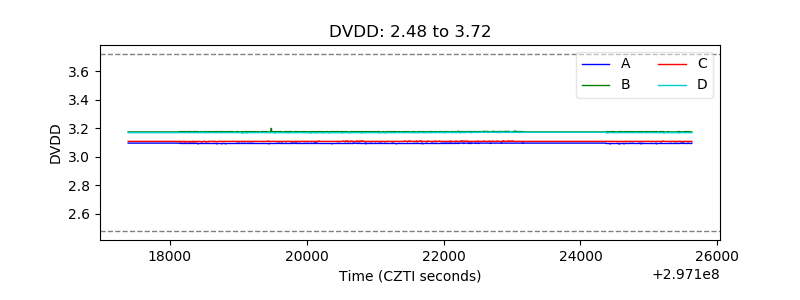 |
| Temperature 1 | 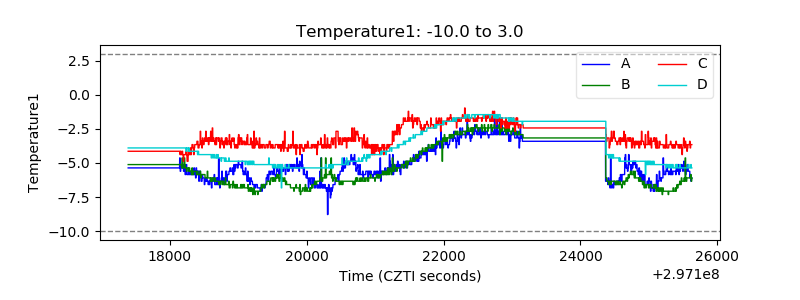 |
| Veto HV Monitor |  |
| Veto LLD | 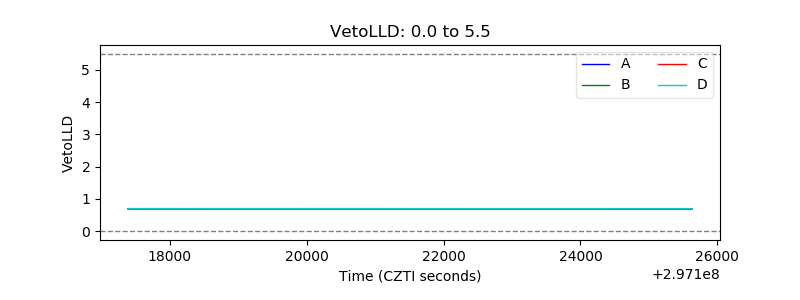 |
| Alpha Counter |  |
| _CPM_Rate |  |
| CZT Counter | 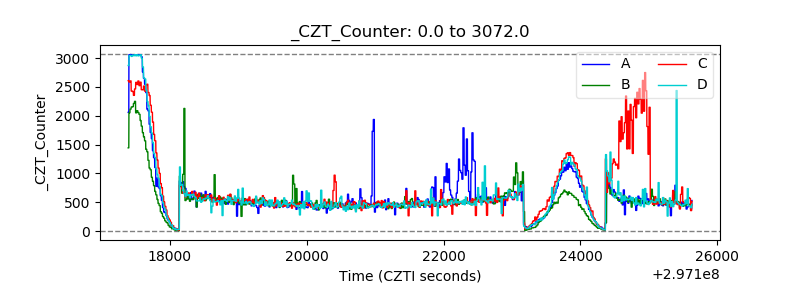 |
| +2.5 Volts monitor | 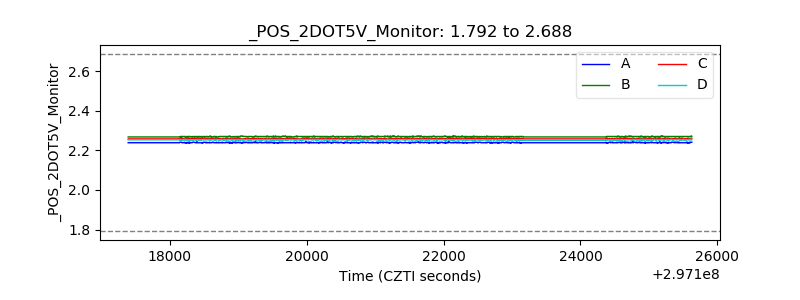 |
| +5 Volts monitor |  |
| _ROLL_ROT | 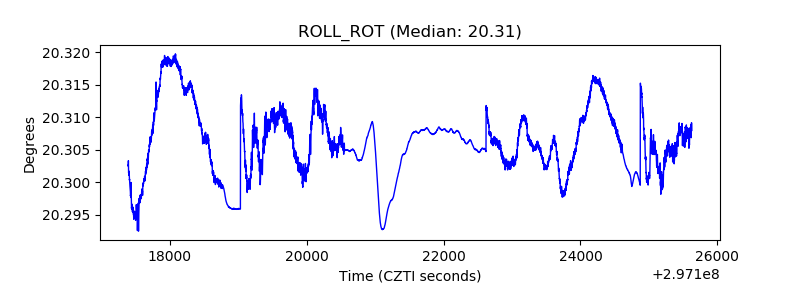 |
| _Roll_DEC | 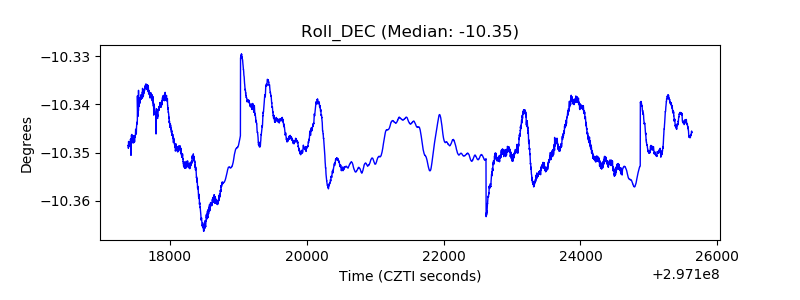 |
| _Roll_RA | 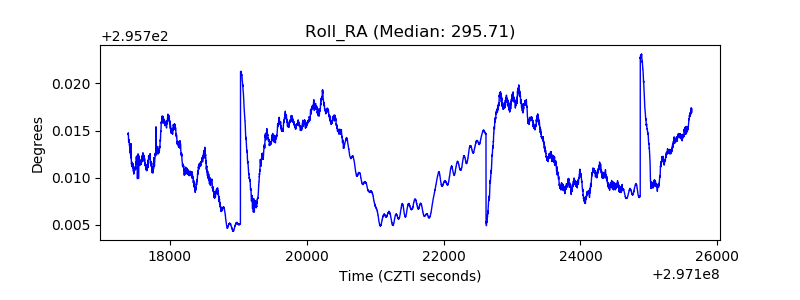 |
| Veto Counter | 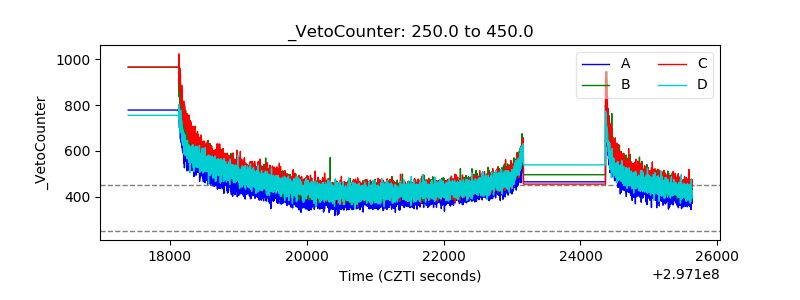 |