| Param | Original file | Final file |
|---|---|---|
| Filename | modeM0/AS1T03_118T01_9000002962_19876cztM0_level2.evt | modeM0/AS1T03_118T01_9000002962_19876cztM0_level2_quad_clean.evt |
| Size (bytes) | 597,055,680 | 97,499,520 |
| Size | 569.4 MB | 93.0 MB |
| Events in quadrant A | 5,048,231 | 621,419 |
| Events in quadrant B | 3,838,073 | 636,591 |
| Events in quadrant C | 4,639,086 | 589,396 |
| Events in quadrant D | 4,061,576 | 596,708 |
| Mode SS | |||
|---|---|---|---|
| Quadrant | BADHDUFLAG | Total packets | Discarded packets |
| A | 0 | 152 | 0 |
| B | 0 | 152 | 0 |
| C | 0 | 152 | 0 |
| D | 0 | 152 | 0 |
| Mode M9 | |||
|---|---|---|---|
| Quadrant | BADHDUFLAG | Total packets | Discarded packets |
| A | 0 | 20 | 0 |
| B | 0 | 20 | 0 |
| C | 0 | 20 | 0 |
| D | 0 | 20 | 0 |
| Mode M0 | |||
|---|---|---|---|
| Quadrant | BADHDUFLAG | Total packets | Discarded packets |
| A | 0 | 19717 | 2 |
| B | 0 | 16082 | 2 |
| C | 0 | 18307 | 2 |
| D | 0 | 16958 | 2 |
| Quadrant | Total seconds | Saturated seconds | Saturation percentage |
|---|---|---|---|
| A | 7295 | 173 | 2.371487% |
| B | 7296 | 150 | 2.055921% |
| C | 7296 | 508 | 6.962719% |
| D | 7296 | 107 | 1.466557% |
Noise dominated data is calculated using 1-second bins in cleaned event files. If a bin has >2000 counts, and if more than 50% of those come from <1% of pixels, then it is considered to be noise-dominated and hence unusable.
| Quadrant | # 1 sec bins | Bins with >0 counts | Bins with >2000 counts | High rate bins dominated by noise | Noise dominated (total time) | Noise dominated (detector-on time) | Marked lightcurve |
|---|---|---|---|---|---|---|---|
| A | 9350 | 7297 | 109 | 109 | 1.17% | 1.49% | 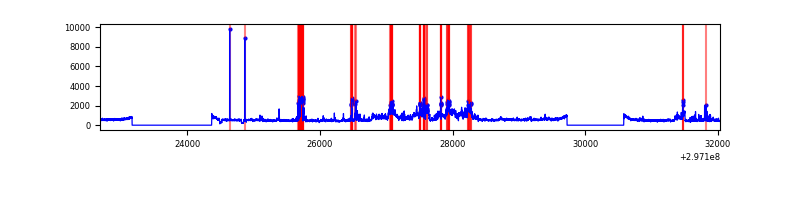 |
| B | 9351 | 7297 | 32 | 32 | 0.34% | 0.44% | 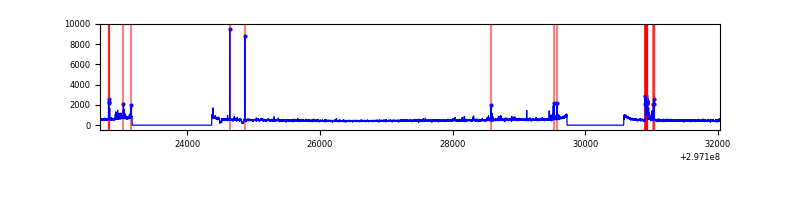 |
| C | 9351 | 7298 | 231 | 231 | 2.47% | 3.17% | 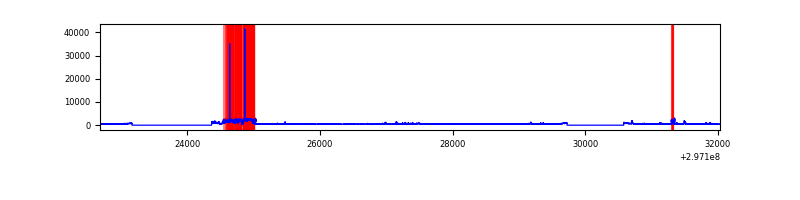 |
| D | 9351 | 7297 | 45 | 45 | 0.48% | 0.62% | 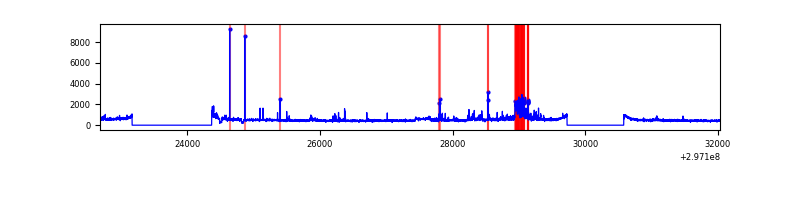 |
Top three noisy pixels from each quadrant. If the there are fewer than three noisy pixels in the level2.evt file, extra rows are filled as -1
| Pixel properties | Quadrant properties | ||||||
|---|---|---|---|---|---|---|---|
| Quadrant | DetID | PixID | Counts | Sigma | Mean | Median | Sigma |
| A | 14 | 238 | 1498291 | 8080.15 | 919 | 902 | 185.3 |
| A | 11 | 29 | 14484 | 73.29 | 919 | 902 | 185.3 |
| A | 0 | 226 | 7807 | 37.26 | 919 | 902 | 185.3 |
| B | 3 | 64 | 94786 | 529.3 | 924 | 901 | 177.4 |
| B | 7 | 220 | 71417 | 397.56 | 924 | 901 | 177.4 |
| B | 12 | 111 | 21741 | 117.49 | 924 | 901 | 177.4 |
| C | 9 | 221 | 1052671 | 5069.91 | 881 | 889 | 207.5 |
| C | 14 | 238 | 135106 | 646.97 | 881 | 889 | 207.5 |
| C | 7 | 220 | 18084 | 82.89 | 881 | 889 | 207.5 |
| D | 1 | 52 | 336377 | 1524.98 | 906 | 880 | 220.0 |
| D | 2 | 184 | 230741 | 1044.82 | 906 | 880 | 220.0 |
| D | 7 | 238 | 60921 | 272.91 | 906 | 880 | 220.0 |
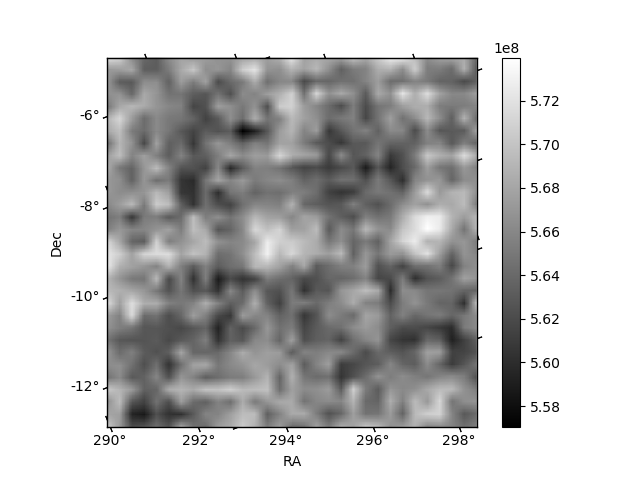
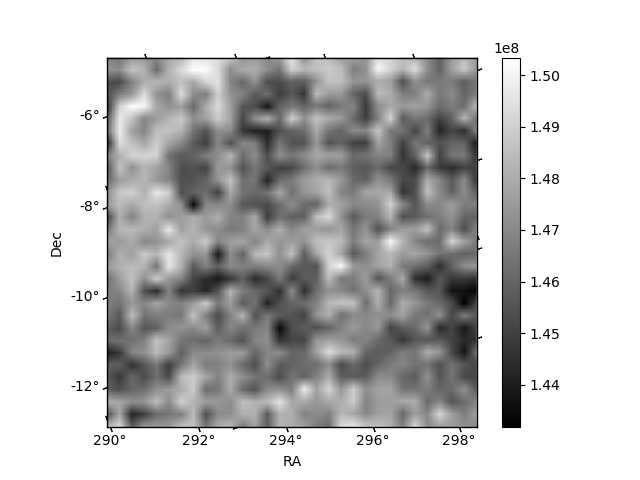
Histogram calculated using DETX and DETY for each event in the final _common_clean file
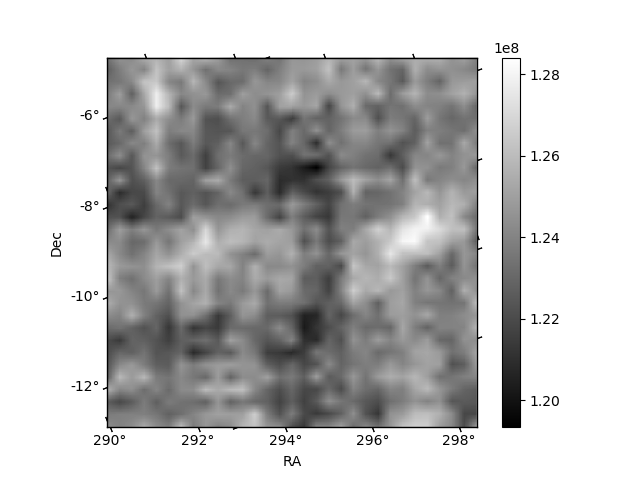
| Quadrant A | 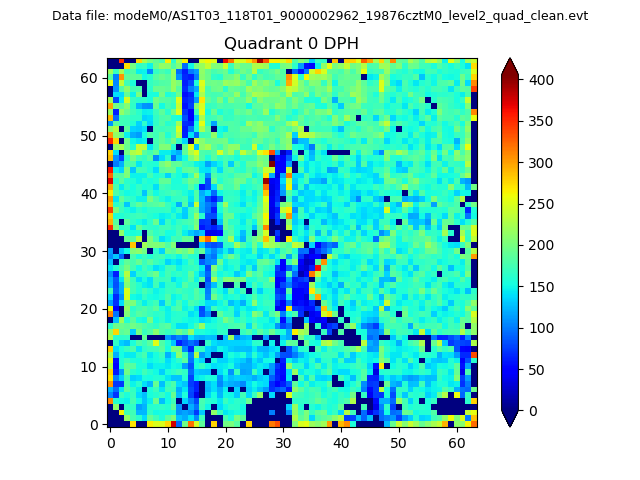 |
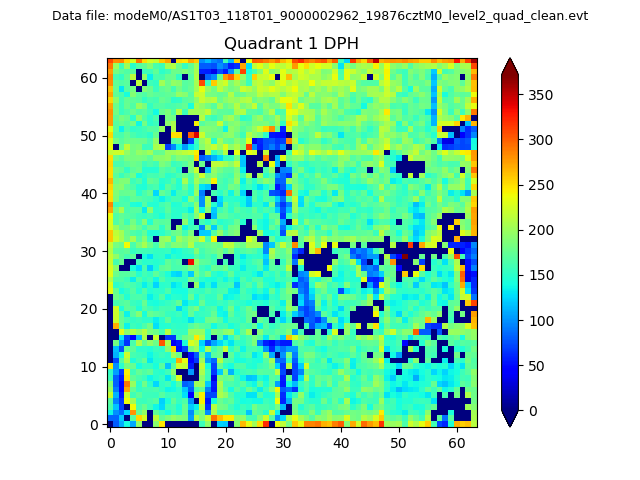 |
Quadrant B |
|---|---|---|---|
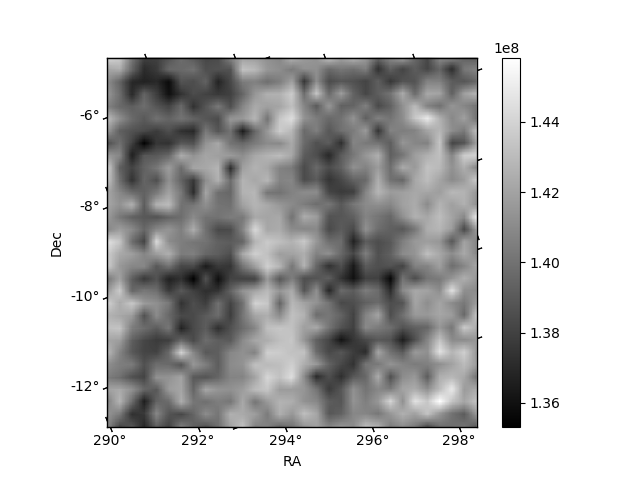
| Quadrant D |  |
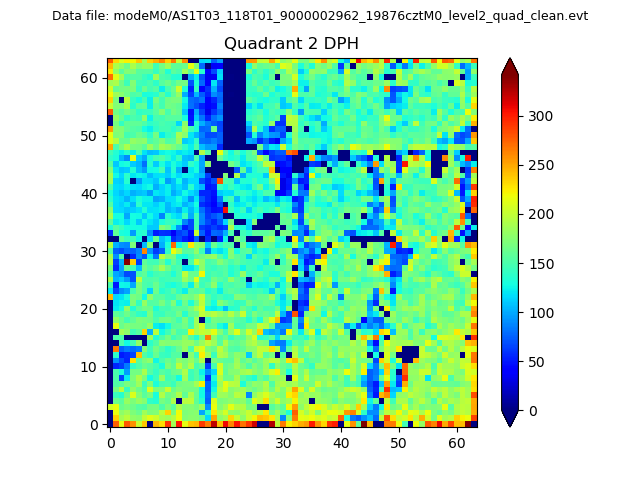 |
Quadrant C |
| Plot type | Count rate plots | Images |
|---|---|---|
| Comparison with Poisson distribution Blue bars denote a histogram of data divided into 1 sec bins. Red curve is a Poisson curve with rate = median count rate of data. |
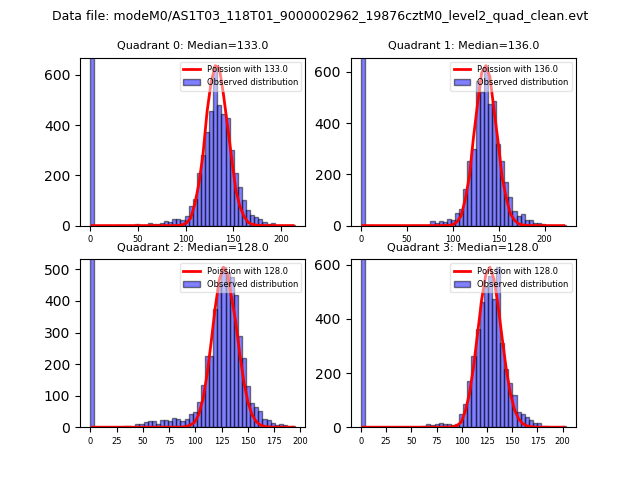 |
 |
| Quadrant-wise count rates Data is divided into 100 sec bins |
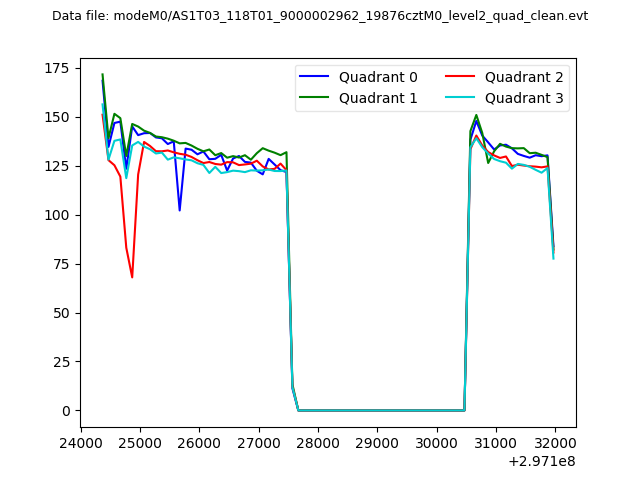 |
|
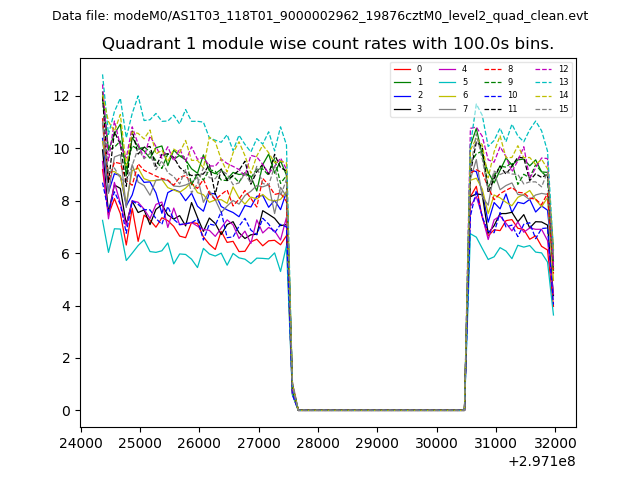
| Module-wise count rates for Quadrant A Data is divided into 100 sec bins |
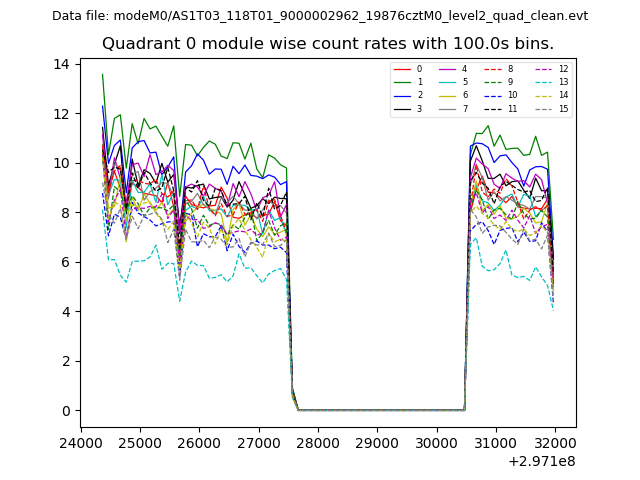 |
 |
| Module-wise count rates for Quadrant B Data is divided into 100 sec bins |
 |
 |
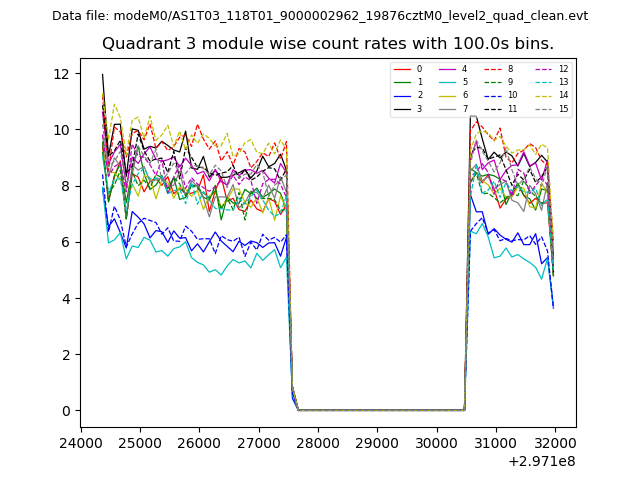
| Module-wise count rates for Quadrant C Data is divided into 100 sec bins |
 |
 |
| Module-wise count rates for Quadrant D Data is divided into 100 sec bins |
 |
 |
| Parameter | Plot |
|---|---|
| CZT HV Monitor | 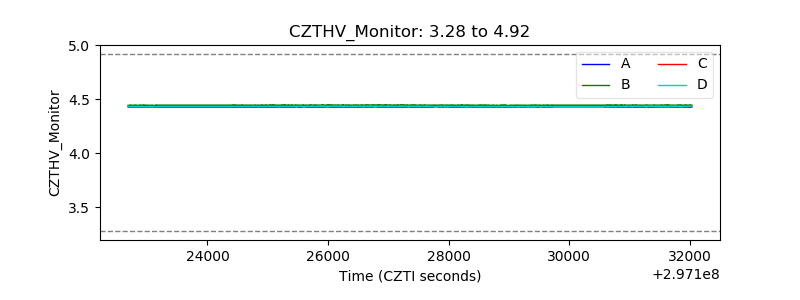 |
| D_VDD | 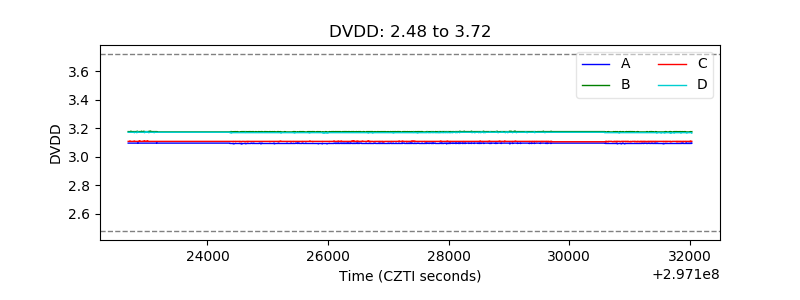 |
| Temperature 1 | 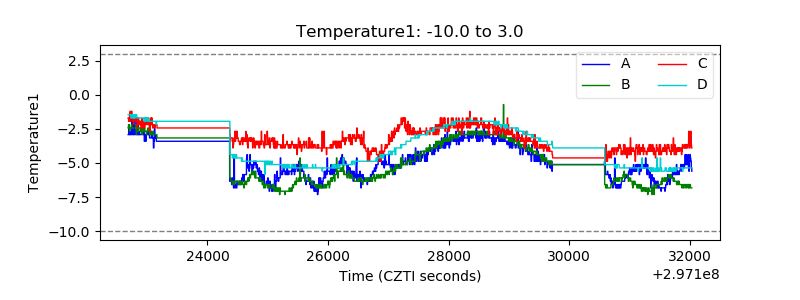 |
| Veto HV Monitor | 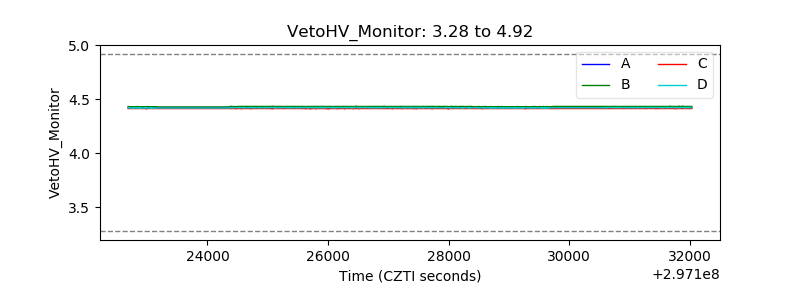 |
| Veto LLD | 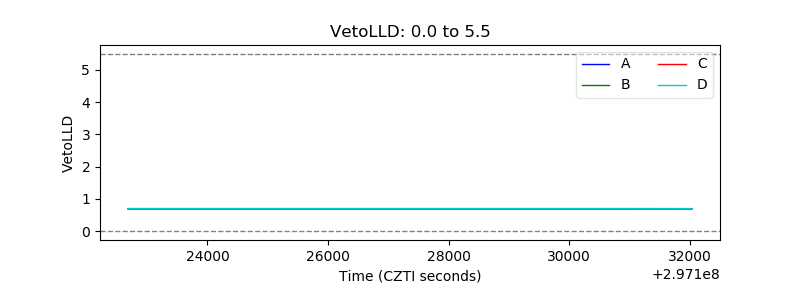 |
| Alpha Counter | 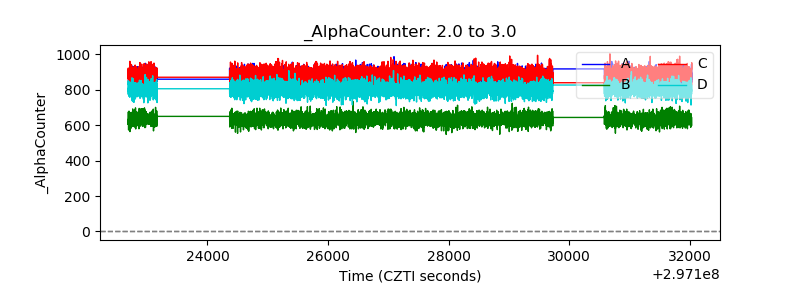 |
| _CPM_Rate | 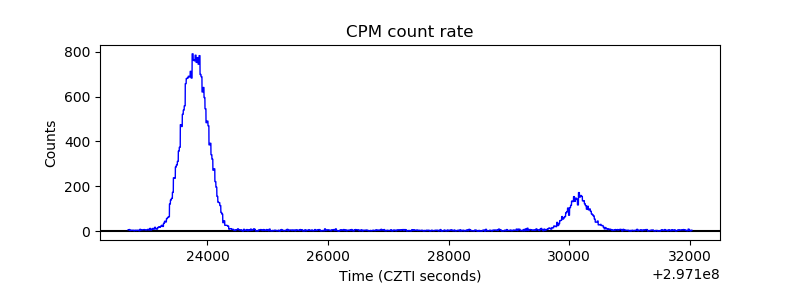 |
| CZT Counter | 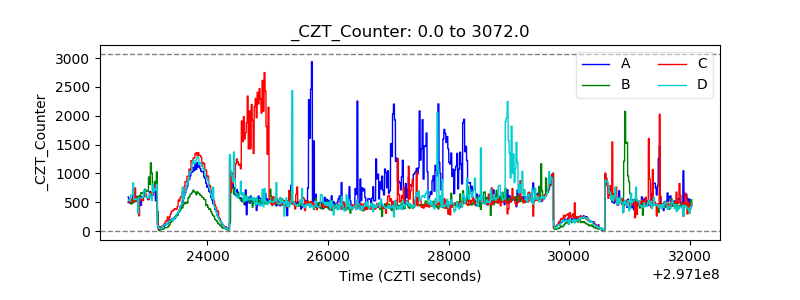 |
| +2.5 Volts monitor |  |
| +5 Volts monitor | 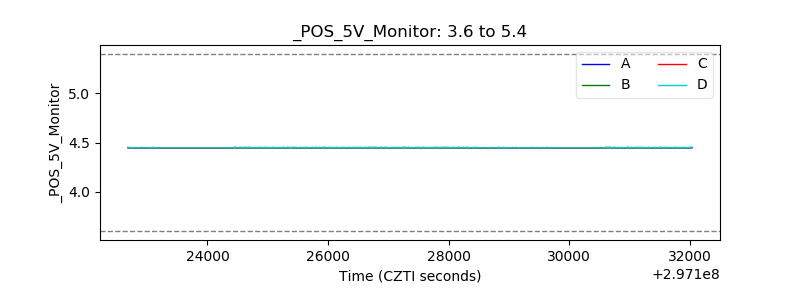 |
| _ROLL_ROT | 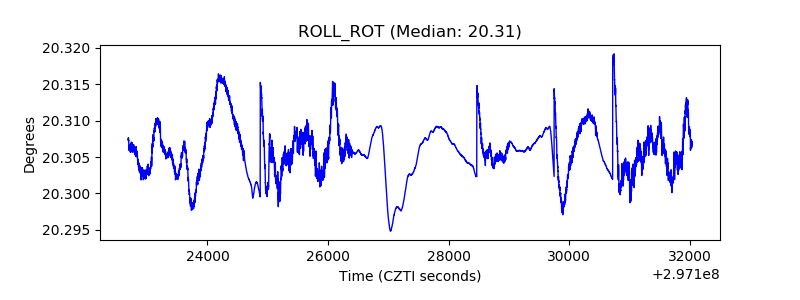 |
| _Roll_DEC | 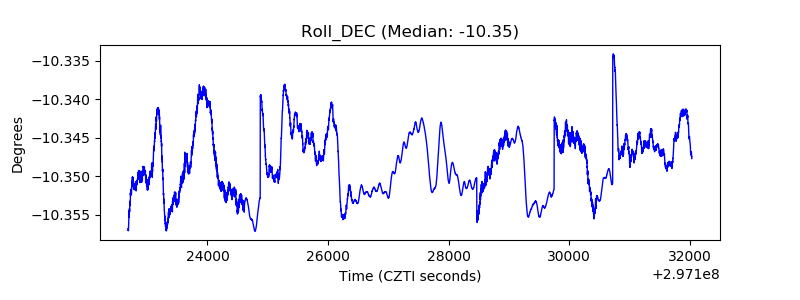 |
| _Roll_RA | 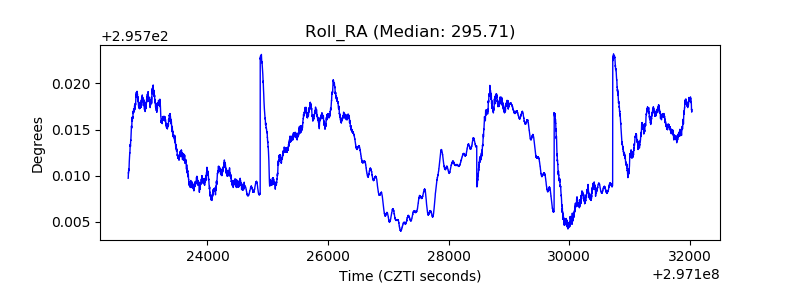 |
| Veto Counter | 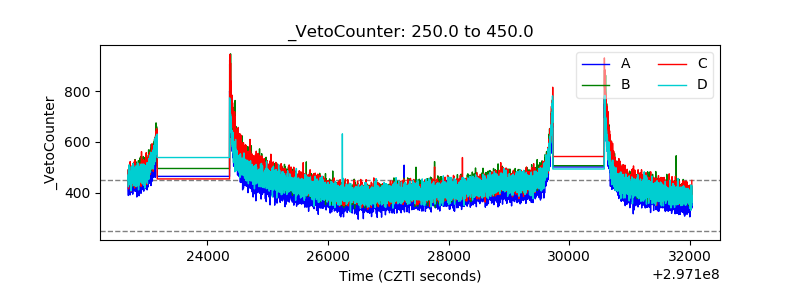 |