| Param | Original file | Final file |
|---|---|---|
| Filename | modeM0/AS1T03_118T01_9000002962_19877cztM0_level2.evt | modeM0/AS1T03_118T01_9000002962_19877cztM0_level2_quad_clean.evt |
| Size (bytes) | 568,474,560 | 103,132,800 |
| Size | 542.1 MB | 98.4 MB |
| Events in quadrant A | 4,510,339 | 660,111 |
| Events in quadrant B | 4,033,898 | 667,950 |
| Events in quadrant C | 4,148,216 | 634,881 |
| Events in quadrant D | 4,002,009 | 625,214 |
| Mode SS | |||
|---|---|---|---|
| Quadrant | BADHDUFLAG | Total packets | Discarded packets |
| A | 0 | 158 | 0 |
| B | 0 | 158 | 0 |
| C | 0 | 158 | 0 |
| D | 0 | 158 | 0 |
| Mode M9 | |||
|---|---|---|---|
| Quadrant | BADHDUFLAG | Total packets | Discarded packets |
| A | 0 | 13 | 0 |
| B | 0 | 13 | 0 |
| C | 0 | 13 | 0 |
| D | 0 | 13 | 0 |
| Mode M0 | |||
|---|---|---|---|
| Quadrant | BADHDUFLAG | Total packets | Discarded packets |
| A | 0 | 18361 | 2 |
| B | 0 | 16959 | 3 |
| C | 0 | 17242 | 2 |
| D | 0 | 17102 | 2 |
| Quadrant | Total seconds | Saturated seconds | Saturation percentage |
|---|---|---|---|
| A | 7694 | 131 | 1.702625% |
| B | 7693 | 213 | 2.768751% |
| C | 7693 | 265 | 3.444690% |
| D | 7694 | 103 | 1.338705% |
Noise dominated data is calculated using 1-second bins in cleaned event files. If a bin has >2000 counts, and if more than 50% of those come from <1% of pixels, then it is considered to be noise-dominated and hence unusable.
| Quadrant | # 1 sec bins | Bins with >0 counts | Bins with >2000 counts | High rate bins dominated by noise | Noise dominated (total time) | Noise dominated (detector-on time) | Marked lightcurve |
|---|---|---|---|---|---|---|---|
| A | 8999 | 7696 | 50 | 50 | 0.56% | 0.65% | 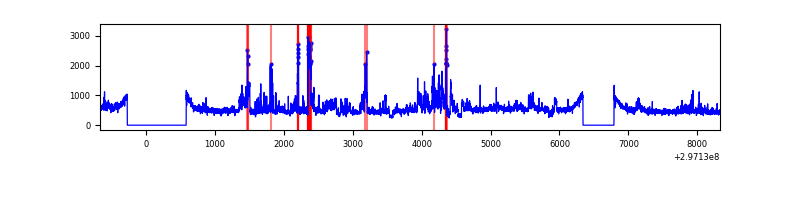 |
| B | 8998 | 7694 | 51 | 51 | 0.57% | 0.66% | 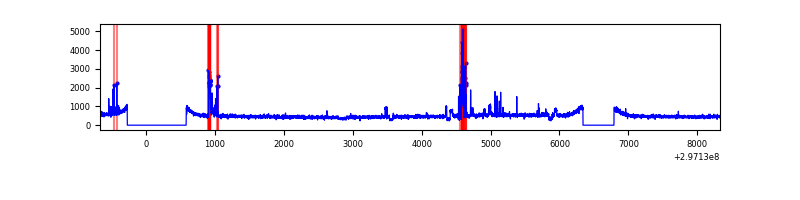 |
| C | 8998 | 7694 | 31 | 31 | 0.34% | 0.40% | 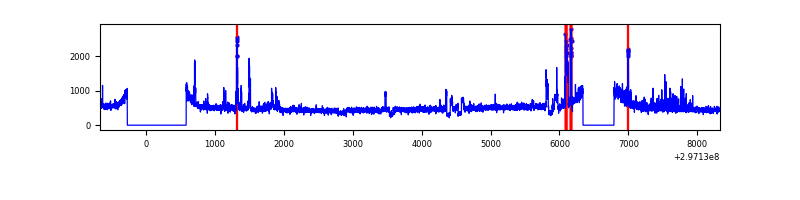 |
| D | 8999 | 7695 | 40 | 40 | 0.44% | 0.52% | 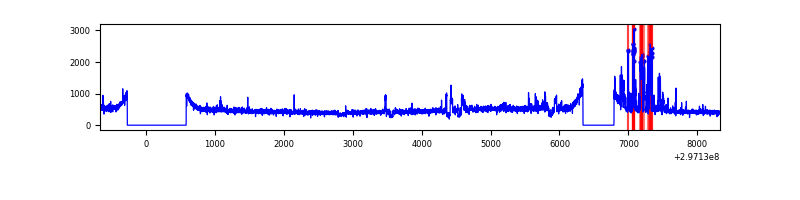 |
Top three noisy pixels from each quadrant. If the there are fewer than three noisy pixels in the level2.evt file, extra rows are filled as -1
| Pixel properties | Quadrant properties | ||||||
|---|---|---|---|---|---|---|---|
| Quadrant | DetID | PixID | Counts | Sigma | Mean | Median | Sigma |
| A | 14 | 238 | 797200 | 4065.31 | 963 | 944 | 195.9 |
| A | 0 | 226 | 8195 | 37.02 | 963 | 944 | 195.9 |
| A | 3 | 137 | 8072 | 36.39 | 963 | 944 | 195.9 |
| B | 7 | 220 | 138843 | 746.41 | 959 | 938 | 184.8 |
| B | 3 | 64 | 94019 | 503.8 | 959 | 938 | 184.8 |
| B | 12 | 111 | 23156 | 120.25 | 959 | 938 | 184.8 |
| C | 9 | 221 | 370596 | 1680.6 | 929 | 936 | 220.0 |
| C | 14 | 238 | 142590 | 644.01 | 929 | 936 | 220.0 |
| C | 7 | 220 | 8349 | 33.7 | 929 | 936 | 220.0 |
| D | 1 | 52 | 326545 | 1418.14 | 943 | 917 | 229.6 |
| D | 2 | 184 | 59222 | 253.92 | 943 | 917 | 229.6 |
| D | 7 | 238 | 53619 | 229.52 | 943 | 917 | 229.6 |
Histogram calculated using DETX and DETY for each event in the final _common_clean file
| Quadrant A | 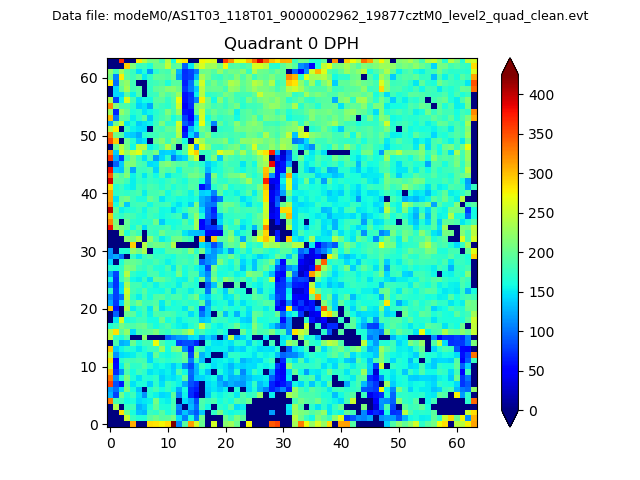 |
 |
Quadrant B |
|---|---|---|---|
| Quadrant D |  |
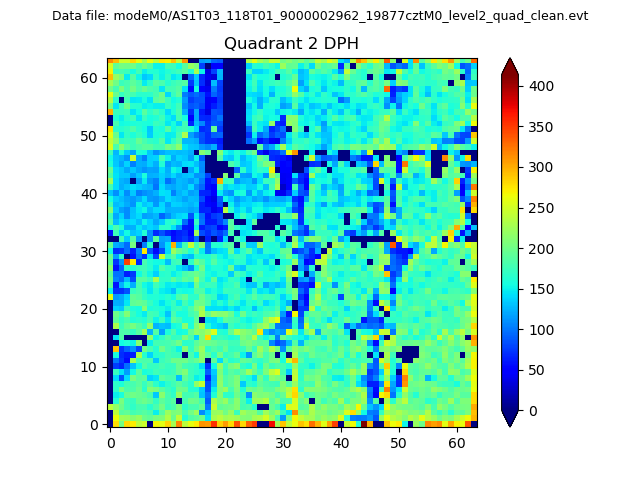 |
Quadrant C |
| Plot type | Count rate plots | Images |
|---|---|---|
| Comparison with Poisson distribution Blue bars denote a histogram of data divided into 1 sec bins. Red curve is a Poisson curve with rate = median count rate of data. |
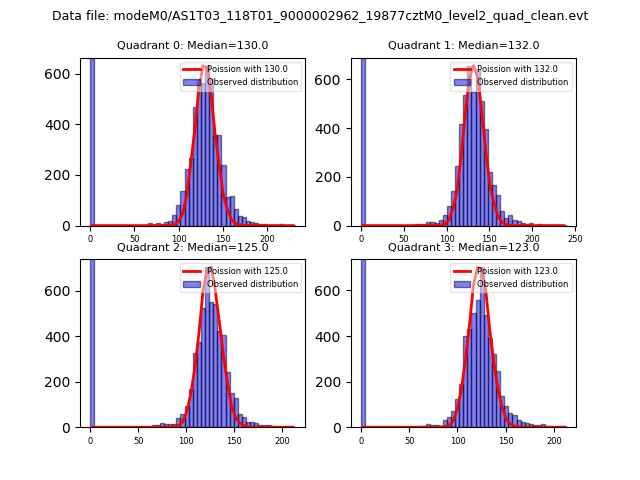 |
 |
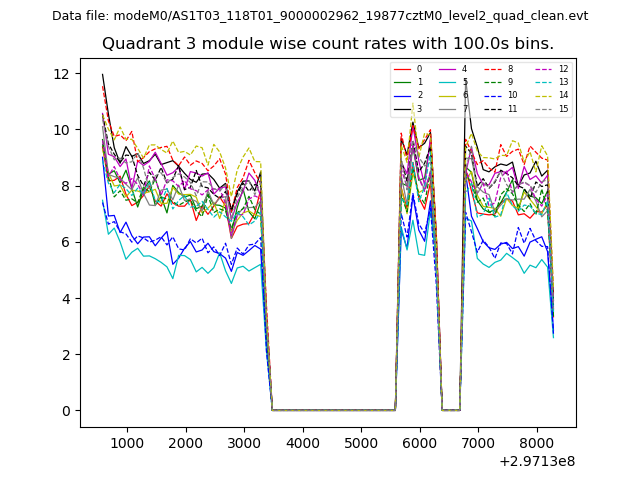
| Quadrant-wise count rates Data is divided into 100 sec bins |
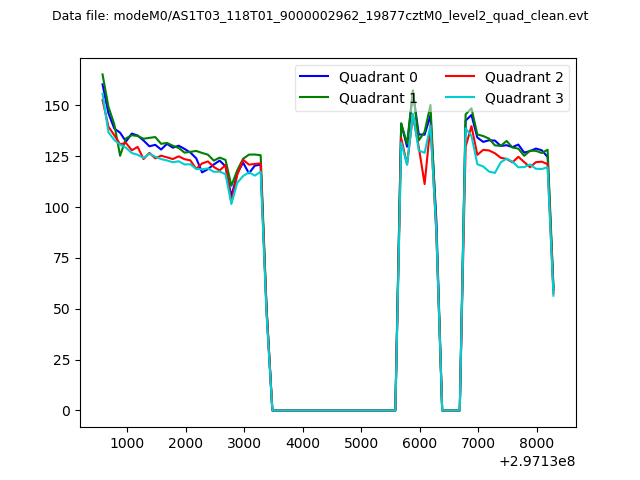 |
|
| Module-wise count rates for Quadrant A Data is divided into 100 sec bins |
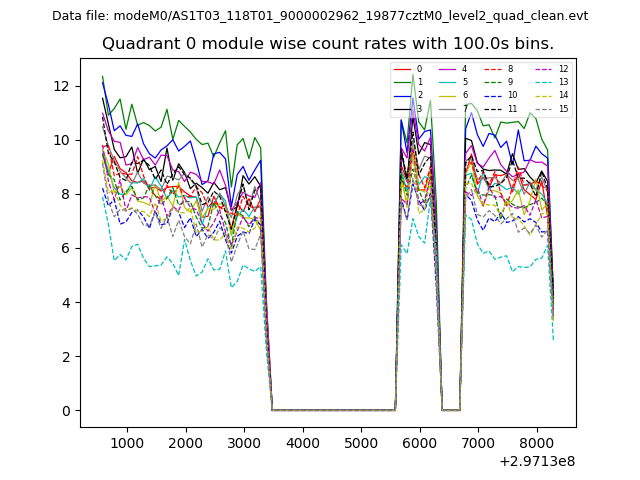 |
 |
| Module-wise count rates for Quadrant B Data is divided into 100 sec bins |
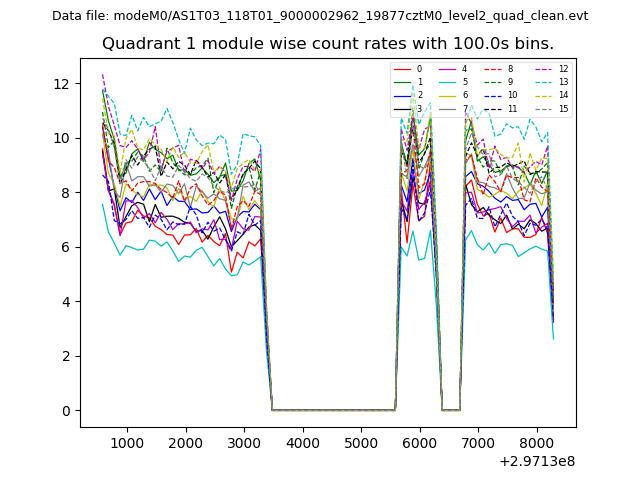 |
 |
| Module-wise count rates for Quadrant C Data is divided into 100 sec bins |
 |
 |
| Module-wise count rates for Quadrant D Data is divided into 100 sec bins |
 |
 |
| Parameter | Plot |
|---|---|
| CZT HV Monitor |  |
| D_VDD | 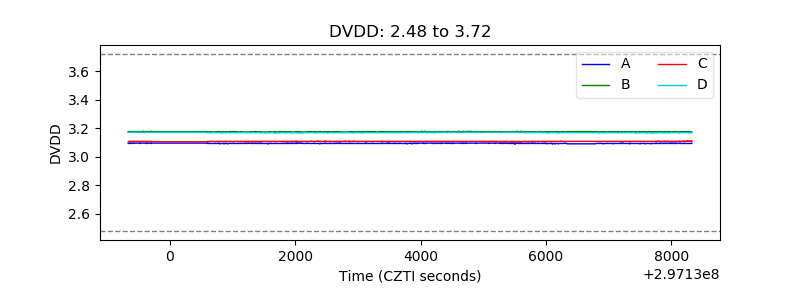 |
| Temperature 1 | 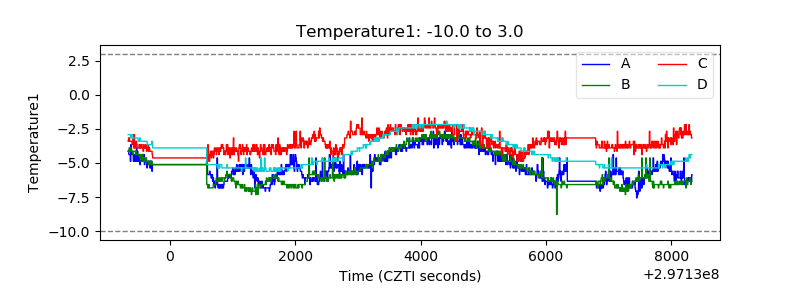 |
| Veto HV Monitor | 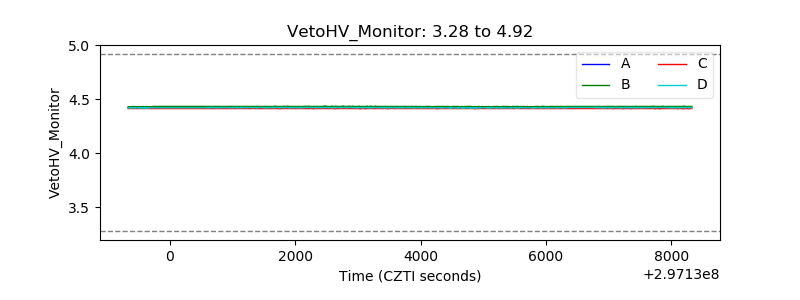 |
| Veto LLD | 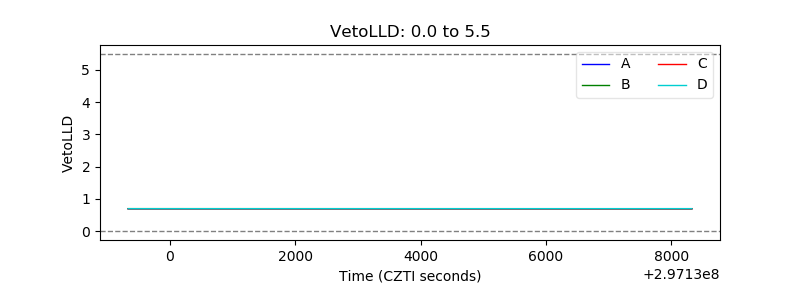 |
| Alpha Counter | 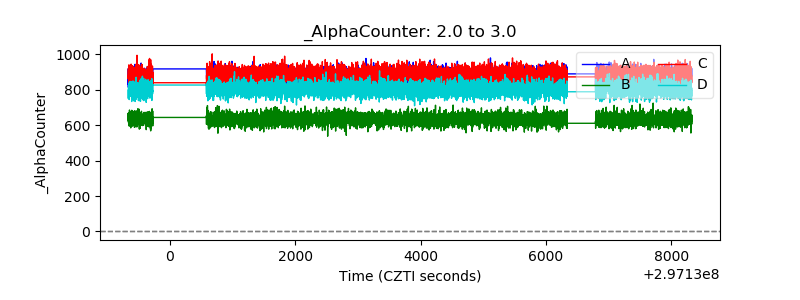 |
| _CPM_Rate | 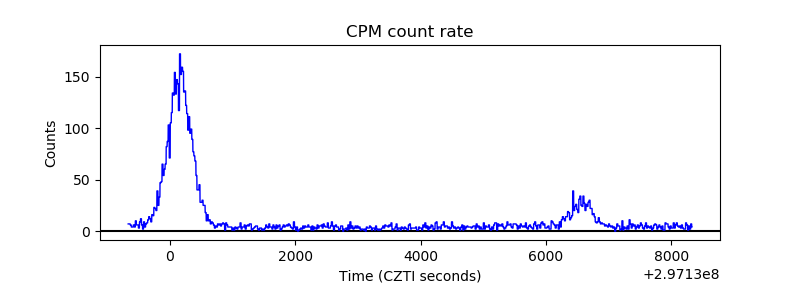 |
| CZT Counter | 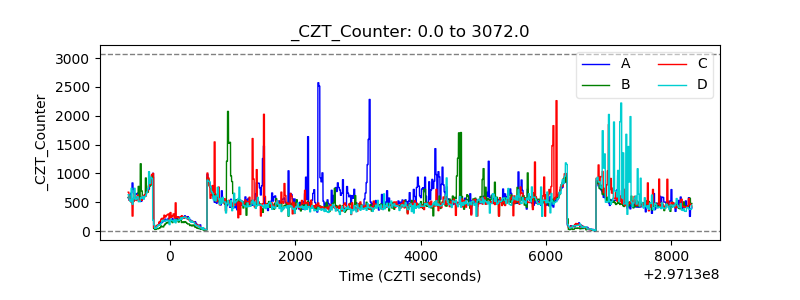 |
| +2.5 Volts monitor |  |
| +5 Volts monitor |  |
| _ROLL_ROT | 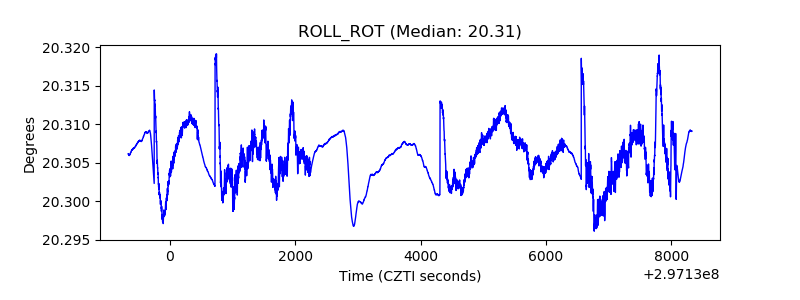 |
| _Roll_DEC | 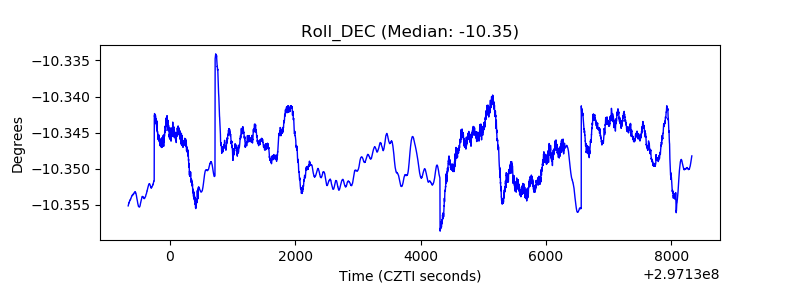 |
| _Roll_RA | 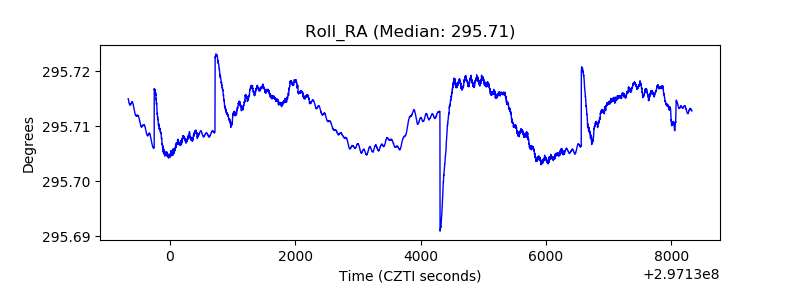 |
| Veto Counter | 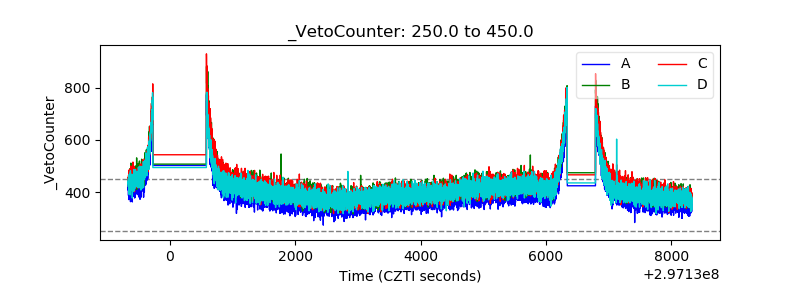 |