| Param | Original file | Final file |
|---|---|---|
| Filename | modeM0/AS1T03_118T01_9000002962_19878cztM0_level2.evt | modeM0/AS1T03_118T01_9000002962_19878cztM0_level2_quad_clean.evt |
| Size (bytes) | 606,047,040 | 120,591,360 |
| Size | 578.0 MB | 115.0 MB |
| Events in quadrant A | 5,094,666 | 780,143 |
| Events in quadrant B | 4,046,831 | 796,428 |
| Events in quadrant C | 4,258,948 | 758,495 |
| Events in quadrant D | 4,391,328 | 740,851 |
| Mode SS | |||
|---|---|---|---|
| Quadrant | BADHDUFLAG | Total packets | Discarded packets |
| A | 0 | 170 | 0 |
| B | 0 | 170 | 0 |
| C | 0 | 170 | 0 |
| D | 0 | 170 | 0 |
| Mode M9 | |||
|---|---|---|---|
| Quadrant | BADHDUFLAG | Total packets | Discarded packets |
| A | 0 | 7 | 0 |
| B | 0 | 7 | 0 |
| C | 0 | 7 | 0 |
| D | 0 | 7 | 0 |
| Mode M0 | |||
|---|---|---|---|
| Quadrant | BADHDUFLAG | Total packets | Discarded packets |
| A | 0 | 20483 | 2 |
| B | 0 | 17390 | 2 |
| C | 0 | 18066 | 2 |
| D | 0 | 18747 | 2 |
| Quadrant | Total seconds | Saturated seconds | Saturation percentage |
|---|---|---|---|
| A | 8288 | 404 | 4.874517% |
| B | 8289 | 261 | 3.148751% |
| C | 8289 | 343 | 4.138014% |
| D | 8289 | 242 | 2.919532% |
Noise dominated data is calculated using 1-second bins in cleaned event files. If a bin has >2000 counts, and if more than 50% of those come from <1% of pixels, then it is considered to be noise-dominated and hence unusable.
| Quadrant | # 1 sec bins | Bins with >0 counts | Bins with >2000 counts | High rate bins dominated by noise | Noise dominated (total time) | Noise dominated (detector-on time) | Marked lightcurve |
|---|---|---|---|---|---|---|---|
| A | 8908 | 8289 | 185 | 185 | 2.08% | 2.23% | 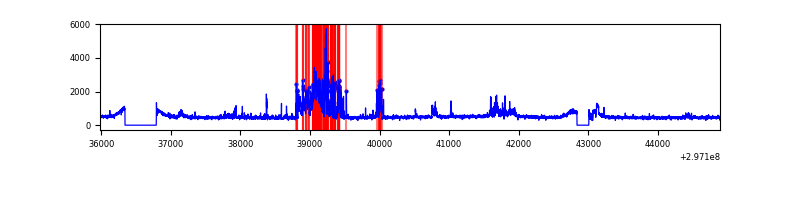 |
| B | 8909 | 8290 | 1 | 1 | 0.01% | 0.01% | 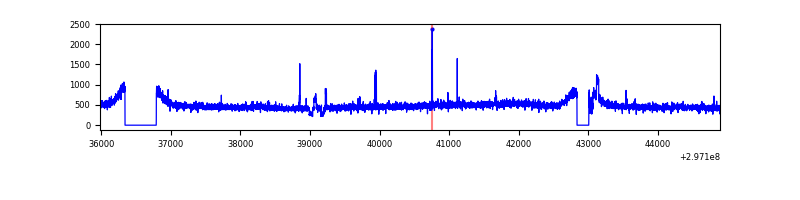 |
| C | 8909 | 8290 | 25 | 25 | 0.28% | 0.30% | 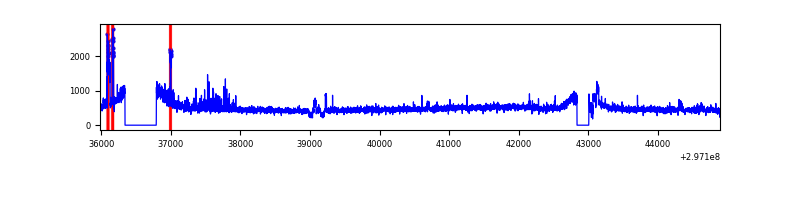 |
| D | 8909 | 8289 | 61 | 61 | 0.68% | 0.74% | 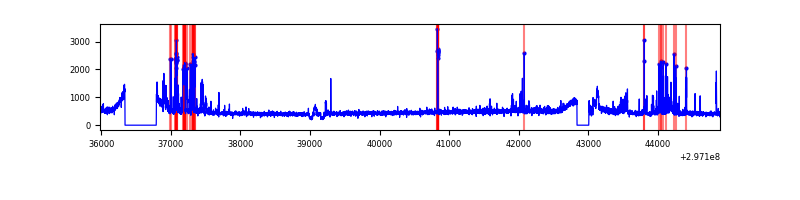 |
Top three noisy pixels from each quadrant. If the there are fewer than three noisy pixels in the level2.evt file, extra rows are filled as -1
| Pixel properties | Quadrant properties | ||||||
|---|---|---|---|---|---|---|---|
| Quadrant | DetID | PixID | Counts | Sigma | Mean | Median | Sigma |
| A | 14 | 238 | 822761 | 3910.05 | 1026 | 1004 | 210.2 |
| A | 5 | 16 | 324620 | 1539.82 | 1026 | 1004 | 210.2 |
| A | 3 | 137 | 8837 | 37.27 | 1026 | 1004 | 210.2 |
| B | 12 | 111 | 24935 | 120.6 | 1023 | 993 | 198.5 |
| B | 11 | 111 | 22459 | 108.12 | 1023 | 993 | 198.5 |
| B | 14 | 111 | 19709 | 94.27 | 1023 | 993 | 198.5 |
| C | 9 | 221 | 236152 | 1010.83 | 989 | 993 | 232.6 |
| C | 14 | 238 | 150864 | 644.22 | 989 | 993 | 232.6 |
| C | 7 | 220 | 10886 | 42.52 | 989 | 993 | 232.6 |
| D | 1 | 52 | 284593 | 1157.42 | 1007 | 981 | 245.0 |
| D | 2 | 184 | 204732 | 831.5 | 1007 | 981 | 245.0 |
| D | 7 | 238 | 46603 | 186.18 | 1007 | 981 | 245.0 |
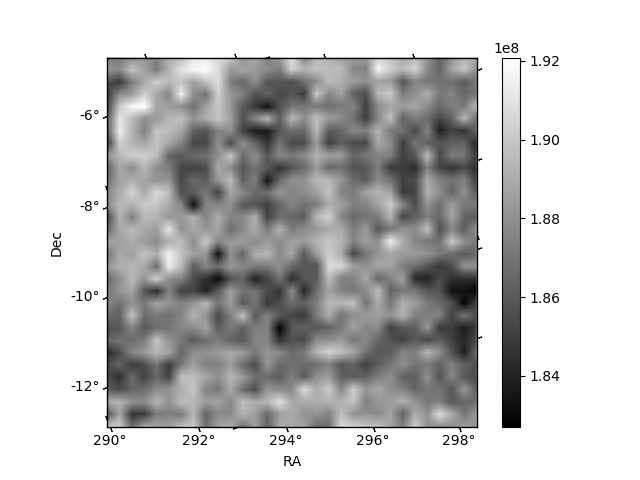
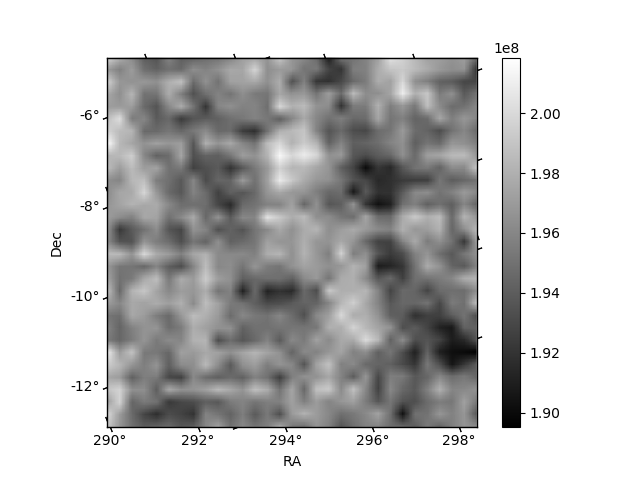
Histogram calculated using DETX and DETY for each event in the final _common_clean file
| Quadrant A | 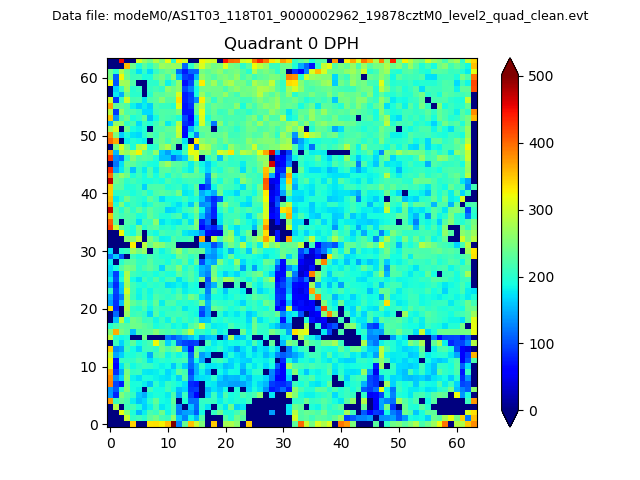 |
 |
Quadrant B |
|---|---|---|---|
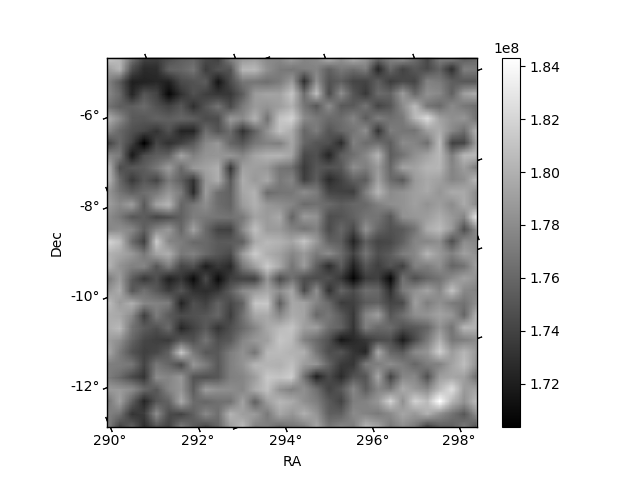
| Quadrant D | 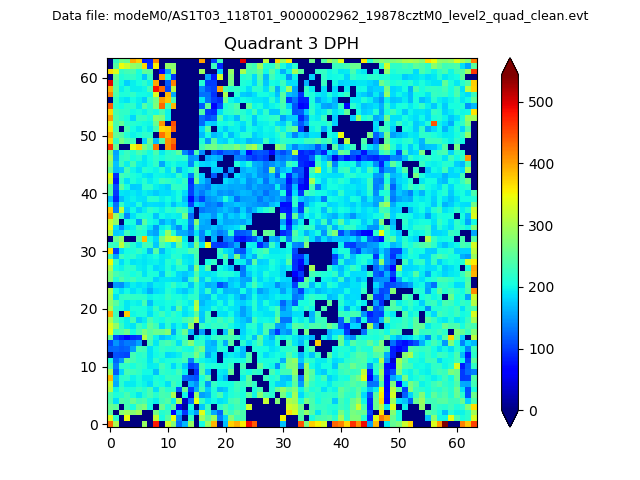 |
 |
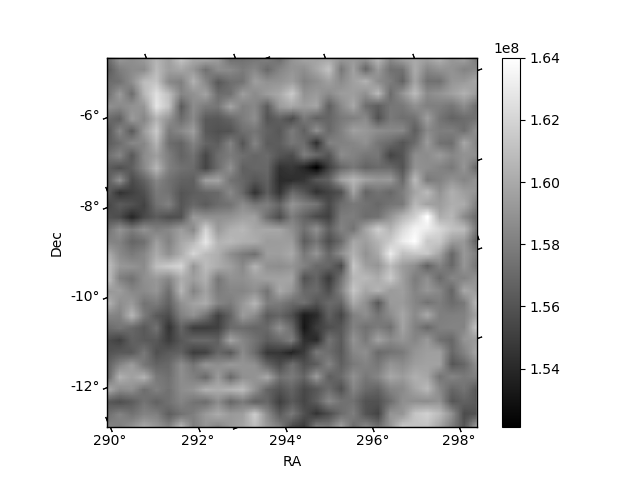
Quadrant C |
| Plot type | Count rate plots | Images |
|---|---|---|
| Comparison with Poisson distribution Blue bars denote a histogram of data divided into 1 sec bins. Red curve is a Poisson curve with rate = median count rate of data. |
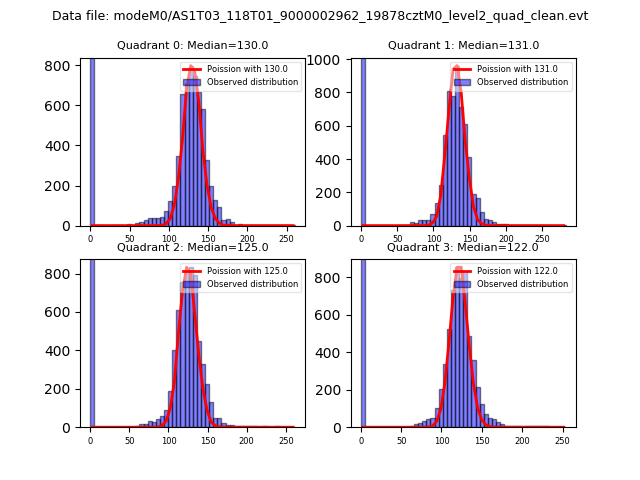 |
 |
| Quadrant-wise count rates Data is divided into 100 sec bins |
 |
|
| Module-wise count rates for Quadrant A Data is divided into 100 sec bins |
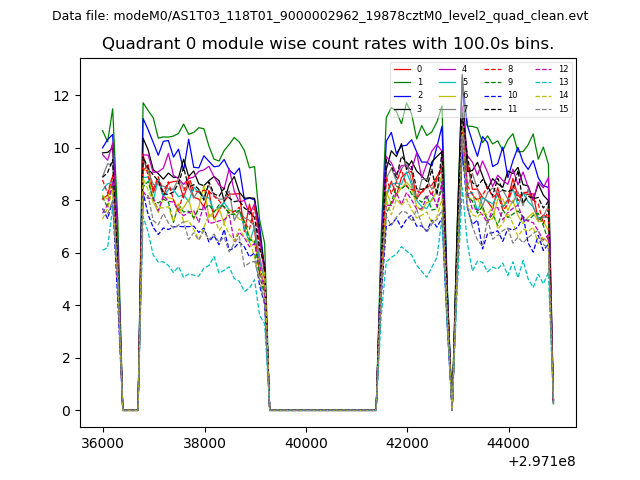 |
 |
| Module-wise count rates for Quadrant B Data is divided into 100 sec bins |
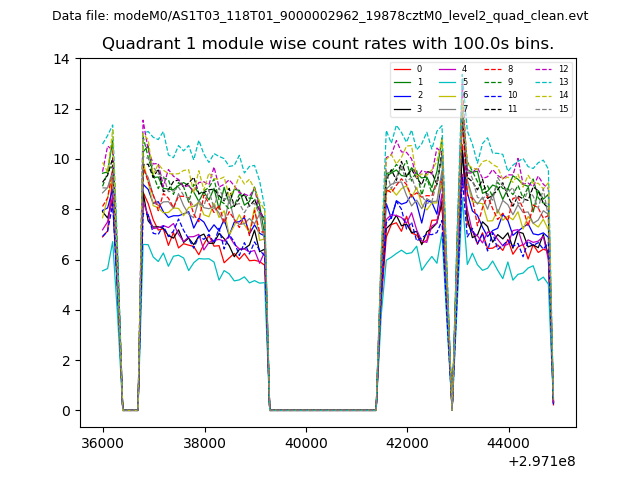 |
 |
| Module-wise count rates for Quadrant C Data is divided into 100 sec bins |
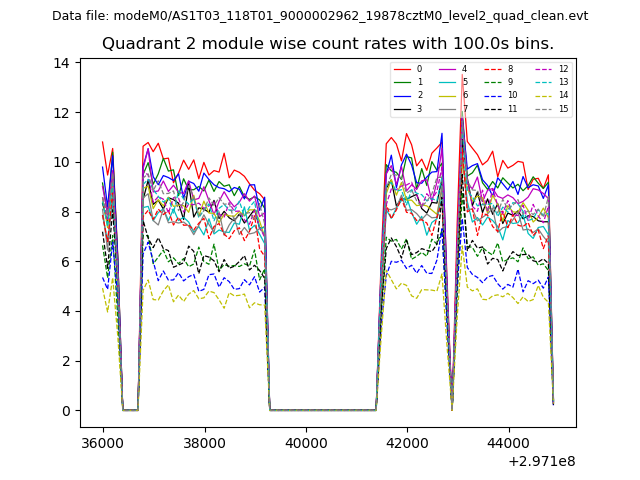 |
 |
| Module-wise count rates for Quadrant D Data is divided into 100 sec bins |
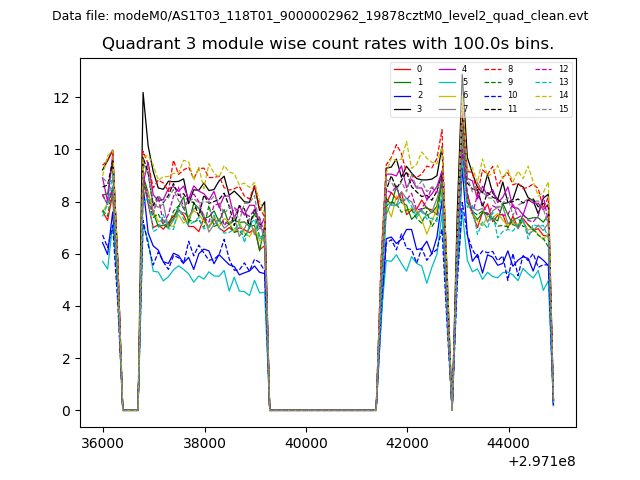 |
 |
| Parameter | Plot |
|---|---|
| CZT HV Monitor | 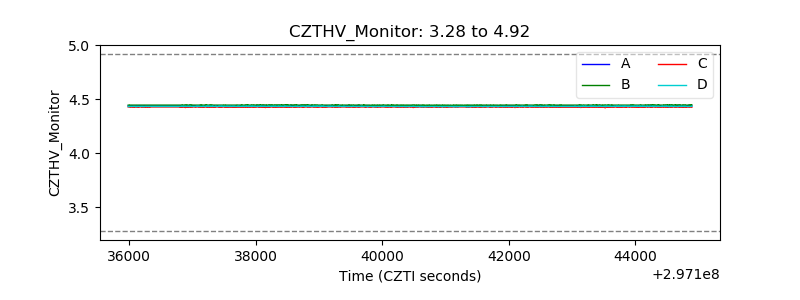 |
| D_VDD | 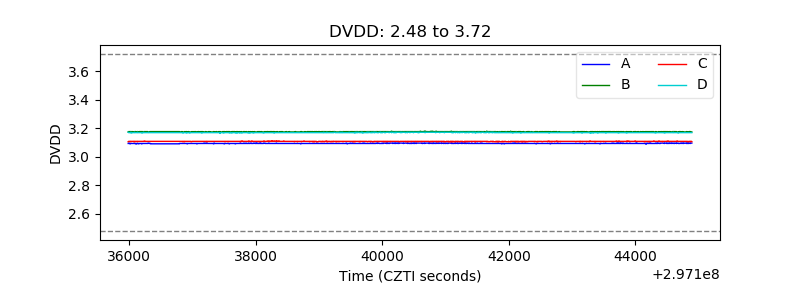 |
| Temperature 1 | 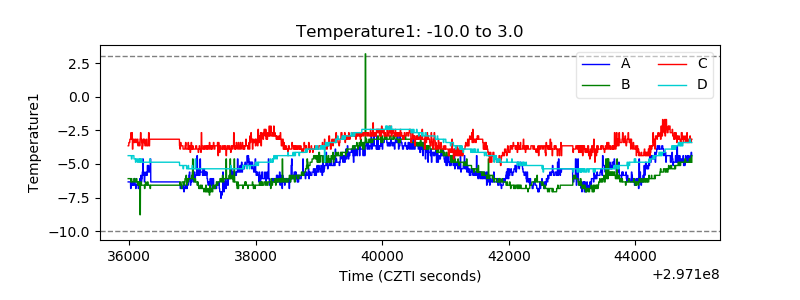 |
| Veto HV Monitor | 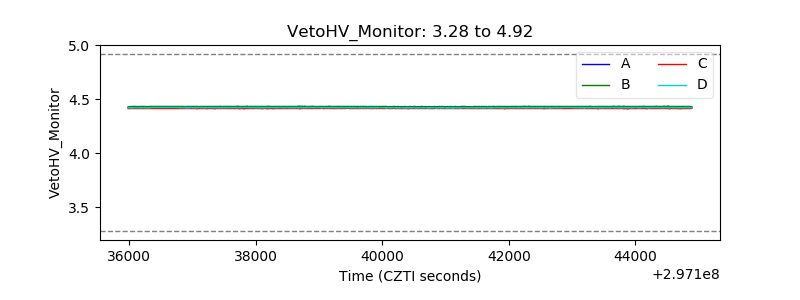 |
| Veto LLD | 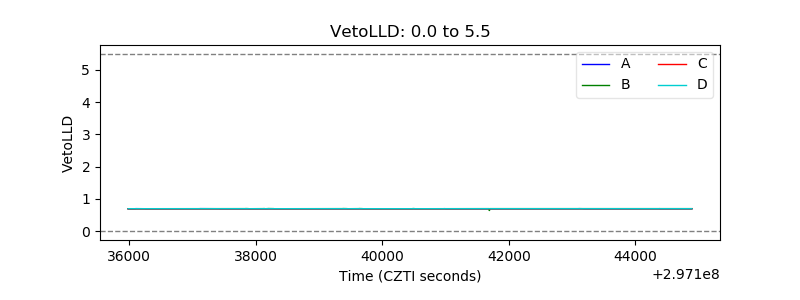 |
| Alpha Counter | 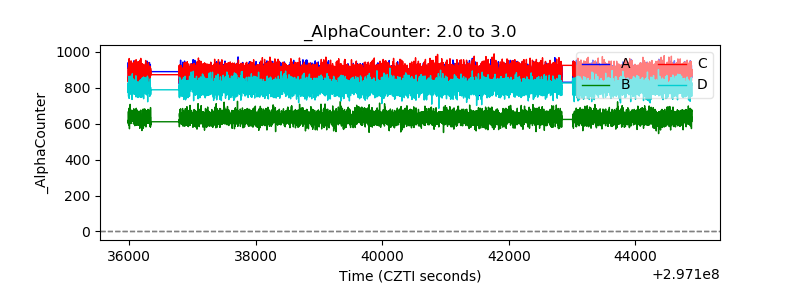 |
| _CPM_Rate | 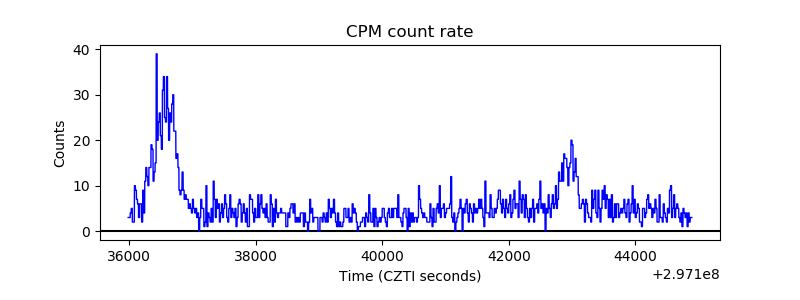 |
| CZT Counter | 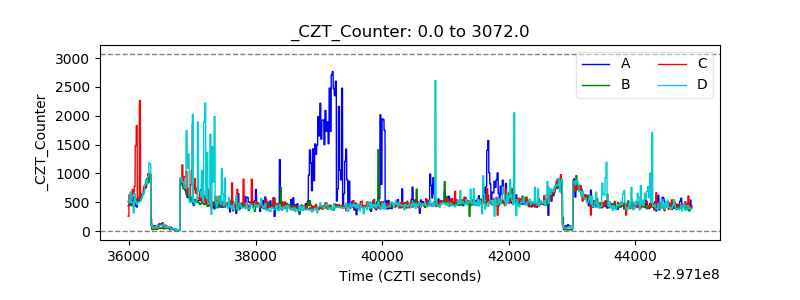 |
| +2.5 Volts monitor |  |
| +5 Volts monitor | 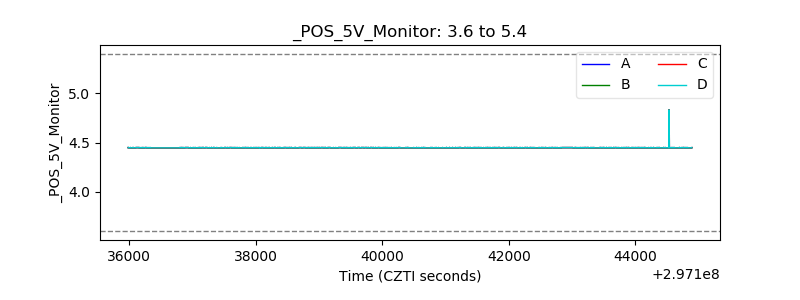 |
| _ROLL_ROT | 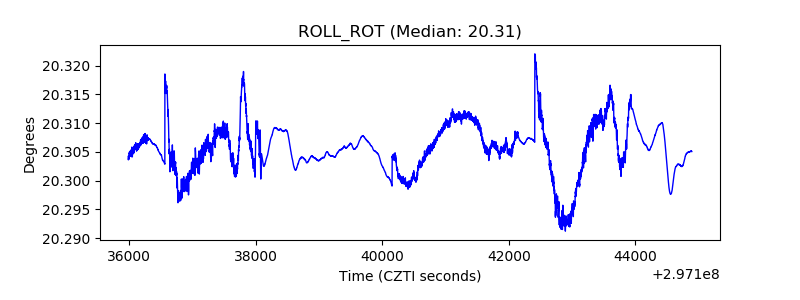 |
| _Roll_DEC | 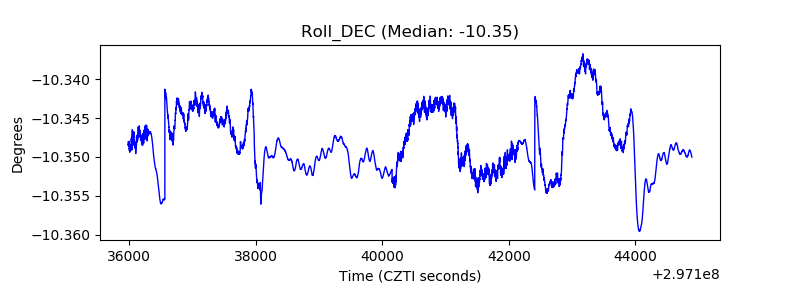 |
| _Roll_RA | 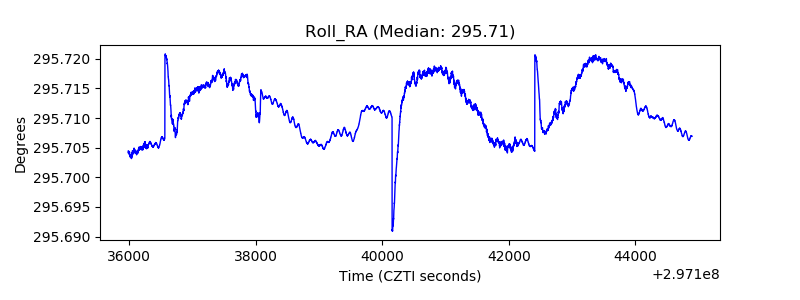 |
| Veto Counter | 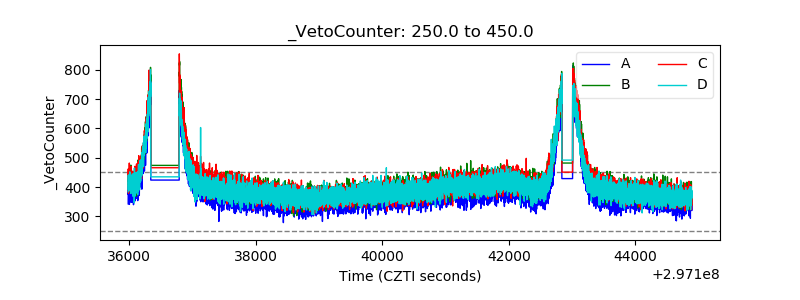 |