| Param | Original file | Final file |
|---|---|---|
| Filename | modeM0/AS1T03_118T01_9000002962_19882cztM0_level2.evt | modeM0/AS1T03_118T01_9000002962_19882cztM0_level2_quad_clean.evt |
| Size (bytes) | 1,289,577,600 | 211,982,400 |
| Size | 1.2 GB | 202.2 MB |
| Events in quadrant A | 9,852,199 | 1,320,120 |
| Events in quadrant B | 8,868,231 | 1,336,295 |
| Events in quadrant C | 8,794,276 | 1,271,277 |
| Events in quadrant D | 10,305,751 | 1,233,801 |
| Mode SS | |||
|---|---|---|---|
| Quadrant | BADHDUFLAG | Total packets | Discarded packets |
| A | 0 | 370 | 0 |
| B | 0 | 370 | 0 |
| C | 0 | 370 | 0 |
| D | 0 | 370 | 0 |
| Mode M9 | |||
|---|---|---|---|
| Quadrant | BADHDUFLAG | Total packets | Discarded packets |
| A | 0 | 21 | 0 |
| B | 0 | 21 | 0 |
| C | 0 | 21 | 0 |
| D | 0 | 21 | 0 |
| Mode M0 | |||
|---|---|---|---|
| Quadrant | BADHDUFLAG | Total packets | Discarded packets |
| A | 0 | 41000 | 3 |
| B | 0 | 37745 | 3 |
| C | 0 | 37585 | 3 |
| D | 0 | 42558 | 3 |
| Quadrant | Total seconds | Saturated seconds | Saturation percentage |
|---|---|---|---|
| A | 18263 | 439 | 2.403767% |
| B | 18263 | 242 | 1.325084% |
| C | 18263 | 258 | 1.412692% |
| D | 18264 | 572 | 3.131844% |
Noise dominated data is calculated using 1-second bins in cleaned event files. If a bin has >2000 counts, and if more than 50% of those come from <1% of pixels, then it is considered to be noise-dominated and hence unusable.
| Quadrant | # 1 sec bins | Bins with >0 counts | Bins with >2000 counts | High rate bins dominated by noise | Noise dominated (total time) | Noise dominated (detector-on time) | Marked lightcurve |
|---|---|---|---|---|---|---|---|
| A | 20278 | 18263 | 136 | 136 | 0.67% | 0.74% | 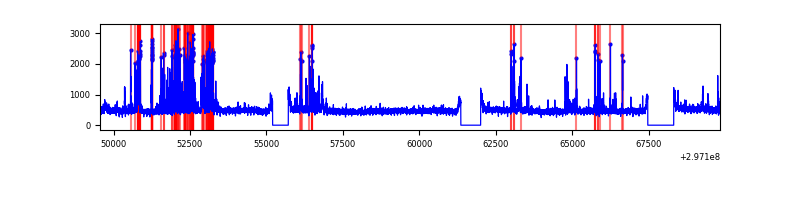 |
| B | 20278 | 18263 | 14 | 14 | 0.07% | 0.08% | 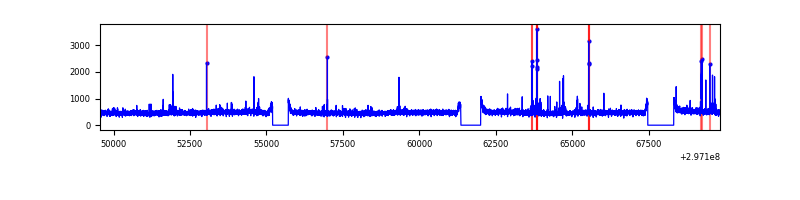 |
| C | 20278 | 18263 | 2 | 2 | 0.01% | 0.01% |  |
| D | 20279 | 18264 | 418 | 418 | 2.06% | 2.29% | 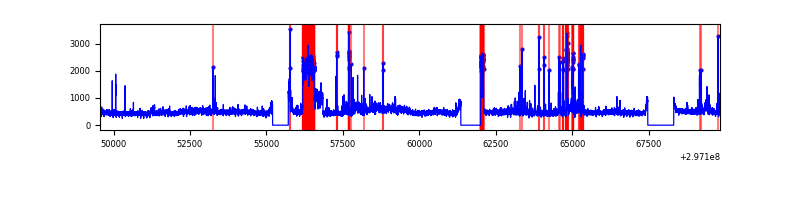 |
Top three noisy pixels from each quadrant. If the there are fewer than three noisy pixels in the level2.evt file, extra rows are filled as -1
| Pixel properties | Quadrant properties | ||||||
|---|---|---|---|---|---|---|---|
| Quadrant | DetID | PixID | Counts | Sigma | Mean | Median | Sigma |
| A | 14 | 238 | 1135508 | 2555.47 | 2207 | 2159 | 443.5 |
| A | 5 | 16 | 211817 | 472.74 | 2207 | 2159 | 443.5 |
| A | 0 | 226 | 18881 | 37.7 | 2207 | 2159 | 443.5 |
| B | 3 | 64 | 69016 | 159.25 | 2198 | 2138 | 420.0 |
| B | 7 | 220 | 58108 | 133.27 | 2198 | 2138 | 420.0 |
| B | 12 | 111 | 52812 | 120.66 | 2198 | 2138 | 420.0 |
| C | 14 | 238 | 329721 | 659.04 | 2120 | 2129 | 497.1 |
| C | 9 | 221 | 179414 | 356.66 | 2120 | 2129 | 497.1 |
| C | 7 | 220 | 17841 | 31.61 | 2120 | 2129 | 497.1 |
| D | 1 | 20 | 1347626 | 2561.57 | 2145 | 2083 | 525.3 |
| D | 7 | 238 | 337818 | 639.15 | 2145 | 2083 | 525.3 |
| D | 1 | 52 | 246303 | 464.93 | 2145 | 2083 | 525.3 |
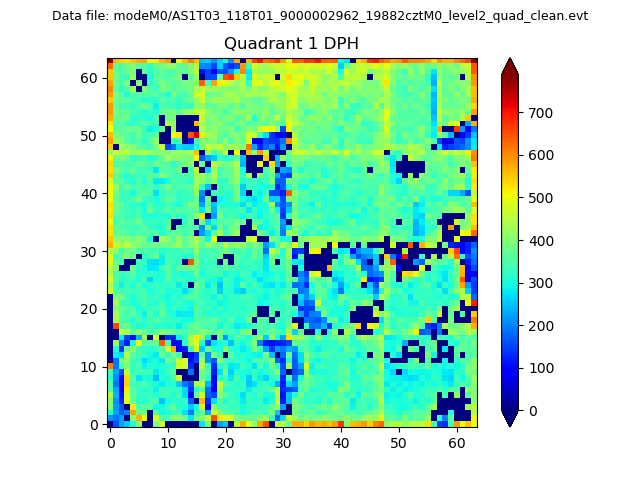
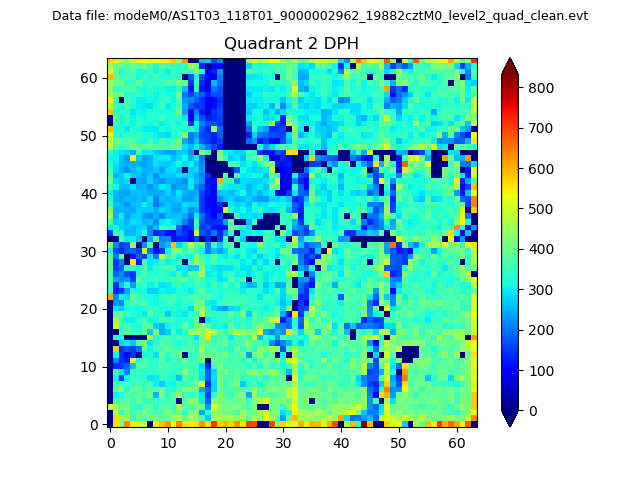
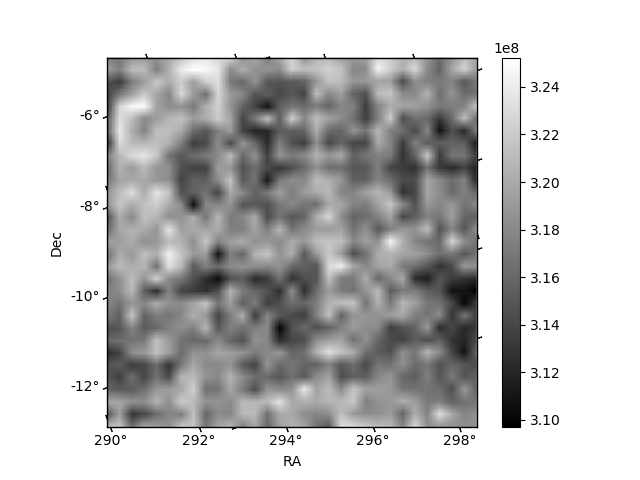
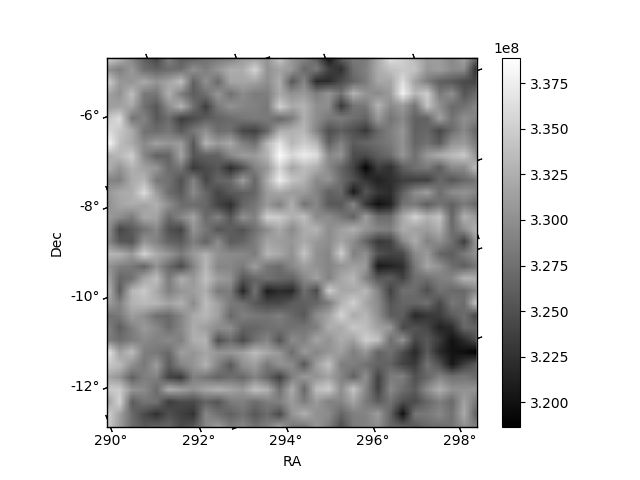
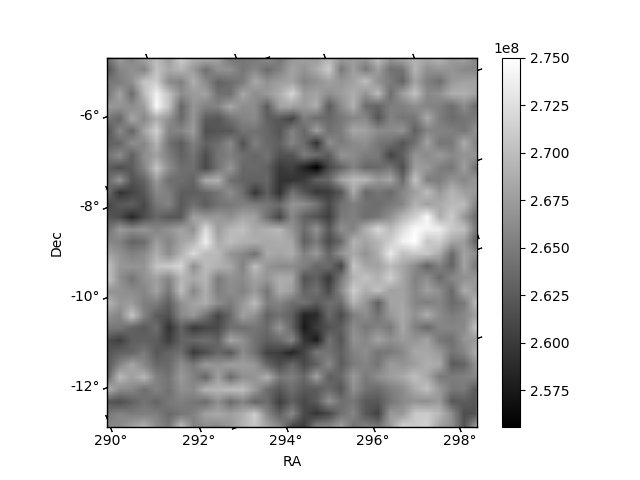
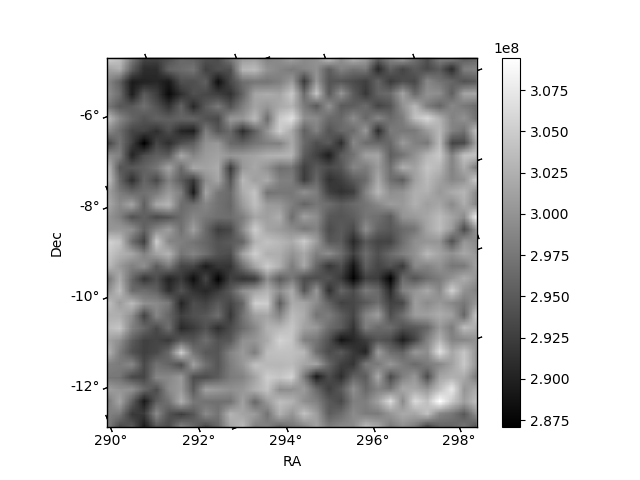
Histogram calculated using DETX and DETY for each event in the final _common_clean file
| Quadrant A | 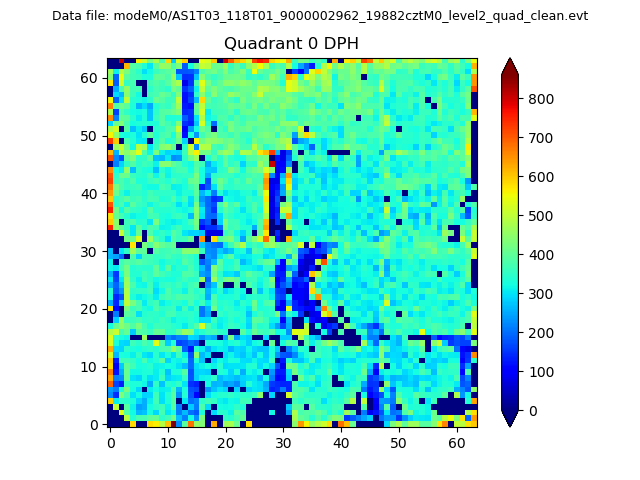 |
 |
Quadrant B |
|---|---|---|---|
| Quadrant D | 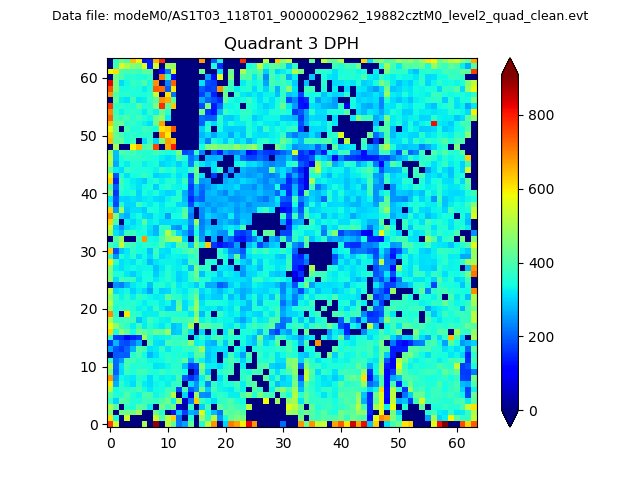 |
 |
Quadrant C |
| Plot type | Count rate plots | Images |
|---|---|---|
| Comparison with Poisson distribution Blue bars denote a histogram of data divided into 1 sec bins. Red curve is a Poisson curve with rate = median count rate of data. |
 |
 |
| Quadrant-wise count rates Data is divided into 100 sec bins |
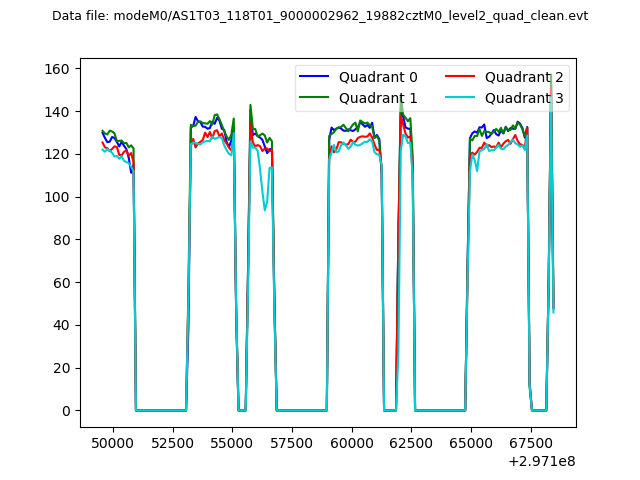 |
|
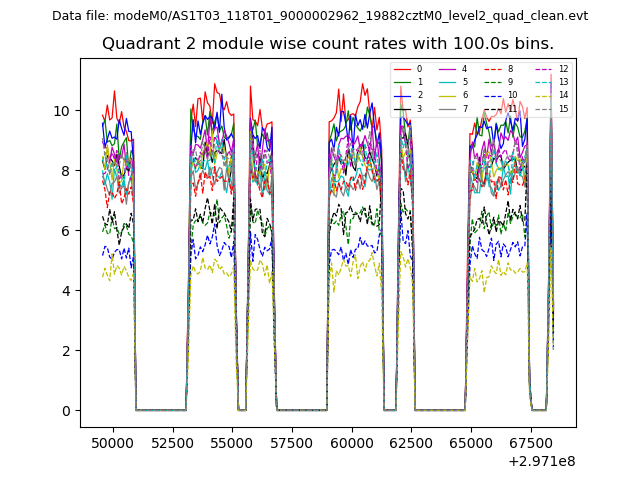
| Module-wise count rates for Quadrant A Data is divided into 100 sec bins |
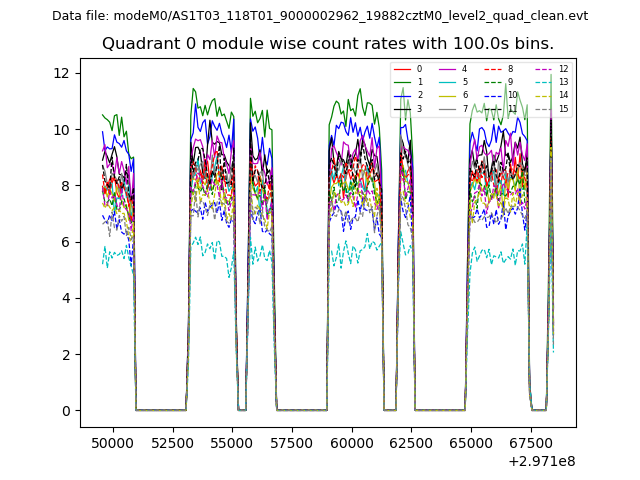 |
 |
| Module-wise count rates for Quadrant B Data is divided into 100 sec bins |
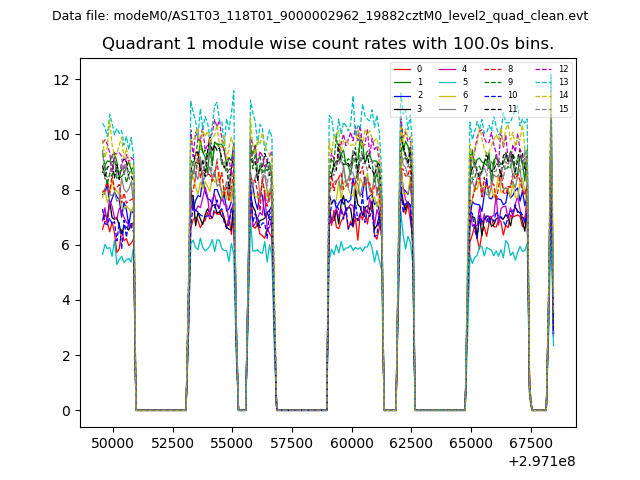 |
 |
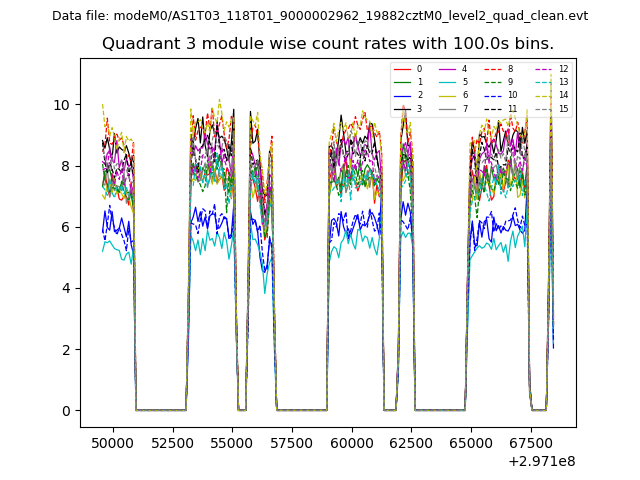
| Module-wise count rates for Quadrant C Data is divided into 100 sec bins |
 |
 |
| Module-wise count rates for Quadrant D Data is divided into 100 sec bins |
 |
 |
| Parameter | Plot |
|---|---|
| CZT HV Monitor | 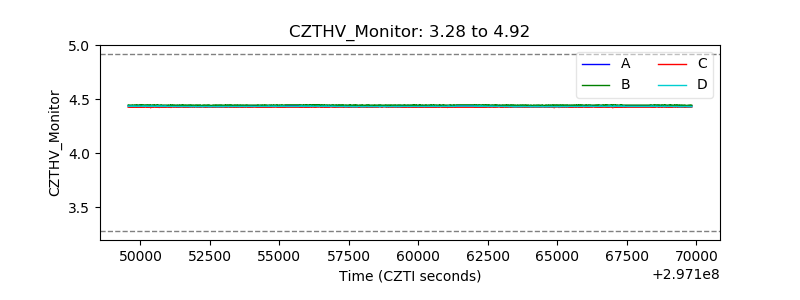 |
| D_VDD | 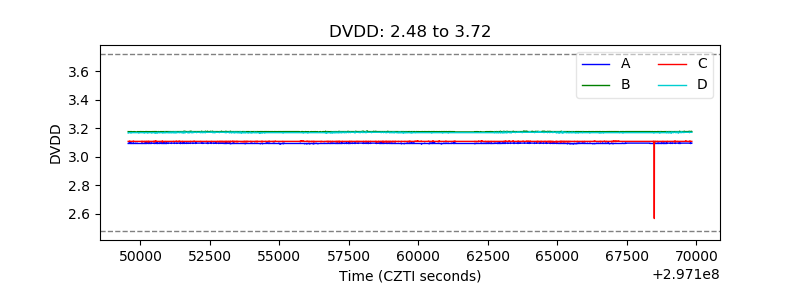 |
| Temperature 1 | 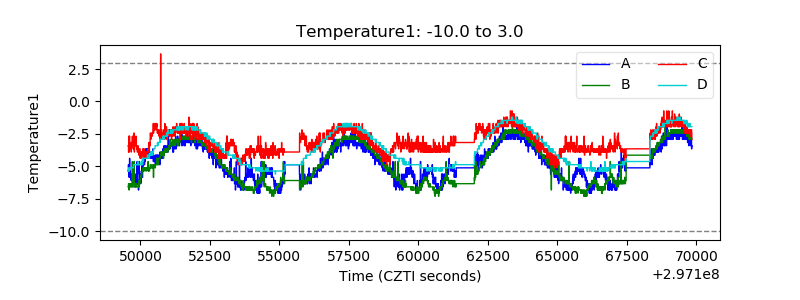 |
| Veto HV Monitor | 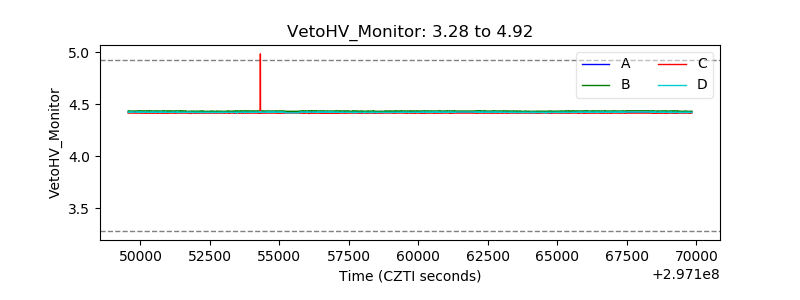 |
| Veto LLD | 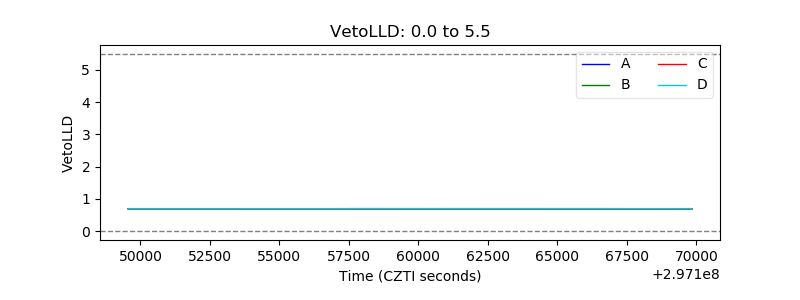 |
| Alpha Counter | 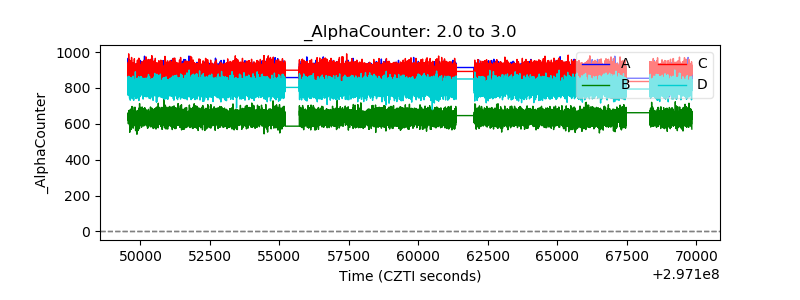 |
| _CPM_Rate | 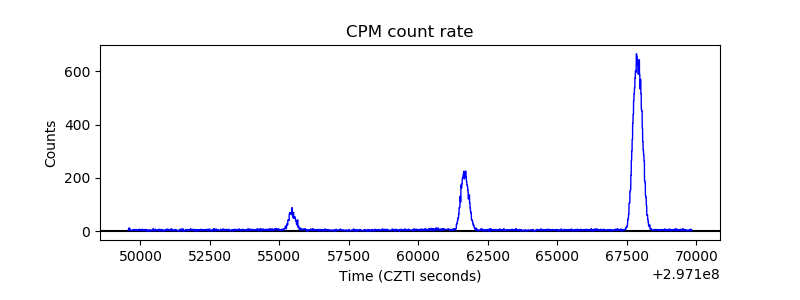 |
| CZT Counter | 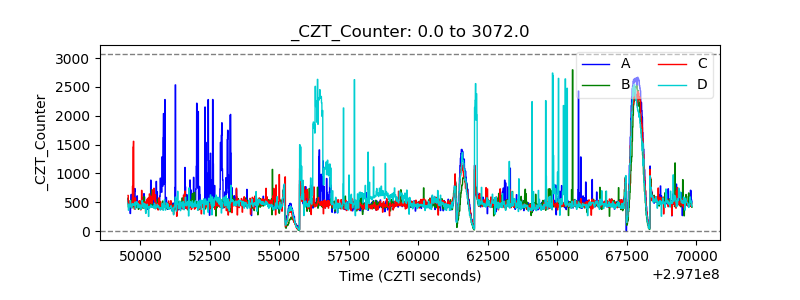 |
| +2.5 Volts monitor |  |
| +5 Volts monitor | 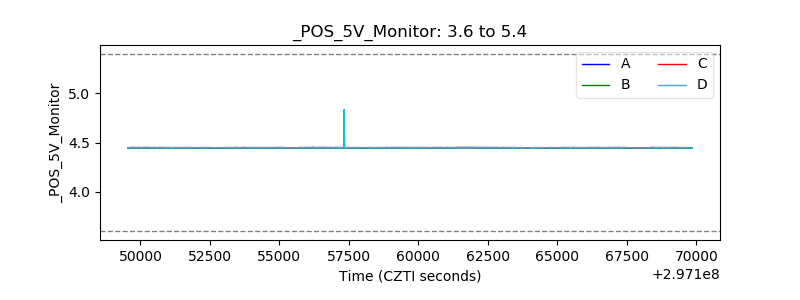 |
| _ROLL_ROT |  |
| _Roll_DEC | 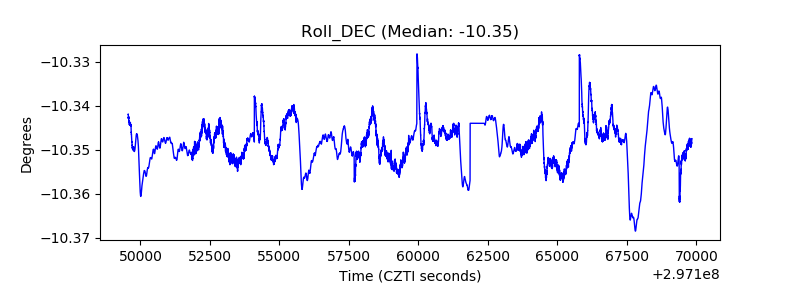 |
| _Roll_RA | 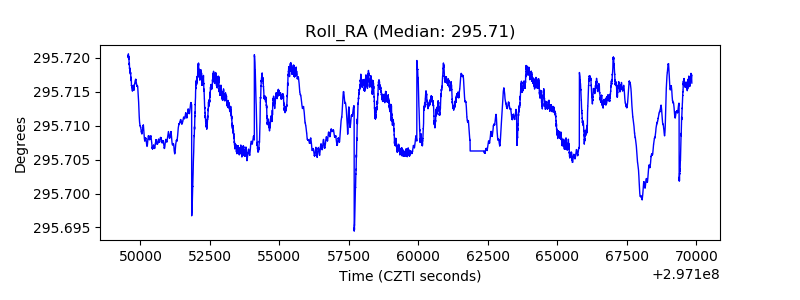 |
| Veto Counter | 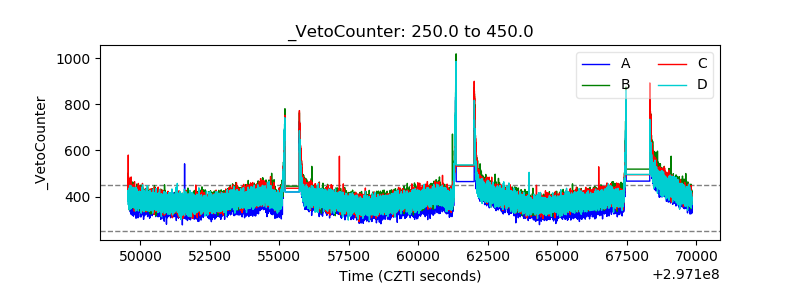 |