| Param | Original file | Final file |
|---|---|---|
| Filename | modeM0/AS1T03_118T01_9000002962_19883cztM0_level2.evt | modeM0/AS1T03_118T01_9000002962_19883cztM0_level2_quad_clean.evt |
| Size (bytes) | 469,615,680 | 67,265,280 |
| Size | 447.9 MB | 64.1 MB |
| Events in quadrant A | 3,346,455 | 404,155 |
| Events in quadrant B | 3,557,321 | 403,505 |
| Events in quadrant C | 3,317,054 | 383,787 |
| Events in quadrant D | 3,546,639 | 378,279 |
| Mode SS | |||
|---|---|---|---|
| Quadrant | BADHDUFLAG | Total packets | Discarded packets |
| A | 0 | 136 | 0 |
| B | 0 | 136 | 0 |
| C | 0 | 136 | 0 |
| D | 0 | 136 | 0 |
| Mode M9 | |||
|---|---|---|---|
| Quadrant | BADHDUFLAG | Total packets | Discarded packets |
| A | 0 | 10 | 0 |
| B | 0 | 11 | 0 |
| C | 0 | 11 | 0 |
| D | 0 | 11 | 0 |
| Mode M0 | |||
|---|---|---|---|
| Quadrant | BADHDUFLAG | Total packets | Discarded packets |
| A | 0 | 14196 | 2 |
| B | 0 | 14722 | 2 |
| C | 0 | 13966 | 2 |
| D | 0 | 14885 | 2 |
| Quadrant | Total seconds | Saturated seconds | Saturation percentage |
|---|---|---|---|
| A | 6698 | 60 | 0.895790% |
| B | 6698 | 135 | 2.015527% |
| C | 6697 | 90 | 1.343885% |
| D | 6697 | 91 | 1.358817% |
Noise dominated data is calculated using 1-second bins in cleaned event files. If a bin has >2000 counts, and if more than 50% of those come from <1% of pixels, then it is considered to be noise-dominated and hence unusable.
| Quadrant | # 1 sec bins | Bins with >0 counts | Bins with >2000 counts | High rate bins dominated by noise | Noise dominated (total time) | Noise dominated (detector-on time) | Marked lightcurve |
|---|---|---|---|---|---|---|---|
| A | 7718 | 6698 | 0 | 0 | 0.00% | 0.00% | 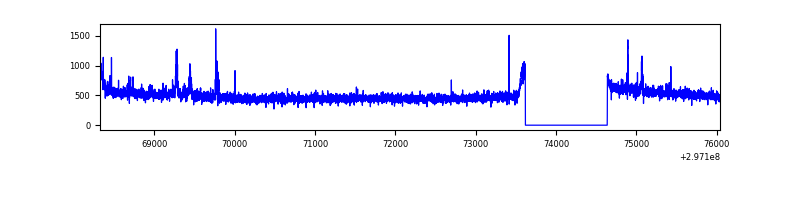 |
| B | 7718 | 6698 | 48 | 48 | 0.62% | 0.72% | 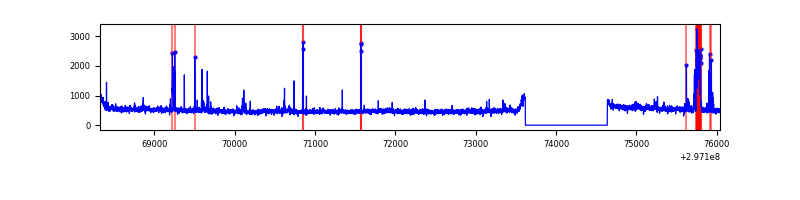 |
| C | 7717 | 6697 | 0 | 0 | 0.00% | 0.00% |  |
| D | 7717 | 6697 | 43 | 43 | 0.56% | 0.64% |  |
Top three noisy pixels from each quadrant. If the there are fewer than three noisy pixels in the level2.evt file, extra rows are filled as -1
| Pixel properties | Quadrant properties | ||||||
|---|---|---|---|---|---|---|---|
| Quadrant | DetID | PixID | Counts | Sigma | Mean | Median | Sigma |
| A | 14 | 238 | 65665 | 377.46 | 850 | 832 | 171.8 |
| A | 0 | 226 | 7261 | 37.43 | 850 | 832 | 171.8 |
| A | 3 | 137 | 6756 | 34.49 | 850 | 832 | 171.8 |
| B | 7 | 220 | 151609 | 934.01 | 840 | 820 | 161.4 |
| B | 3 | 64 | 59594 | 364.06 | 840 | 820 | 161.4 |
| B | 12 | 111 | 19127 | 113.4 | 840 | 820 | 161.4 |
| C | 14 | 238 | 126572 | 665.38 | 809 | 815 | 189.0 |
| C | 9 | 221 | 32930 | 169.92 | 809 | 815 | 189.0 |
| C | 13 | 61 | 5619 | 25.42 | 809 | 815 | 189.0 |
| D | 7 | 238 | 212406 | 1064.01 | 823 | 799 | 198.9 |
| D | 12 | 218 | 103986 | 518.85 | 823 | 799 | 198.9 |
| D | 1 | 52 | 52122 | 258.06 | 823 | 799 | 198.9 |
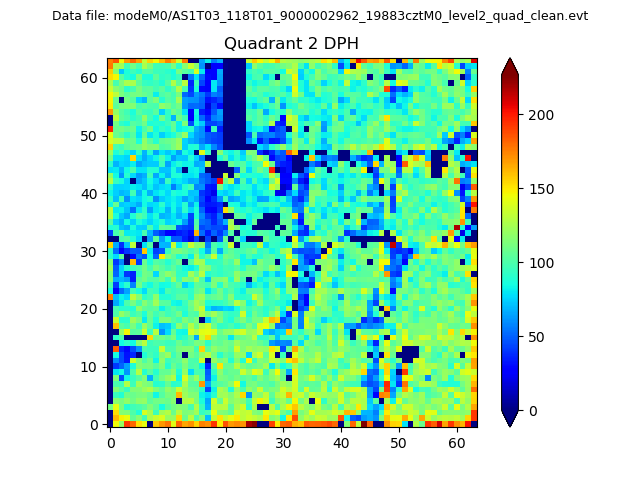
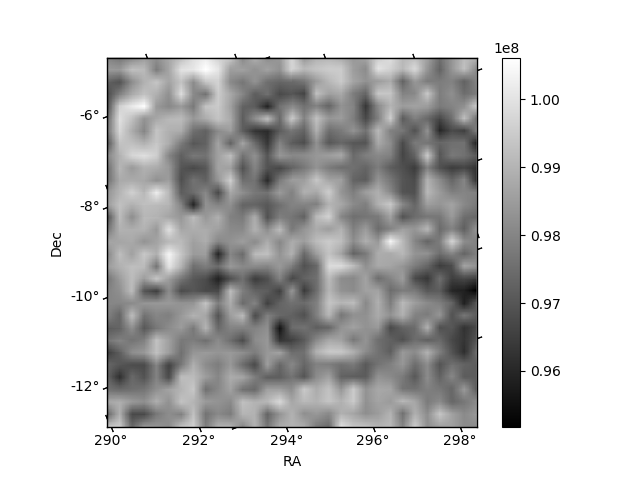
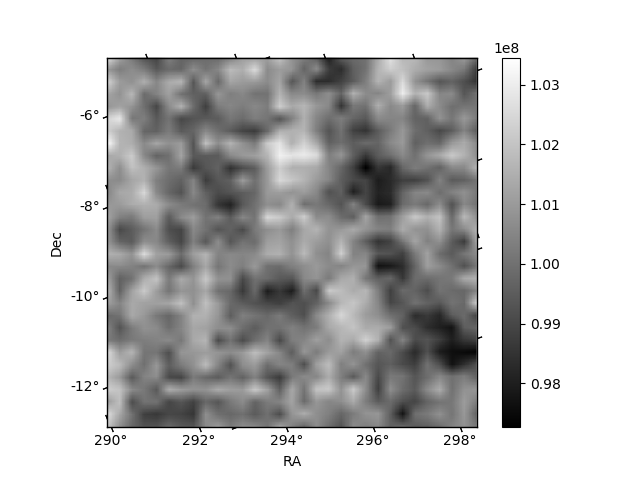
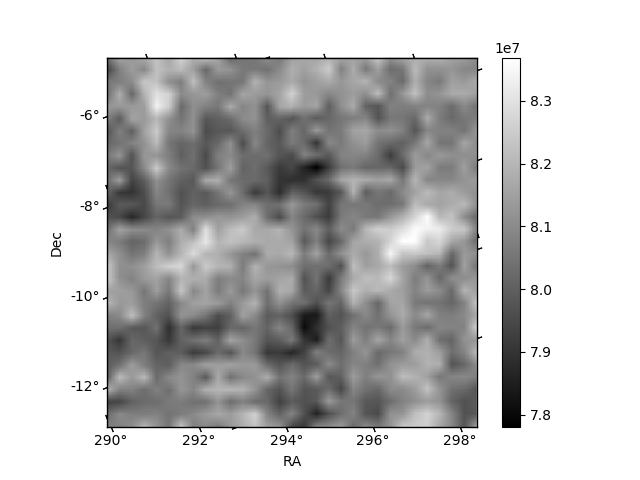
Histogram calculated using DETX and DETY for each event in the final _common_clean file
| Quadrant A | 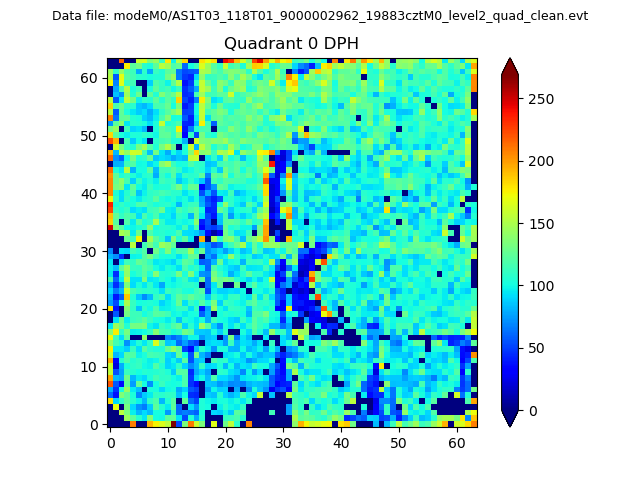 |
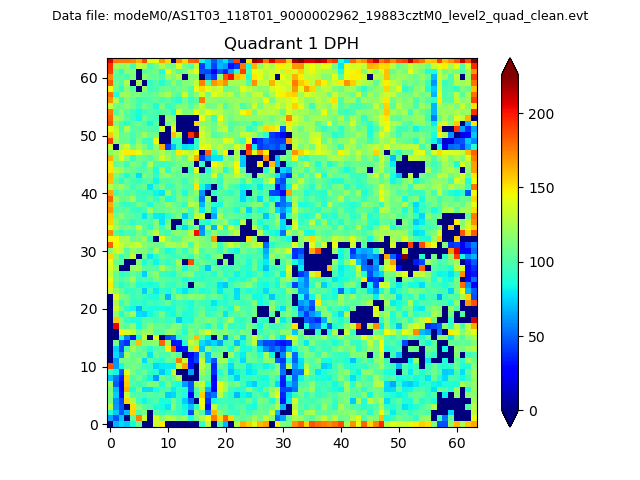 |
Quadrant B |
|---|---|---|---|
| Quadrant D | 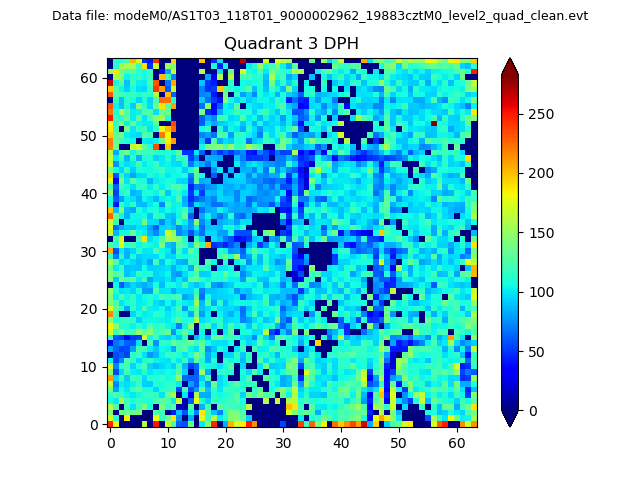 |
 |
Quadrant C |
| Plot type | Count rate plots | Images |
|---|---|---|
| Comparison with Poisson distribution Blue bars denote a histogram of data divided into 1 sec bins. Red curve is a Poisson curve with rate = median count rate of data. |
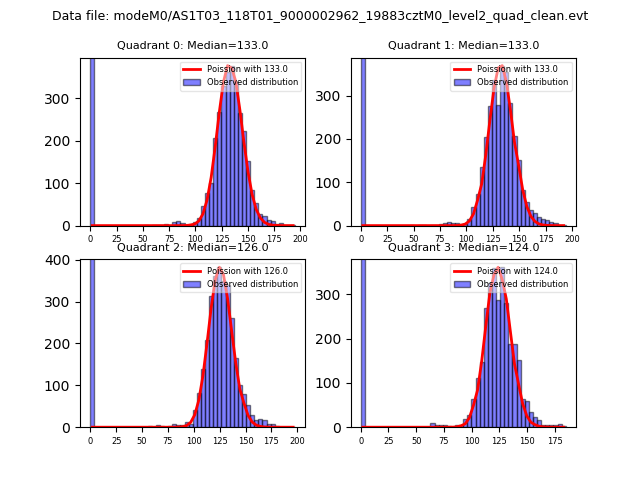 |
 |
| Quadrant-wise count rates Data is divided into 100 sec bins |
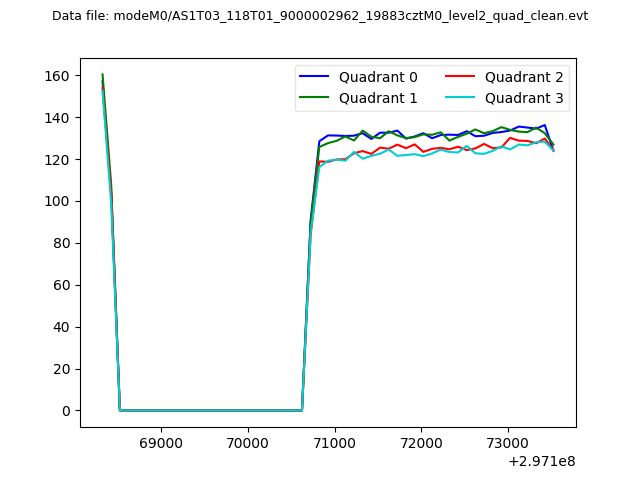 |
|
| Module-wise count rates for Quadrant A Data is divided into 100 sec bins |
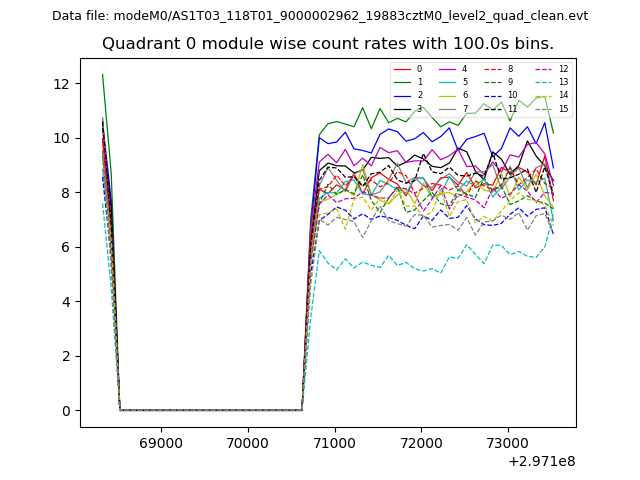 |
 |
| Module-wise count rates for Quadrant B Data is divided into 100 sec bins |
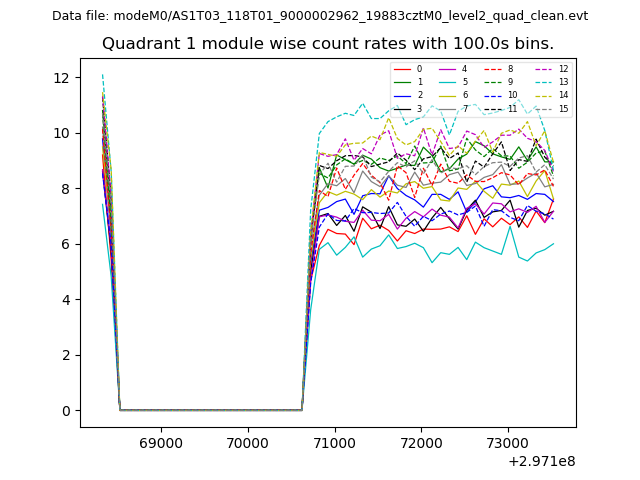 |
 |
| Module-wise count rates for Quadrant C Data is divided into 100 sec bins |
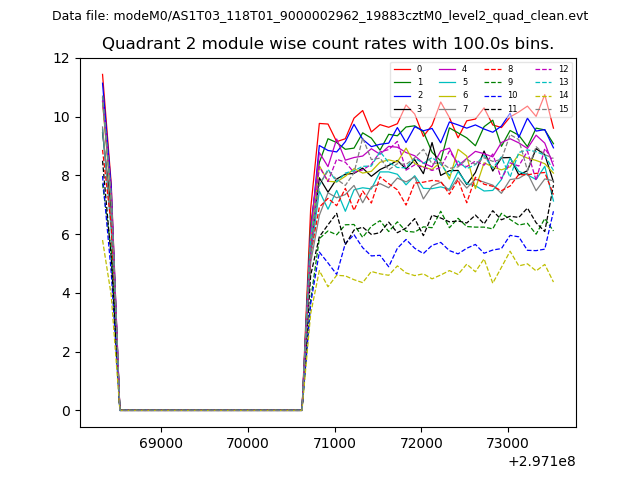 |
 |
| Module-wise count rates for Quadrant D Data is divided into 100 sec bins |
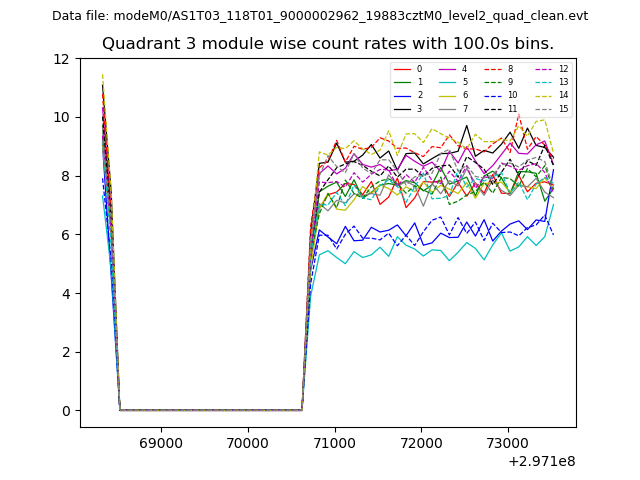 |
 |
| Parameter | Plot |
|---|---|
| CZT HV Monitor | 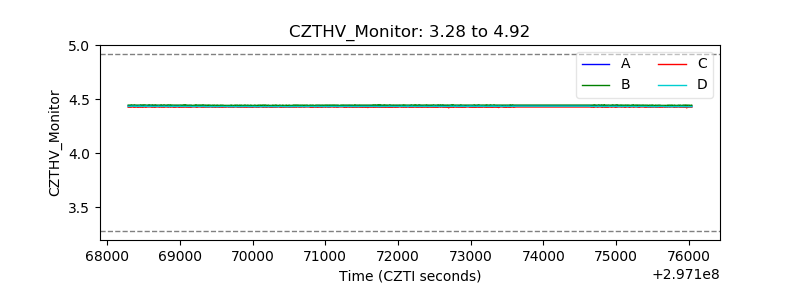 |
| D_VDD | 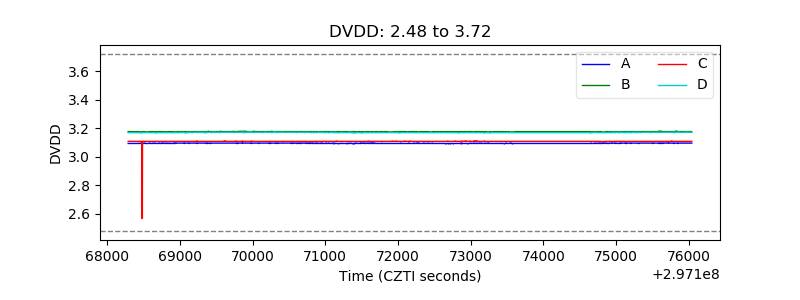 |
| Temperature 1 | 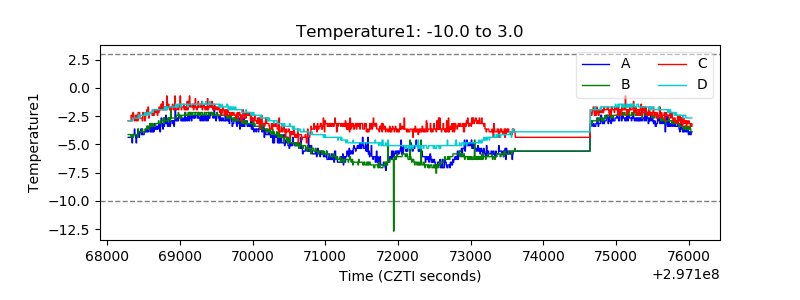 |
| Veto HV Monitor | 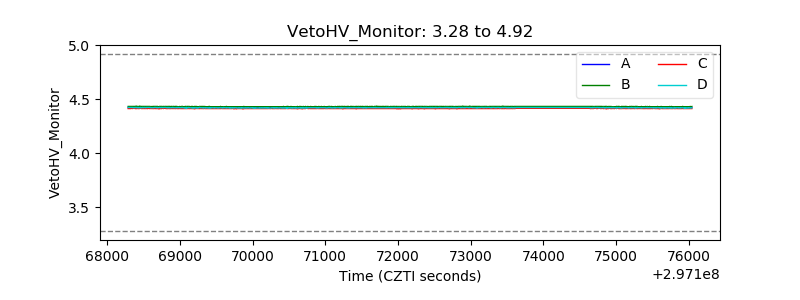 |
| Veto LLD | 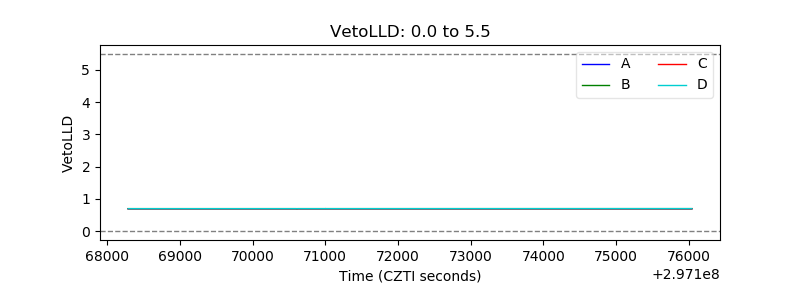 |
| Alpha Counter | 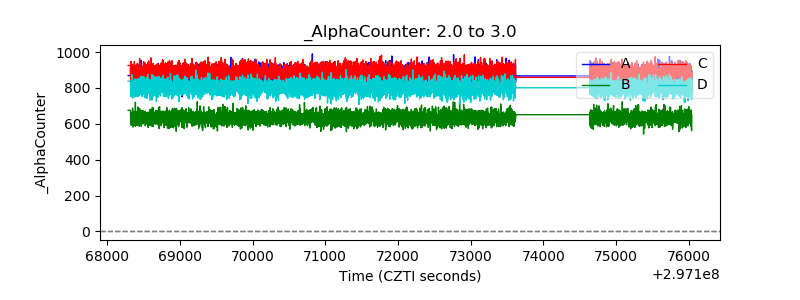 |
| _CPM_Rate | 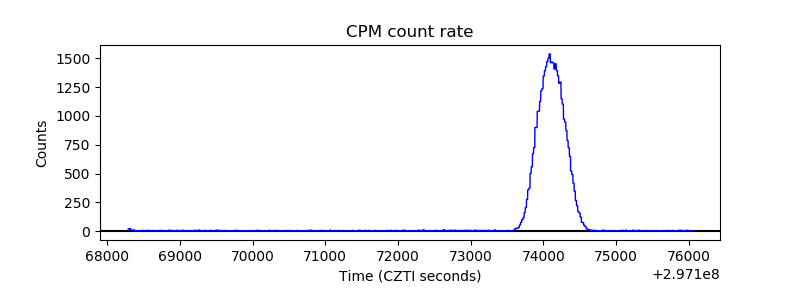 |
| CZT Counter | 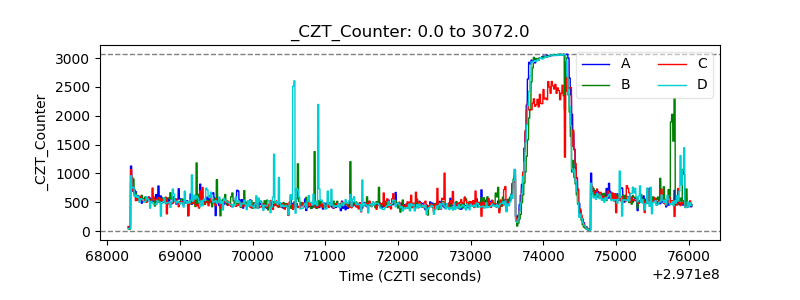 |
| +2.5 Volts monitor |  |
| +5 Volts monitor |  |
| _ROLL_ROT | 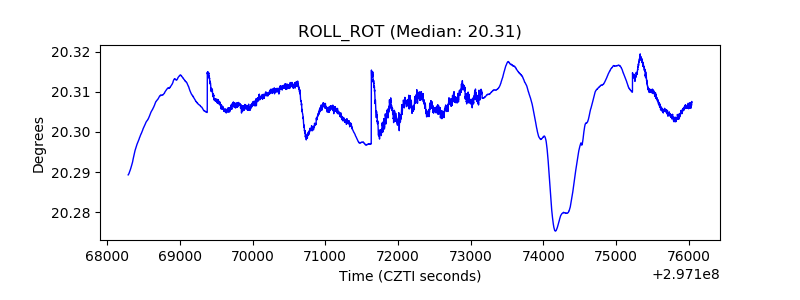 |
| _Roll_DEC | 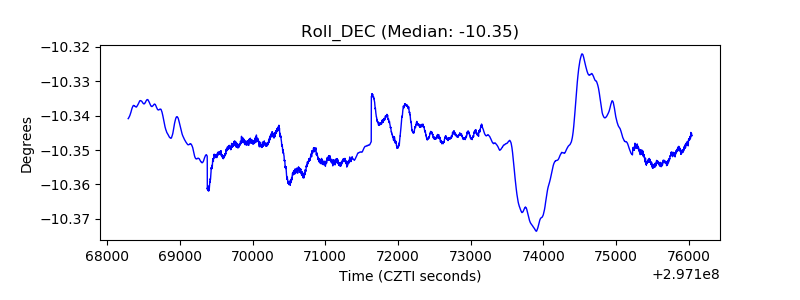 |
| _Roll_RA | 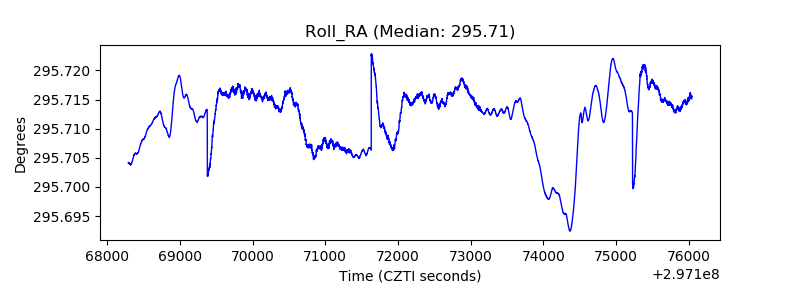 |
| Veto Counter | 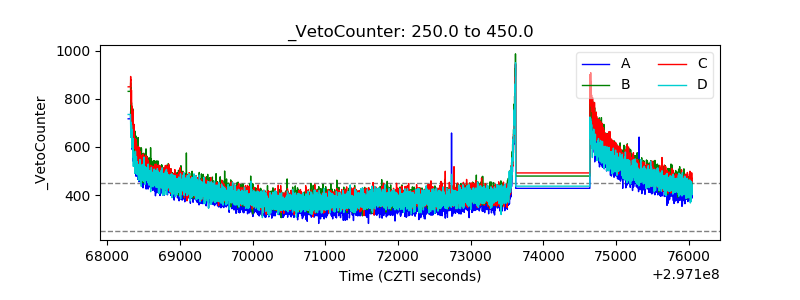 |