| Param | Original file | Final file |
|---|---|---|
| Filename | modeM0/AS1T03_118T01_9000002962_19886cztM0_level2.evt | modeM0/AS1T03_118T01_9000002962_19886cztM0_level2_quad_clean.evt |
| Size (bytes) | 471,525,120 | 83,090,880 |
| Size | 449.7 MB | 79.2 MB |
| Events in quadrant A | 3,368,489 | 534,923 |
| Events in quadrant B | 3,514,652 | 537,180 |
| Events in quadrant C | 3,439,754 | 503,028 |
| Events in quadrant D | 3,526,504 | 498,210 |
| Mode SS | |||
|---|---|---|---|
| Quadrant | BADHDUFLAG | Total packets | Discarded packets |
| A | 0 | 130 | 0 |
| B | 0 | 130 | 0 |
| C | 0 | 130 | 0 |
| D | 0 | 130 | 0 |
| Mode M9 | |||
|---|---|---|---|
| Quadrant | BADHDUFLAG | Total packets | Discarded packets |
| A | 0 | 13 | 0 |
| B | 0 | 14 | 0 |
| C | 0 | 14 | 0 |
| D | 0 | 14 | 0 |
| Mode M0 | |||
|---|---|---|---|
| Quadrant | BADHDUFLAG | Total packets | Discarded packets |
| A | 0 | 14030 | 2 |
| B | 0 | 14467 | 2 |
| C | 0 | 14190 | 2 |
| D | 0 | 14680 | 2 |
| Quadrant | Total seconds | Saturated seconds | Saturation percentage |
|---|---|---|---|
| A | 6342 | 54 | 0.851466% |
| B | 6342 | 95 | 1.497950% |
| C | 6342 | 100 | 1.576790% |
| D | 6342 | 60 | 0.946074% |
Noise dominated data is calculated using 1-second bins in cleaned event files. If a bin has >2000 counts, and if more than 50% of those come from <1% of pixels, then it is considered to be noise-dominated and hence unusable.
| Quadrant | # 1 sec bins | Bins with >0 counts | Bins with >2000 counts | High rate bins dominated by noise | Noise dominated (total time) | Noise dominated (detector-on time) | Marked lightcurve |
|---|---|---|---|---|---|---|---|
| A | 7587 | 6342 | 6 | 6 | 0.08% | 0.09% | 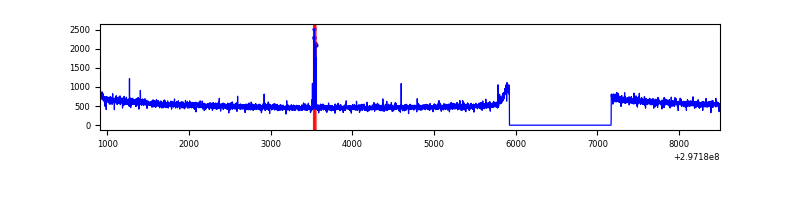 |
| B | 7587 | 6342 | 7 | 7 | 0.09% | 0.11% | 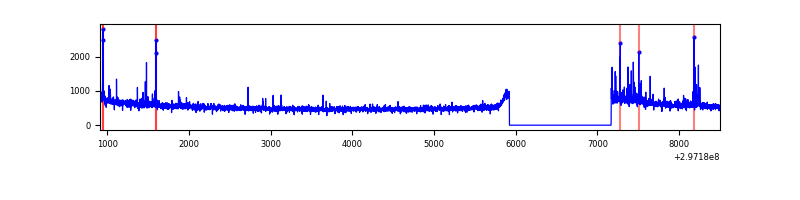 |
| C | 7587 | 6342 | 0 | 0 | 0.00% | 0.00% | 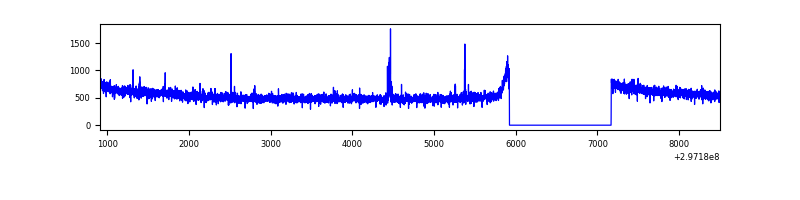 |
| D | 7587 | 6342 | 13 | 13 | 0.17% | 0.20% | 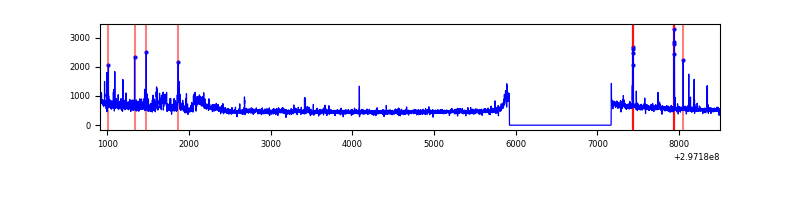 |
Top three noisy pixels from each quadrant. If the there are fewer than three noisy pixels in the level2.evt file, extra rows are filled as -1
| Pixel properties | Quadrant properties | ||||||
|---|---|---|---|---|---|---|---|
| Quadrant | DetID | PixID | Counts | Sigma | Mean | Median | Sigma |
| A | 9 | 143 | 33253 | 187.64 | 866 | 851 | 172.7 |
| A | 0 | 226 | 7377 | 37.79 | 866 | 851 | 172.7 |
| A | 3 | 137 | 6588 | 33.22 | 866 | 851 | 172.7 |
| B | 7 | 220 | 51335 | 312.12 | 864 | 846 | 161.8 |
| B | 0 | 197 | 24385 | 145.51 | 864 | 846 | 161.8 |
| B | 12 | 111 | 18593 | 109.71 | 864 | 846 | 161.8 |
| C | 14 | 238 | 133632 | 686.52 | 834 | 842 | 193.4 |
| C | 9 | 221 | 49244 | 250.24 | 834 | 842 | 193.4 |
| C | 7 | 220 | 7425 | 34.03 | 834 | 842 | 193.4 |
| D | 12 | 218 | 158642 | 779.55 | 842 | 820 | 202.5 |
| D | 1 | 52 | 94927 | 464.83 | 842 | 820 | 202.5 |
| D | 5 | 222 | 34445 | 166.09 | 842 | 820 | 202.5 |
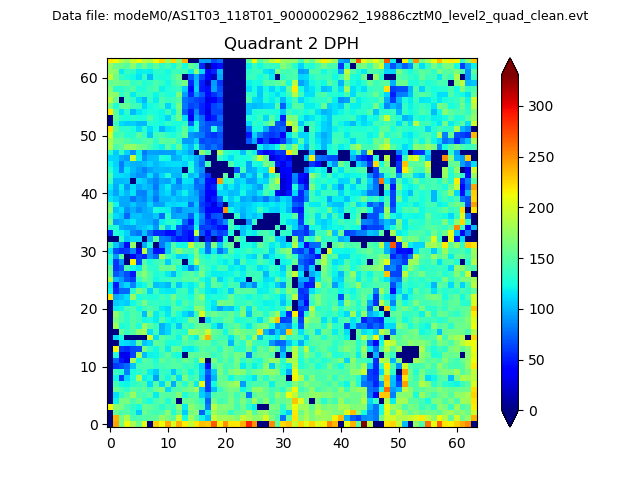
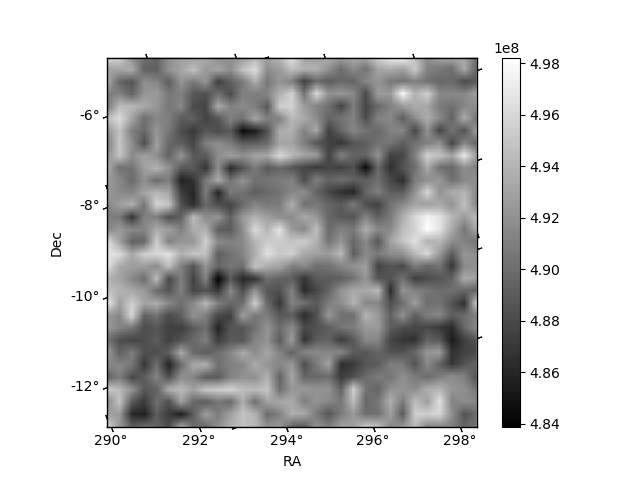
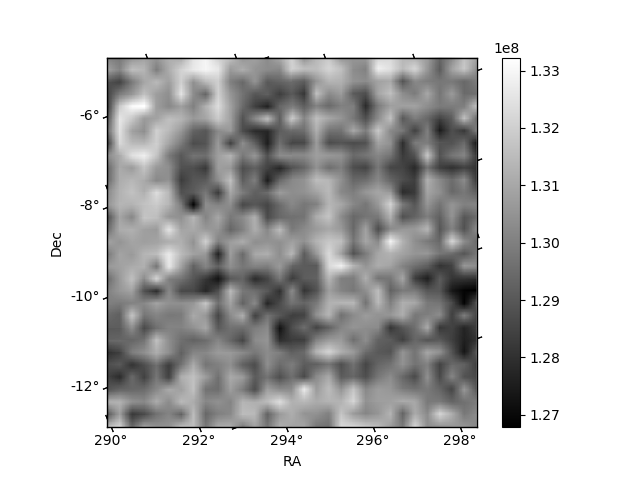
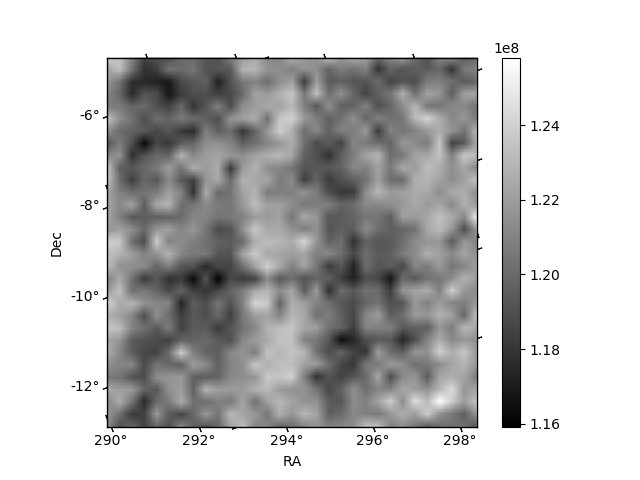
Histogram calculated using DETX and DETY for each event in the final _common_clean file
| Quadrant A | 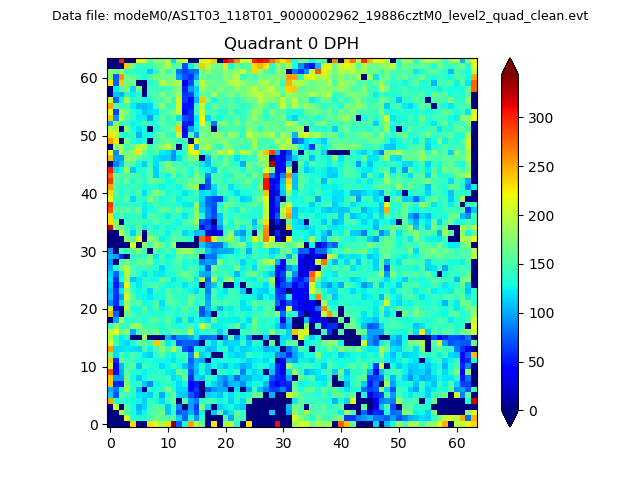 |
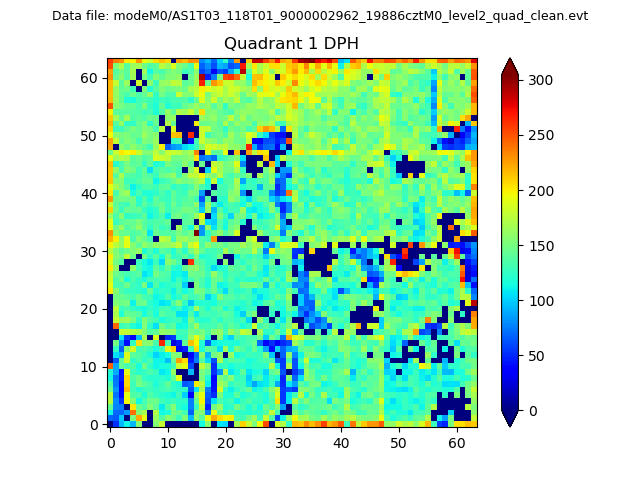 |
Quadrant B |
|---|---|---|---|
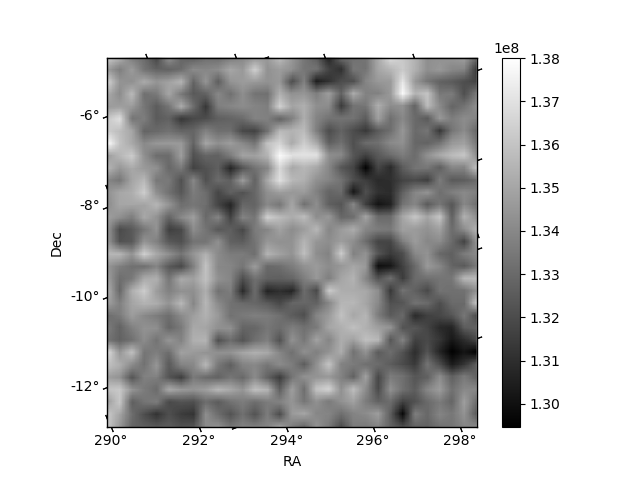
| Quadrant D | 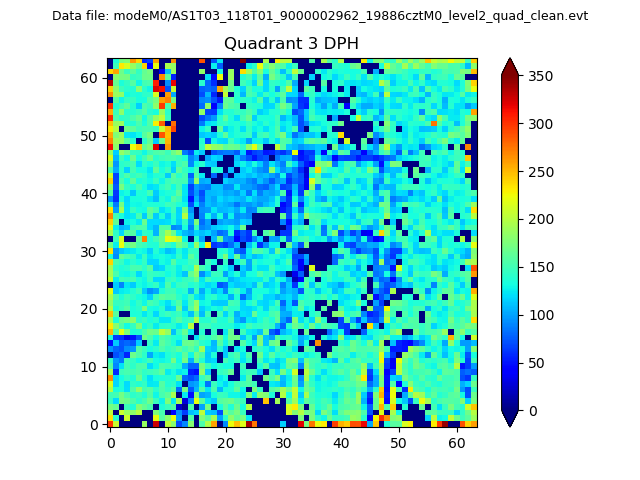 |
 |
Quadrant C |
| Plot type | Count rate plots | Images |
|---|---|---|
| Comparison with Poisson distribution Blue bars denote a histogram of data divided into 1 sec bins. Red curve is a Poisson curve with rate = median count rate of data. |
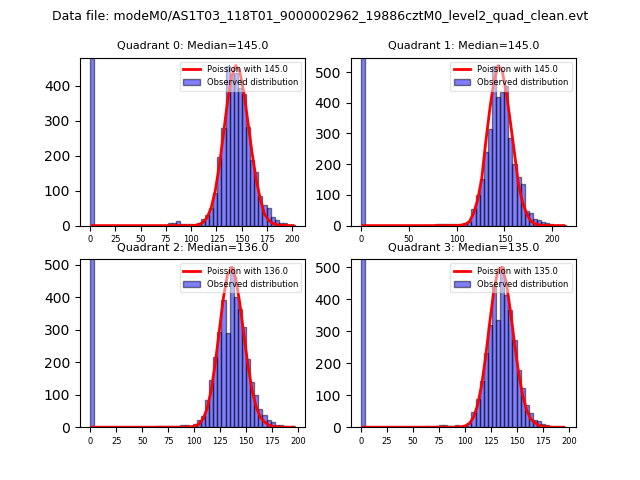 |
 |
| Quadrant-wise count rates Data is divided into 100 sec bins |
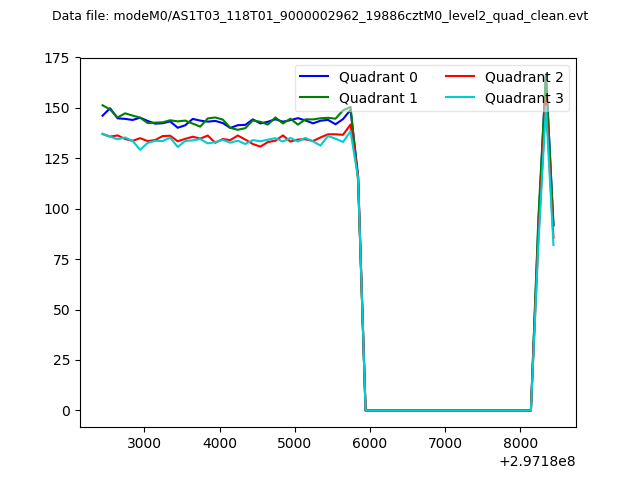 |
|
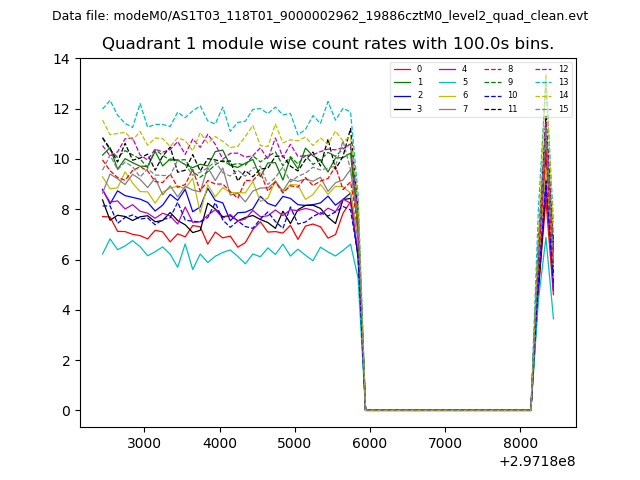
| Module-wise count rates for Quadrant A Data is divided into 100 sec bins |
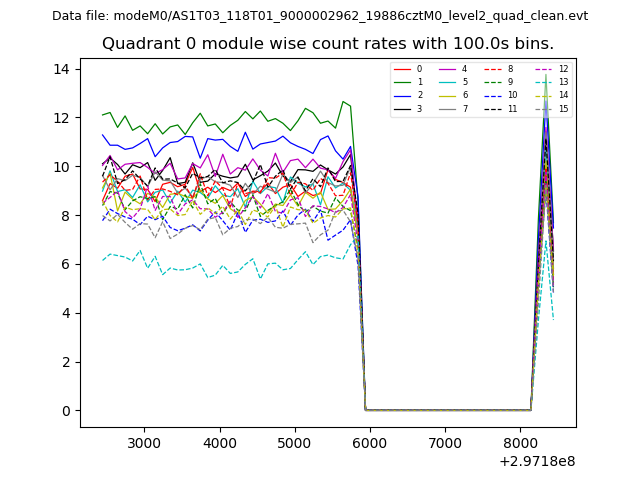 |
 |
| Module-wise count rates for Quadrant B Data is divided into 100 sec bins |
 |
 |
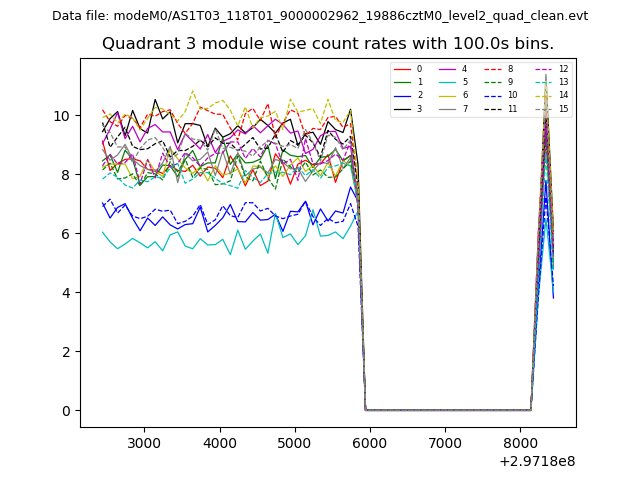
| Module-wise count rates for Quadrant C Data is divided into 100 sec bins |
 |
 |
| Module-wise count rates for Quadrant D Data is divided into 100 sec bins |
 |
 |
| Parameter | Plot |
|---|---|
| CZT HV Monitor | 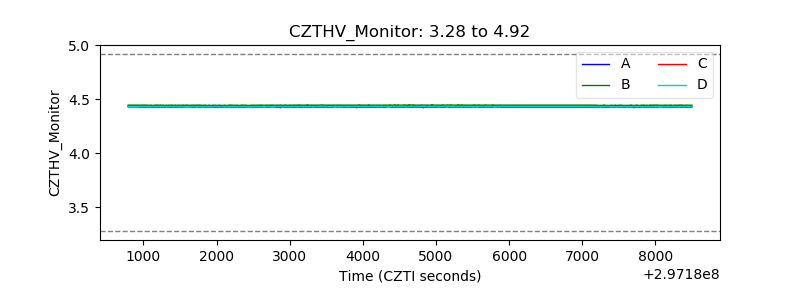 |
| D_VDD | 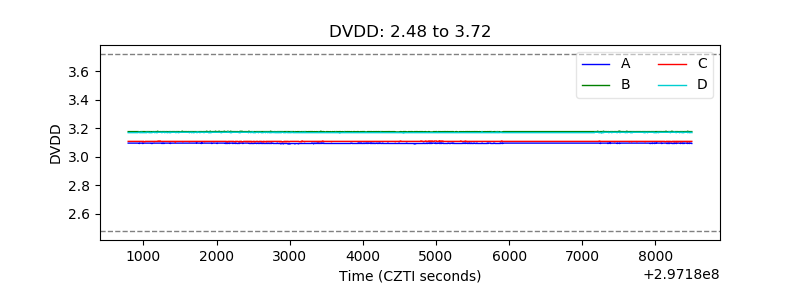 |
| Temperature 1 | 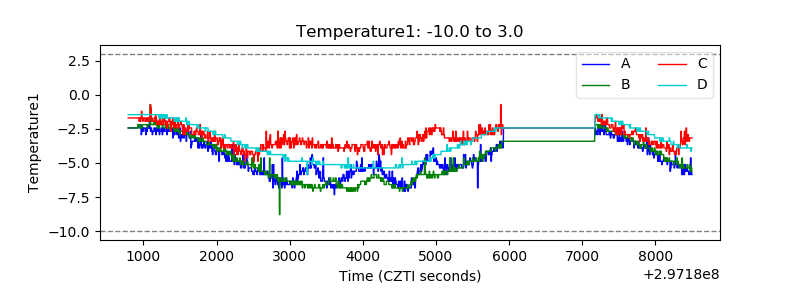 |
| Veto HV Monitor | 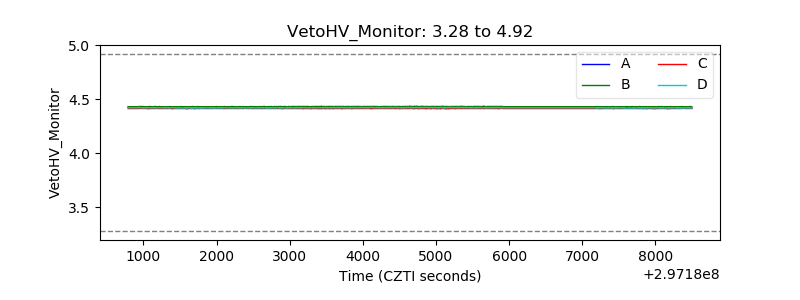 |
| Veto LLD | 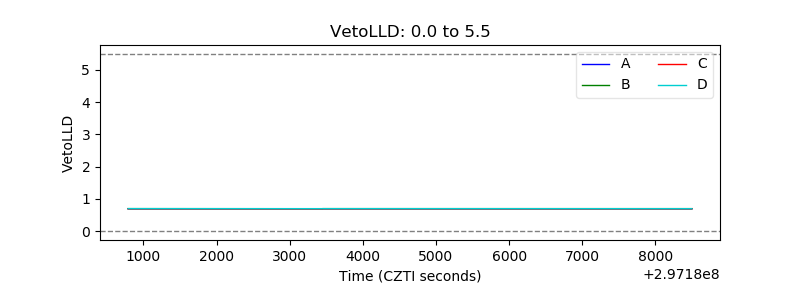 |
| Alpha Counter | 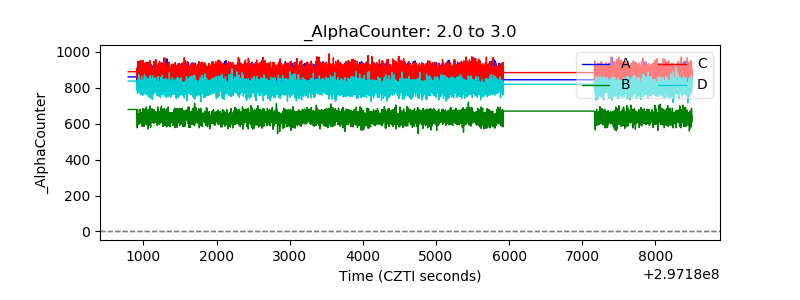 |
| _CPM_Rate | 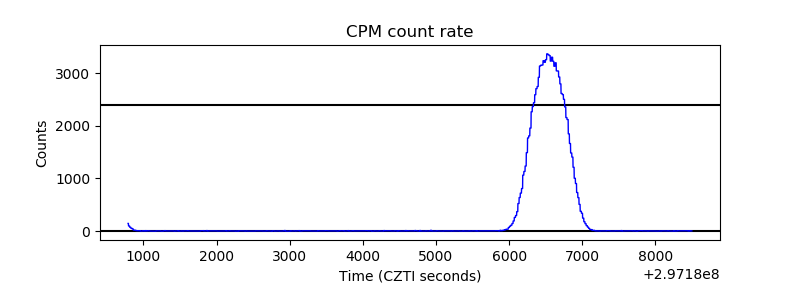 |
| CZT Counter | 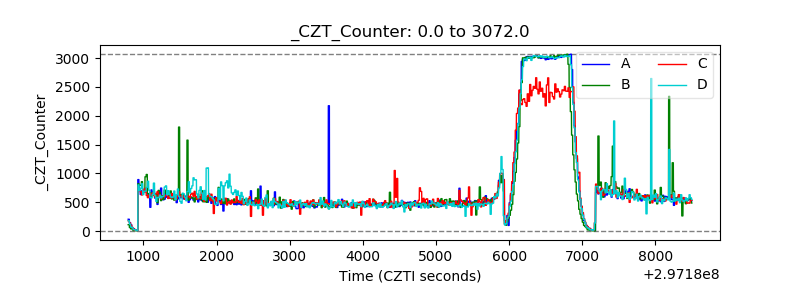 |
| +2.5 Volts monitor |  |
| +5 Volts monitor |  |
| _ROLL_ROT | 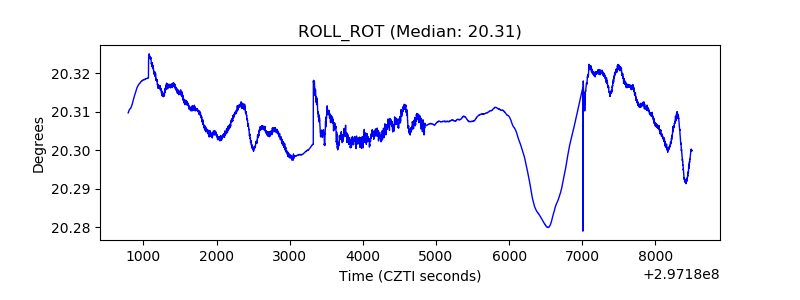 |
| _Roll_DEC | 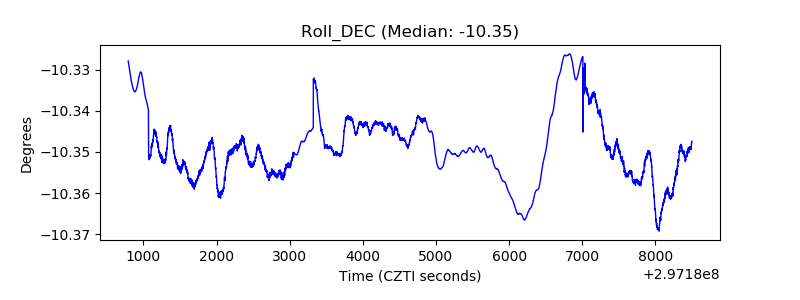 |
| _Roll_RA | 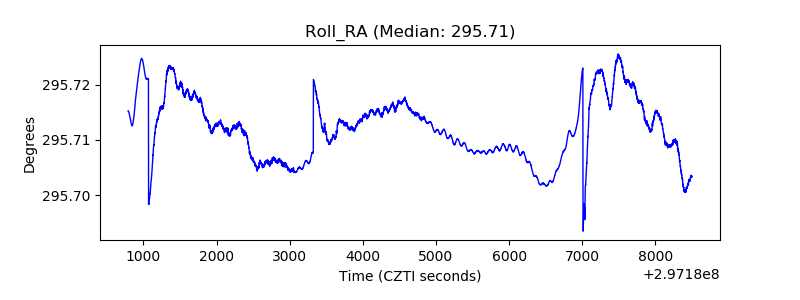 |
| Veto Counter | 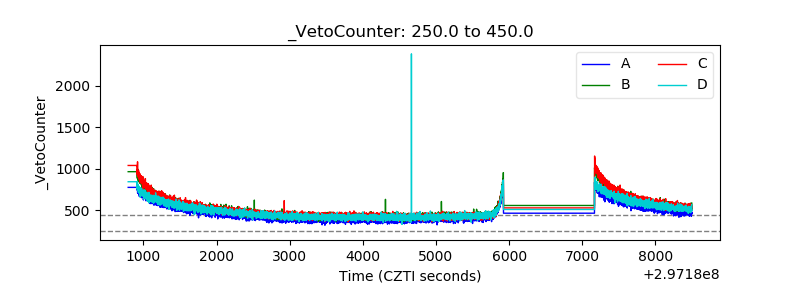 |