| Param | Original file | Final file |
|---|---|---|
| Filename | modeM0/AS1T03_118T01_9000002962_19887cztM0_level2.evt | modeM0/AS1T03_118T01_9000002962_19887cztM0_level2_quad_clean.evt |
| Size (bytes) | 451,149,120 | 92,862,720 |
| Size | 430.2 MB | 88.6 MB |
| Events in quadrant A | 3,249,995 | 617,223 |
| Events in quadrant B | 3,449,798 | 623,902 |
| Events in quadrant C | 3,335,379 | 579,690 |
| Events in quadrant D | 3,216,830 | 568,588 |
| Mode SS | |||
|---|---|---|---|
| Quadrant | BADHDUFLAG | Total packets | Discarded packets |
| A | 0 | 124 | 0 |
| B | 0 | 124 | 0 |
| C | 0 | 124 | 0 |
| D | 0 | 124 | 0 |
| Mode M9 | |||
|---|---|---|---|
| Quadrant | BADHDUFLAG | Total packets | Discarded packets |
| A | 0 | 25 | 0 |
| B | 0 | 26 | 0 |
| C | 0 | 26 | 0 |
| D | 0 | 26 | 0 |
| Mode M0 | |||
|---|---|---|---|
| Quadrant | BADHDUFLAG | Total packets | Discarded packets |
| A | 0 | 13400 | 2 |
| B | 0 | 14089 | 2 |
| C | 0 | 13745 | 2 |
| D | 0 | 13423 | 2 |
| Quadrant | Total seconds | Saturated seconds | Saturation percentage |
|---|---|---|---|
| A | 6059 | 29 | 0.478627% |
| B | 6059 | 82 | 1.353359% |
| C | 6059 | 67 | 1.105793% |
| D | 6059 | 29 | 0.478627% |
Noise dominated data is calculated using 1-second bins in cleaned event files. If a bin has >2000 counts, and if more than 50% of those come from <1% of pixels, then it is considered to be noise-dominated and hence unusable.
| Quadrant | # 1 sec bins | Bins with >0 counts | Bins with >2000 counts | High rate bins dominated by noise | Noise dominated (total time) | Noise dominated (detector-on time) | Marked lightcurve |
|---|---|---|---|---|---|---|---|
| A | 7399 | 6060 | 0 | 0 | 0.00% | 0.00% | 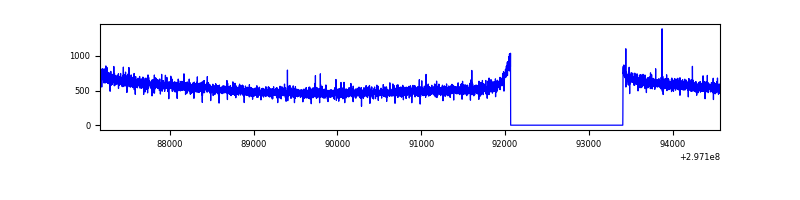 |
| B | 7399 | 6060 | 6 | 6 | 0.08% | 0.10% | 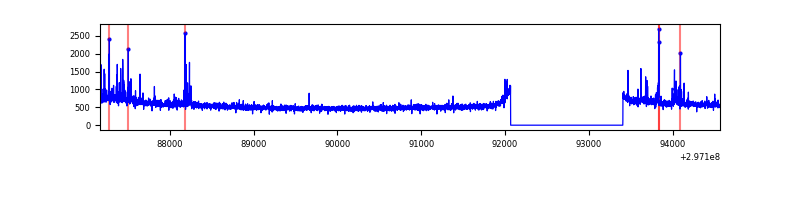 |
| C | 7399 | 6060 | 0 | 0 | 0.00% | 0.00% | 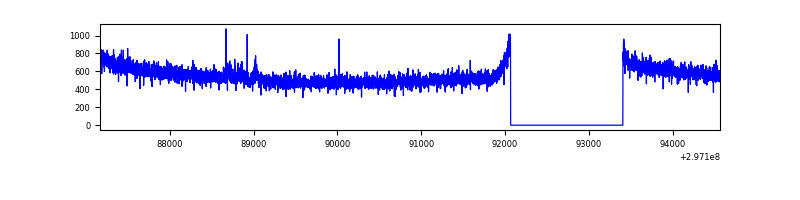 |
| D | 7399 | 6060 | 13 | 13 | 0.18% | 0.21% | 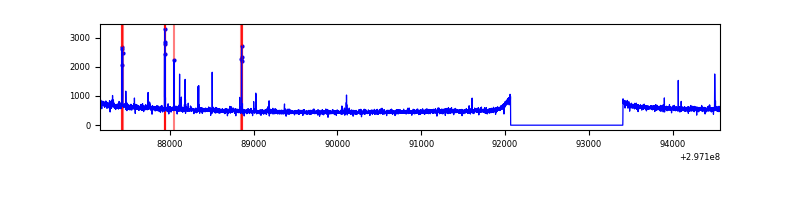 |
Top three noisy pixels from each quadrant. If the there are fewer than three noisy pixels in the level2.evt file, extra rows are filled as -1
| Pixel properties | Quadrant properties | ||||||
|---|---|---|---|---|---|---|---|
| Quadrant | DetID | PixID | Counts | Sigma | Mean | Median | Sigma |
| A | 0 | 226 | 7237 | 37.94 | 844 | 831 | 168.9 |
| A | 3 | 137 | 6380 | 32.86 | 844 | 831 | 168.9 |
| A | 12 | 194 | 6022 | 30.74 | 844 | 831 | 168.9 |
| B | 0 | 197 | 49248 | 308.77 | 844 | 827 | 156.8 |
| B | 7 | 220 | 48574 | 304.48 | 844 | 827 | 156.8 |
| B | 4 | 216 | 18026 | 109.68 | 844 | 827 | 156.8 |
| C | 14 | 238 | 131207 | 688.41 | 814 | 826 | 189.4 |
| C | 9 | 221 | 26574 | 135.95 | 814 | 826 | 189.4 |
| C | 13 | 61 | 5598 | 25.2 | 814 | 826 | 189.4 |
| D | 1 | 52 | 51991 | 260.13 | 821 | 800 | 196.8 |
| D | 5 | 222 | 24951 | 122.72 | 821 | 800 | 196.8 |
| D | 2 | 234 | 23639 | 116.06 | 821 | 800 | 196.8 |
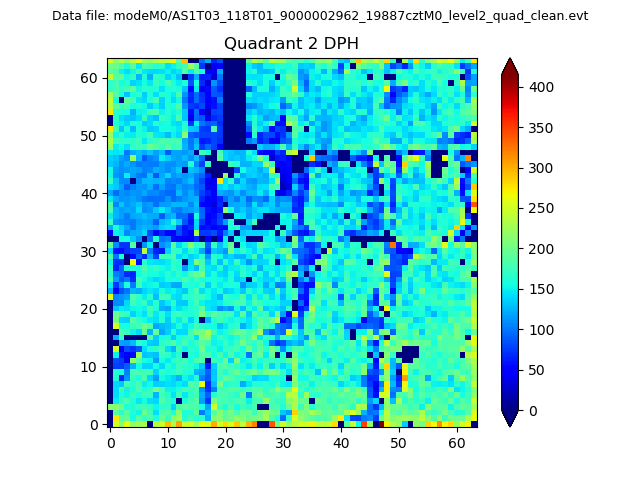
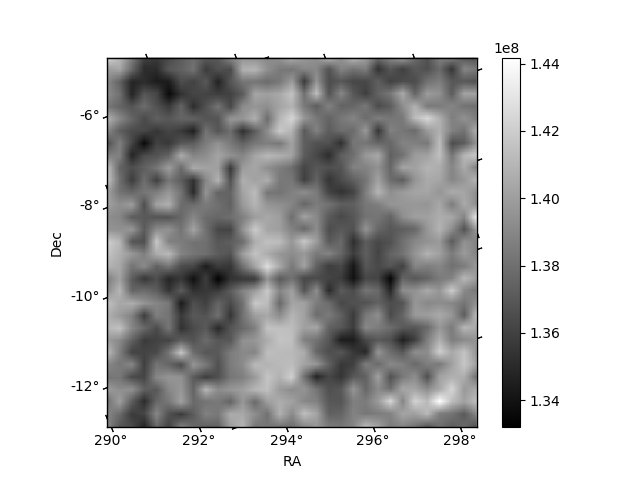
Histogram calculated using DETX and DETY for each event in the final _common_clean file
| Quadrant A | 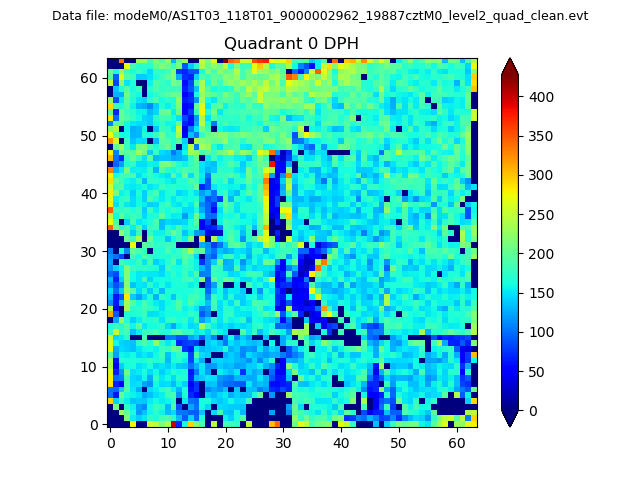 |
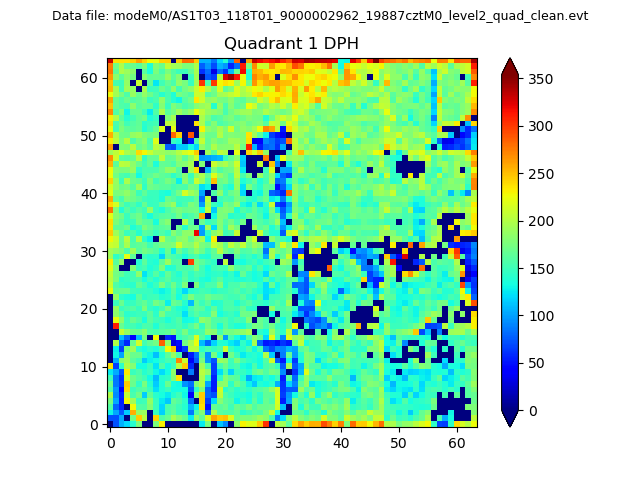 |
Quadrant B |
|---|---|---|---|
| Quadrant D | 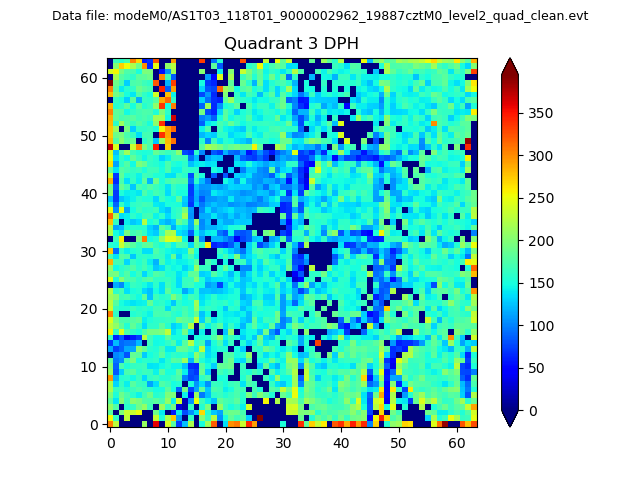 |
 |
Quadrant C |
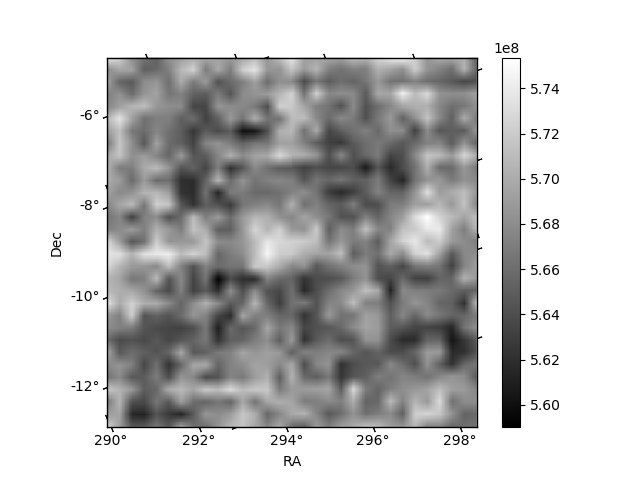
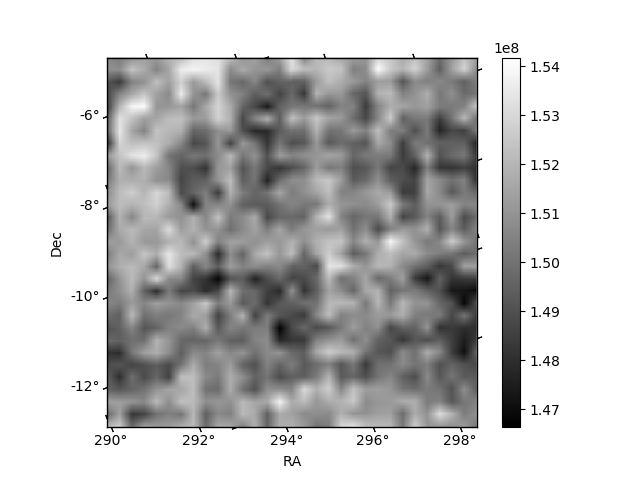
| Plot type | Count rate plots | Images |
|---|---|---|
| Comparison with Poisson distribution Blue bars denote a histogram of data divided into 1 sec bins. Red curve is a Poisson curve with rate = median count rate of data. |
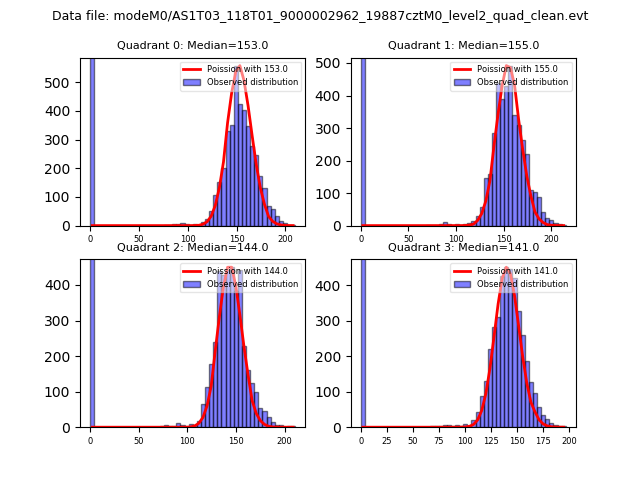 |
 |
| Quadrant-wise count rates Data is divided into 100 sec bins |
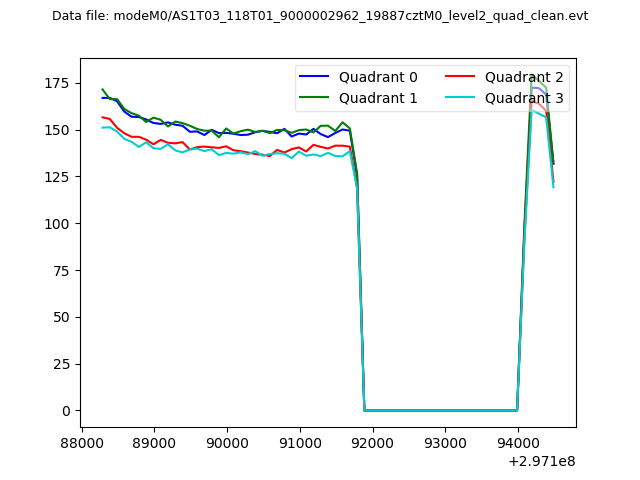 |
|
| Module-wise count rates for Quadrant A Data is divided into 100 sec bins |
 |
 |
| Module-wise count rates for Quadrant B Data is divided into 100 sec bins |
 |
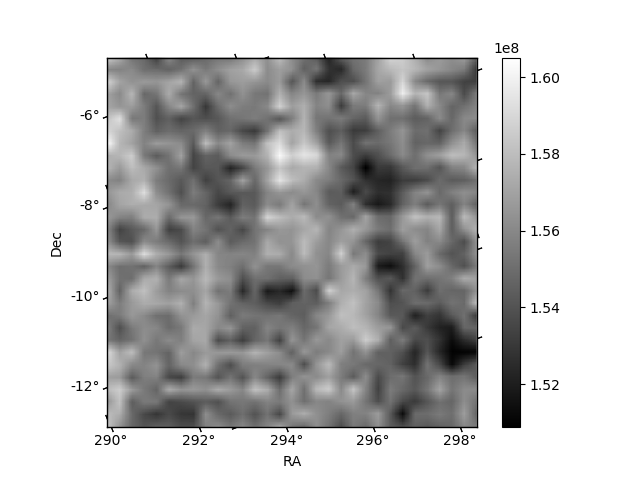 |
| Module-wise count rates for Quadrant C Data is divided into 100 sec bins |
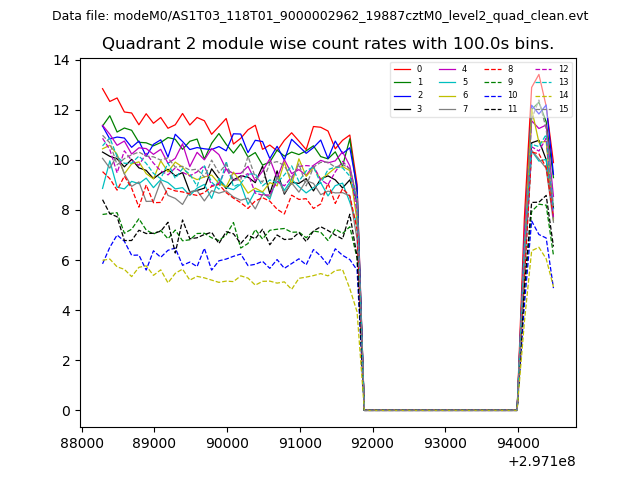 |
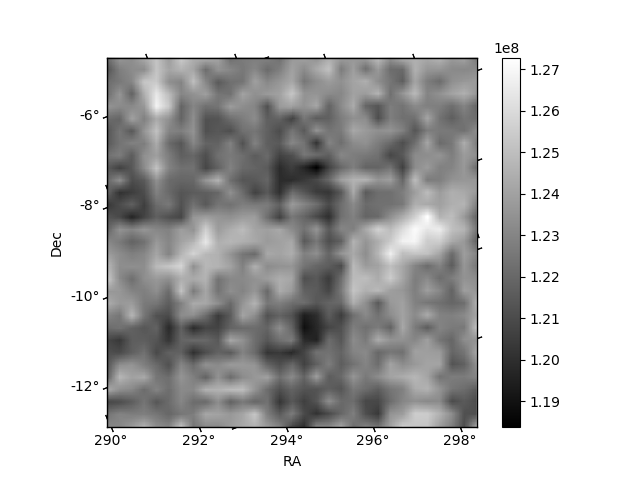 |
| Module-wise count rates for Quadrant D Data is divided into 100 sec bins |
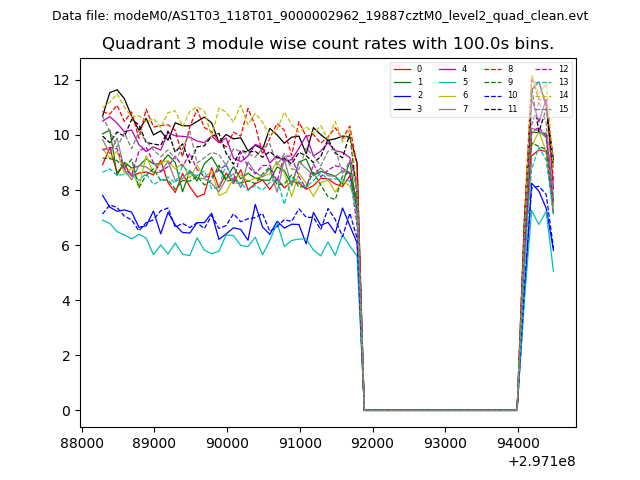 |
 |
| Parameter | Plot |
|---|---|
| CZT HV Monitor | 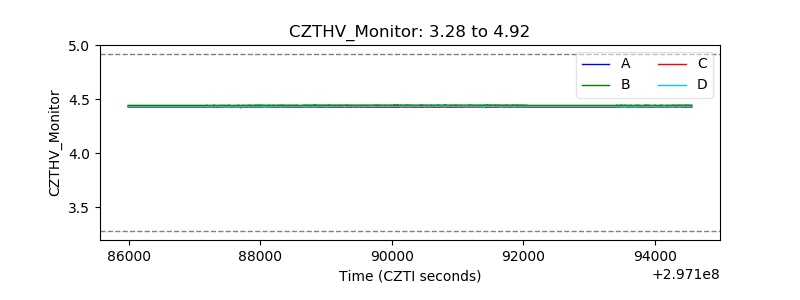 |
| D_VDD | 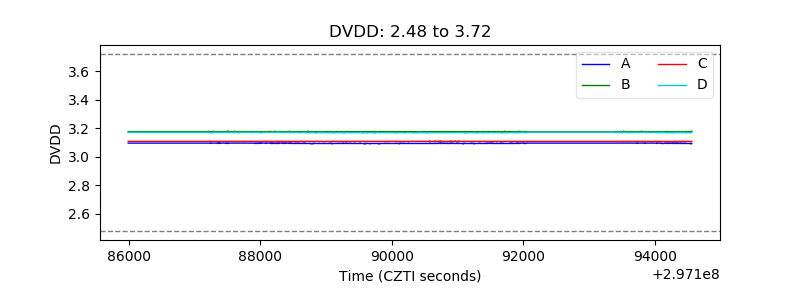 |
| Temperature 1 | 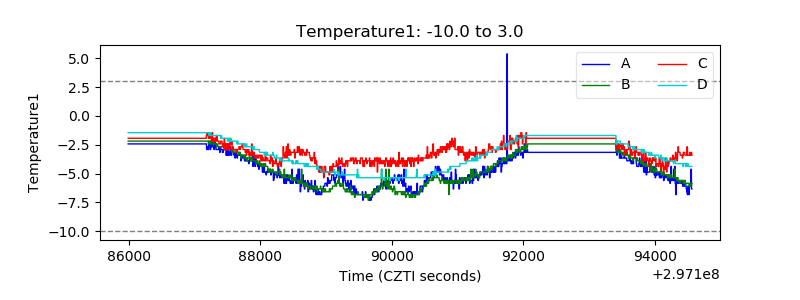 |
| Veto HV Monitor | 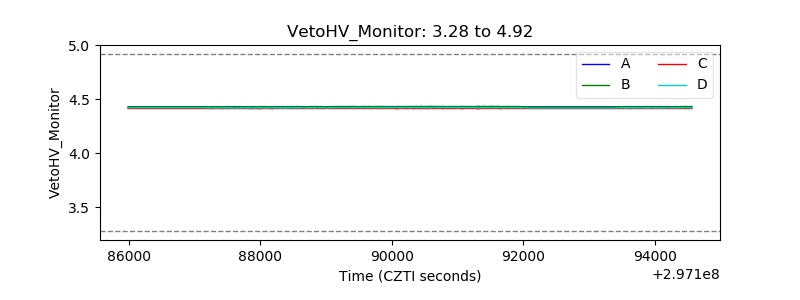 |
| Veto LLD |  |
| Alpha Counter | 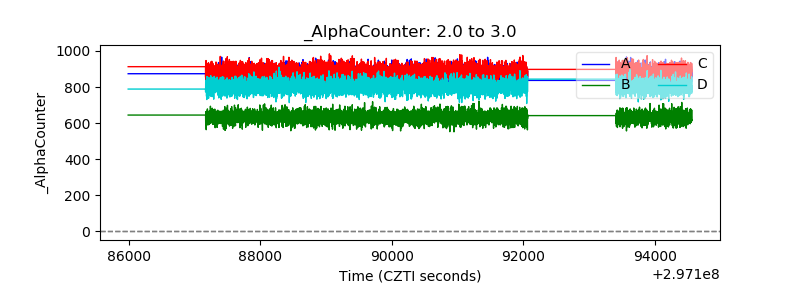 |
| _CPM_Rate | 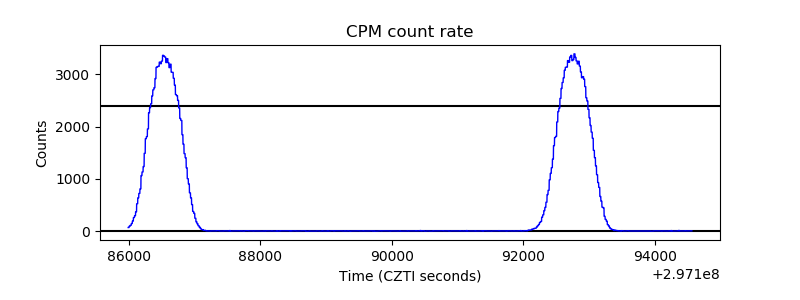 |
| CZT Counter | 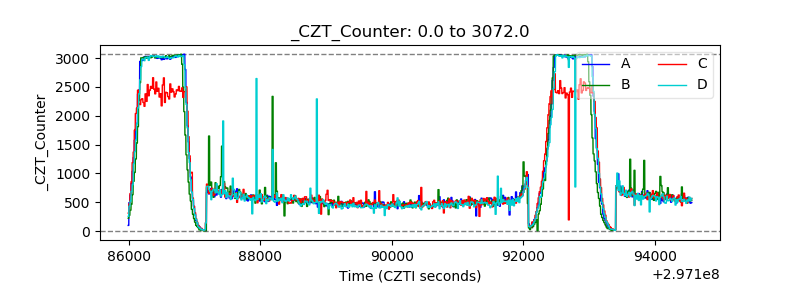 |
| +2.5 Volts monitor |  |
| +5 Volts monitor |  |
| _ROLL_ROT | 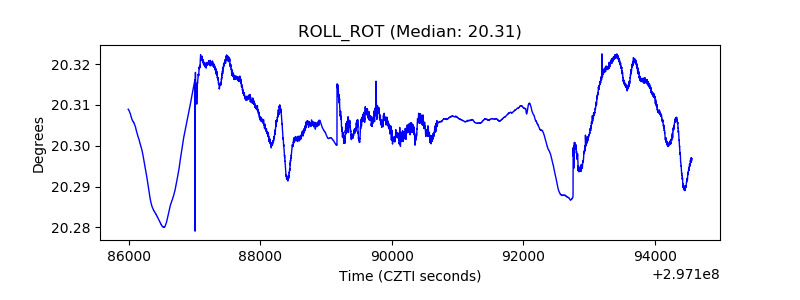 |
| _Roll_DEC | 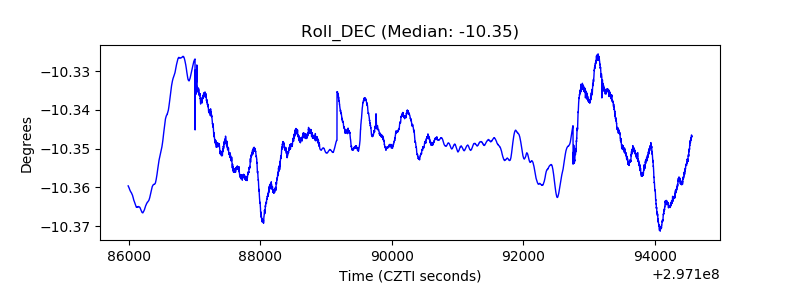 |
| _Roll_RA | 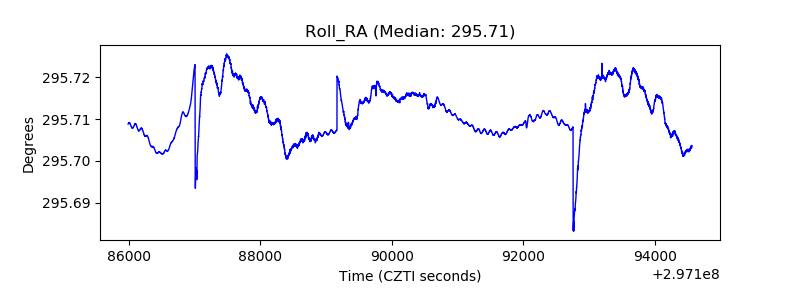 |
| Veto Counter | 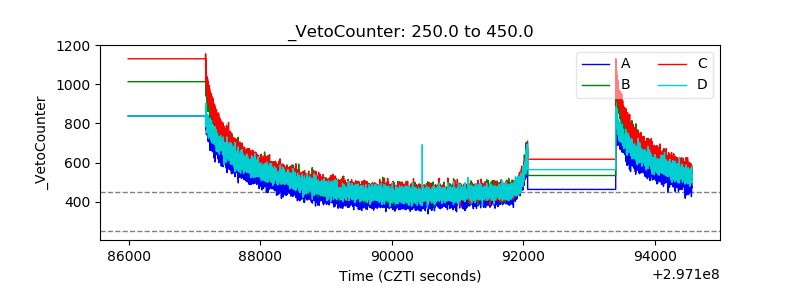 |