| Param | Original file | Final file |
|---|---|---|
| Filename | modeM0/AS1T03_118T01_9000002962_19890cztM0_level2.evt | modeM0/AS1T03_118T01_9000002962_19890cztM0_level2_quad_clean.evt |
| Size (bytes) | 471,458,880 | 102,913,920 |
| Size | 449.6 MB | 98.1 MB |
| Events in quadrant A | 3,231,207 | 674,285 |
| Events in quadrant B | 3,363,462 | 685,325 |
| Events in quadrant C | 3,775,420 | 655,283 |
| Events in quadrant D | 3,460,181 | 642,151 |
| Mode SS | |||
|---|---|---|---|
| Quadrant | BADHDUFLAG | Total packets | Discarded packets |
| A | 0 | 134 | 0 |
| B | 0 | 134 | 0 |
| C | 0 | 134 | 0 |
| D | 0 | 134 | 0 |
| Mode M9 | |||
|---|---|---|---|
| Quadrant | BADHDUFLAG | Total packets | Discarded packets |
| A | 0 | 24 | 0 |
| B | 0 | 24 | 0 |
| C | 0 | 24 | 0 |
| D | 0 | 24 | 0 |
| Mode M0 | |||
|---|---|---|---|
| Quadrant | BADHDUFLAG | Total packets | Discarded packets |
| A | 0 | 13812 | 2 |
| B | 0 | 14108 | 2 |
| C | 0 | 15379 | 2 |
| D | 0 | 14661 | 2 |
| Quadrant | Total seconds | Saturated seconds | Saturation percentage |
|---|---|---|---|
| A | 6600 | 42 | 0.636364% |
| B | 6601 | 88 | 1.333131% |
| C | 6601 | 137 | 2.075443% |
| D | 6601 | 69 | 1.045296% |
Noise dominated data is calculated using 1-second bins in cleaned event files. If a bin has >2000 counts, and if more than 50% of those come from <1% of pixels, then it is considered to be noise-dominated and hence unusable.
| Quadrant | # 1 sec bins | Bins with >0 counts | Bins with >2000 counts | High rate bins dominated by noise | Noise dominated (total time) | Noise dominated (detector-on time) | Marked lightcurve |
|---|---|---|---|---|---|---|---|
| A | 8930 | 6602 | 0 | 0 | 0.00% | 0.00% | 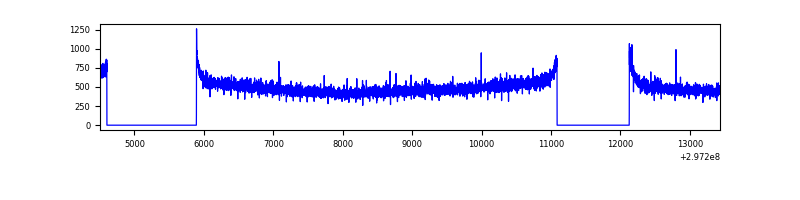 |
| B | 8931 | 6603 | 13 | 13 | 0.15% | 0.20% | 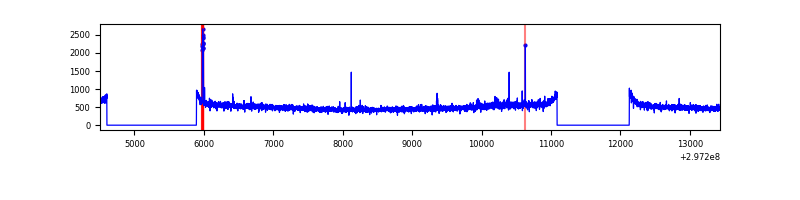 |
| C | 8931 | 6601 | 4 | 4 | 0.04% | 0.06% | 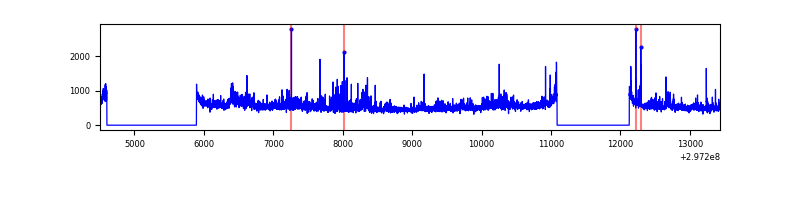 |
| D | 8931 | 6602 | 49 | 49 | 0.55% | 0.74% | 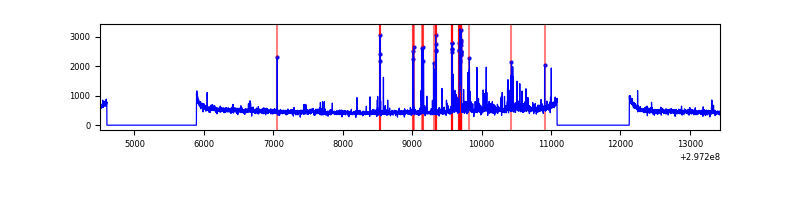 |
Top three noisy pixels from each quadrant. If the there are fewer than three noisy pixels in the level2.evt file, extra rows are filled as -1
| Pixel properties | Quadrant properties | ||||||
|---|---|---|---|---|---|---|---|
| Quadrant | DetID | PixID | Counts | Sigma | Mean | Median | Sigma |
| A | 0 | 226 | 6987 | 36.47 | 839 | 822 | 169.0 |
| A | 3 | 137 | 6700 | 34.77 | 839 | 822 | 169.0 |
| A | 12 | 194 | 6001 | 30.64 | 839 | 822 | 169.0 |
| B | 3 | 64 | 40377 | 246.46 | 840 | 819 | 160.5 |
| B | 12 | 111 | 19367 | 115.56 | 840 | 819 | 160.5 |
| B | 11 | 111 | 17200 | 102.06 | 840 | 819 | 160.5 |
| C | 9 | 221 | 462802 | 2406.81 | 817 | 823 | 191.9 |
| C | 14 | 238 | 127749 | 661.26 | 817 | 823 | 191.9 |
| C | 13 | 61 | 5582 | 24.79 | 817 | 823 | 191.9 |
| D | 1 | 52 | 179968 | 892.62 | 822 | 798 | 200.7 |
| D | 5 | 222 | 152541 | 755.98 | 822 | 798 | 200.7 |
| D | 2 | 234 | 26004 | 125.58 | 822 | 798 | 200.7 |
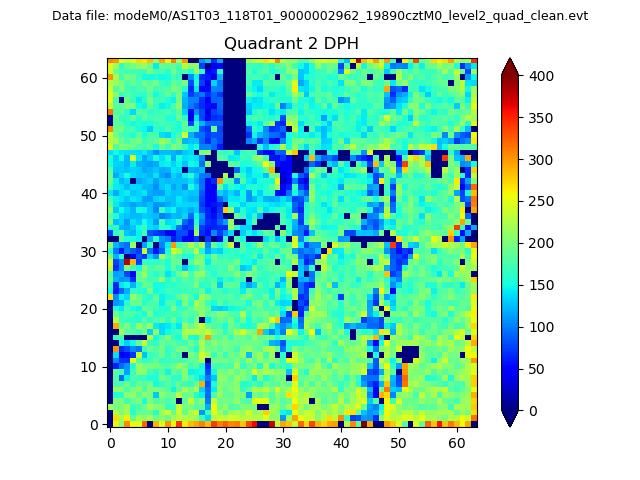
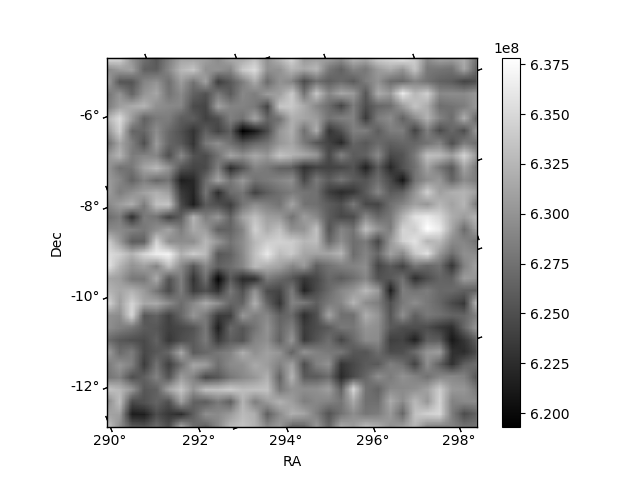
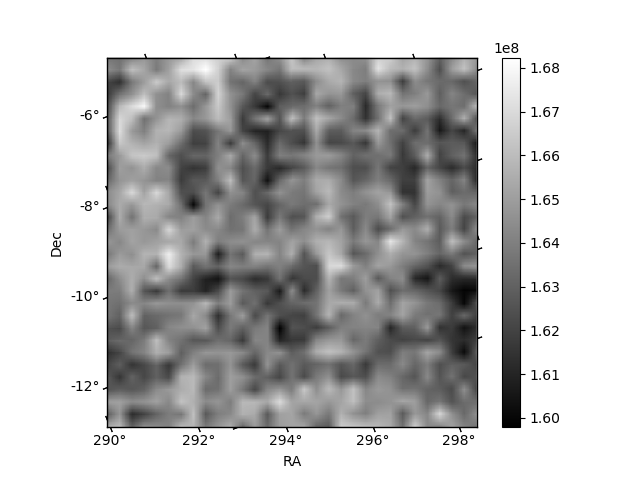
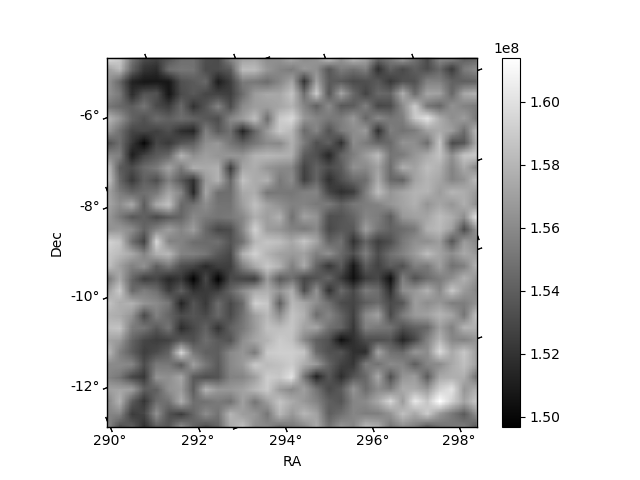
Histogram calculated using DETX and DETY for each event in the final _common_clean file
| Quadrant A | 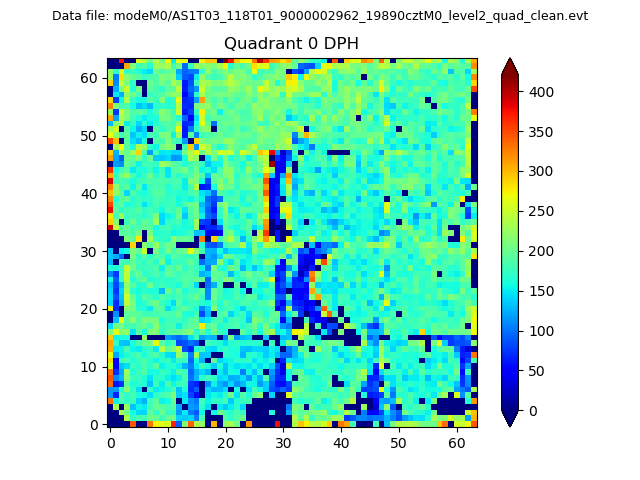 |
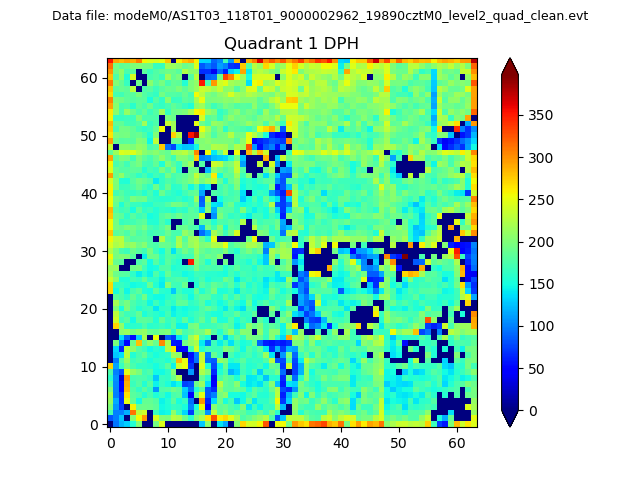 |
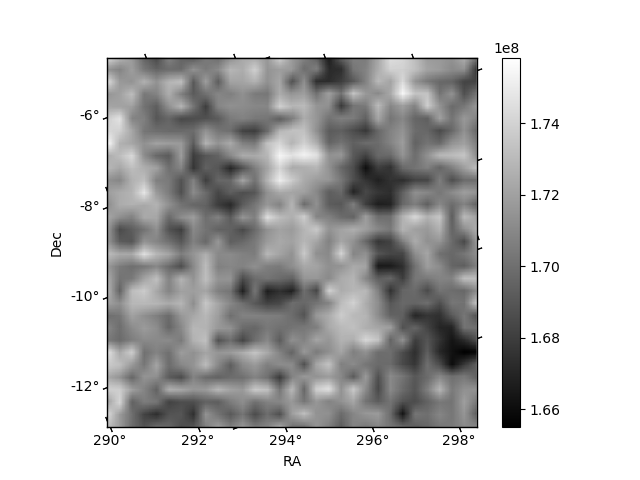
Quadrant B |
|---|---|---|---|
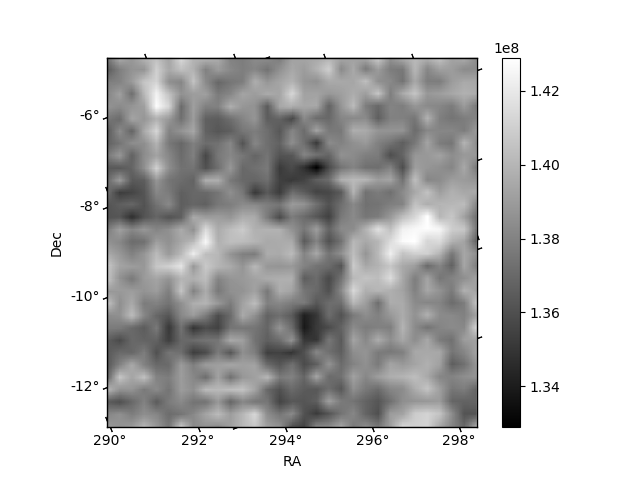
| Quadrant D | 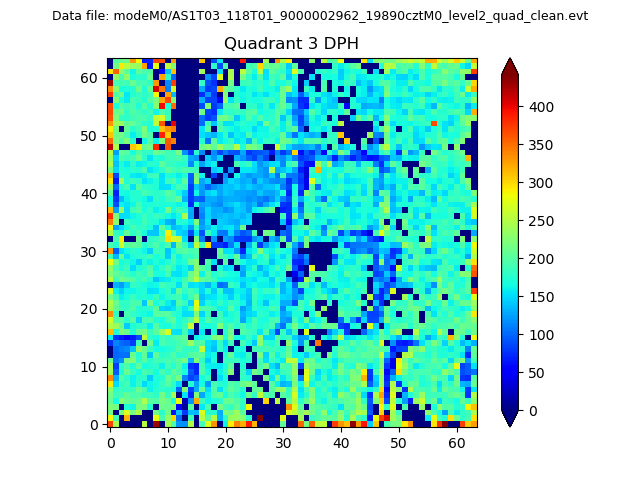 |
 |
Quadrant C |
| Plot type | Count rate plots | Images |
|---|---|---|
| Comparison with Poisson distribution Blue bars denote a histogram of data divided into 1 sec bins. Red curve is a Poisson curve with rate = median count rate of data. |
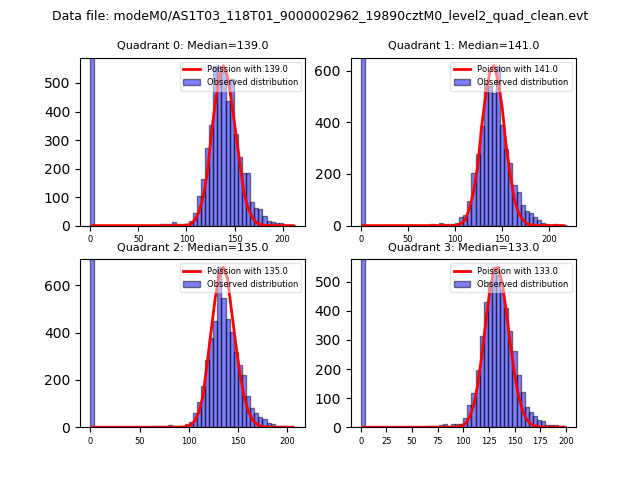 |
 |
| Quadrant-wise count rates Data is divided into 100 sec bins |
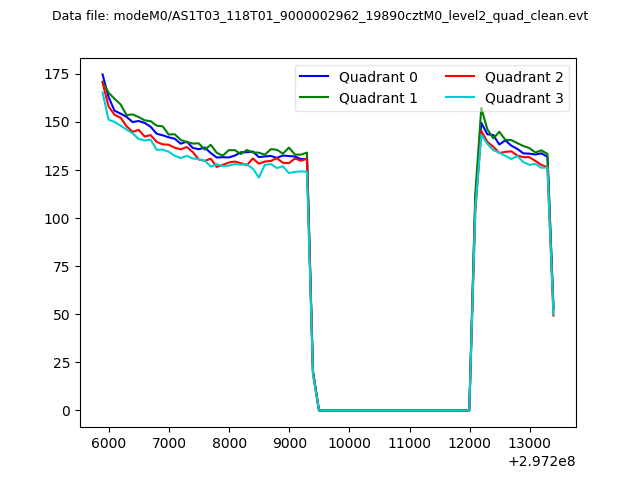 |
|
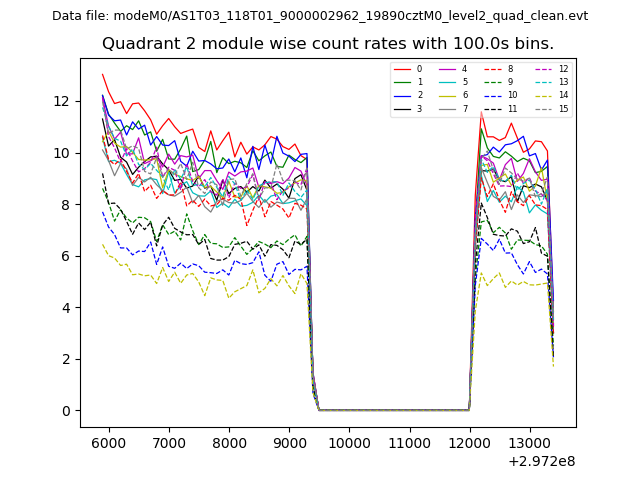
| Module-wise count rates for Quadrant A Data is divided into 100 sec bins |
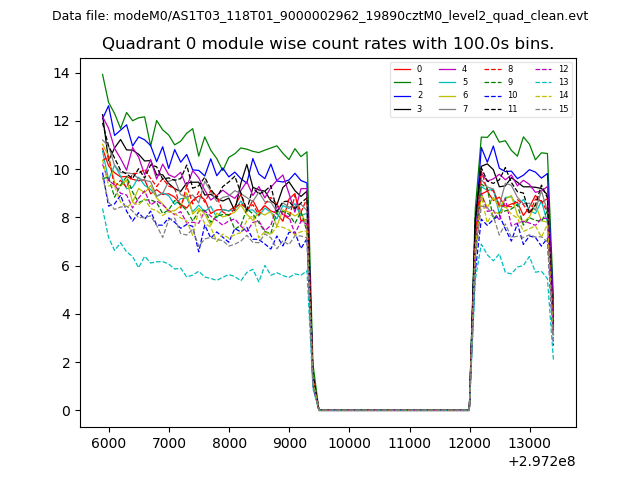 |
 |
| Module-wise count rates for Quadrant B Data is divided into 100 sec bins |
 |
 |
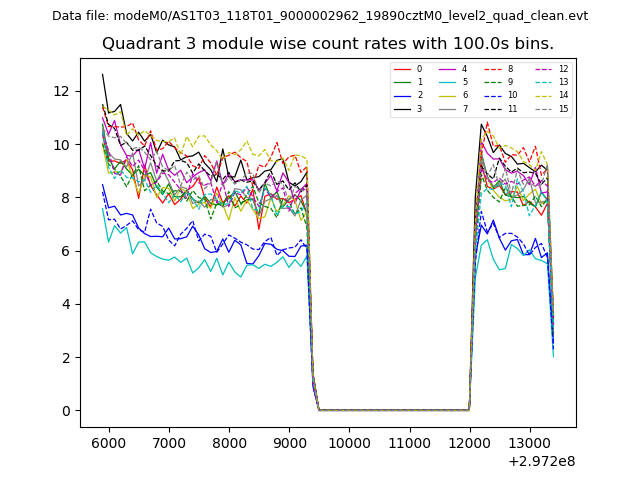
| Module-wise count rates for Quadrant C Data is divided into 100 sec bins |
 |
 |
| Module-wise count rates for Quadrant D Data is divided into 100 sec bins |
 |
 |
| Parameter | Plot |
|---|---|
| CZT HV Monitor | 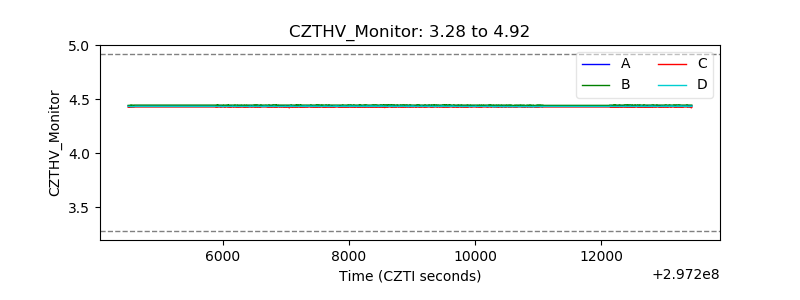 |
| D_VDD |  |
| Temperature 1 | 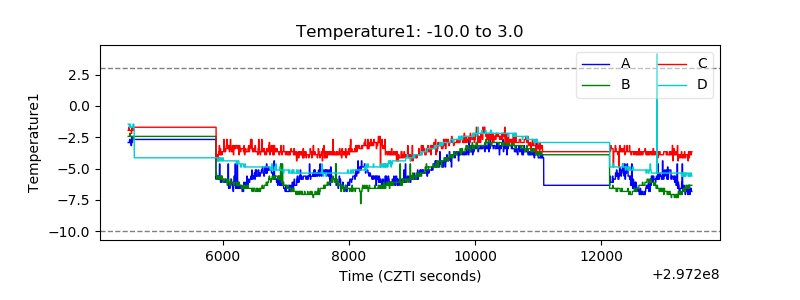 |
| Veto HV Monitor | 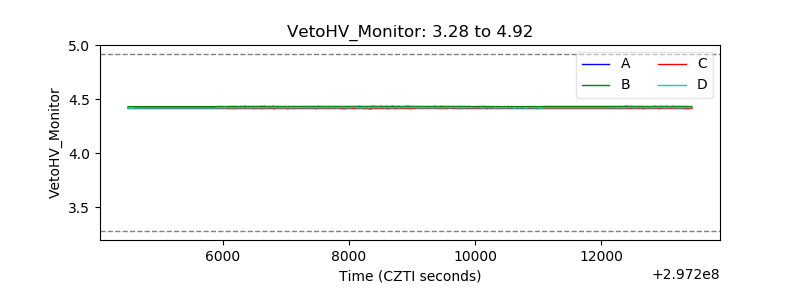 |
| Veto LLD | 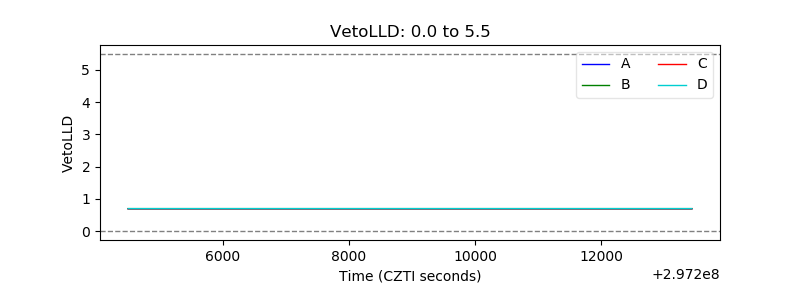 |
| Alpha Counter | 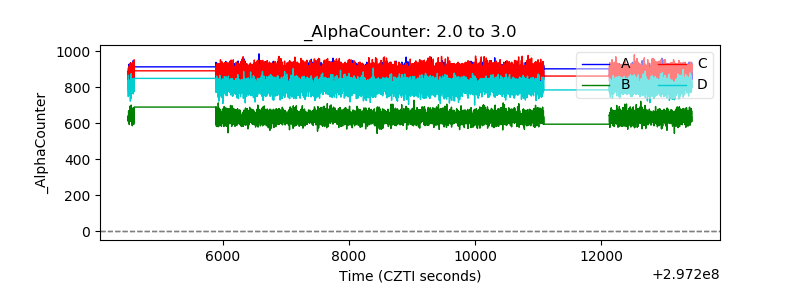 |
| _CPM_Rate | 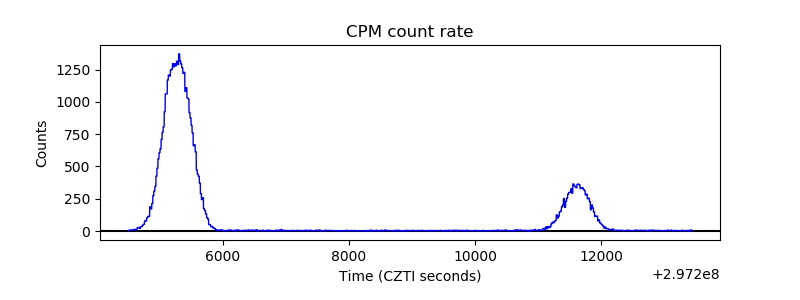 |
| CZT Counter | 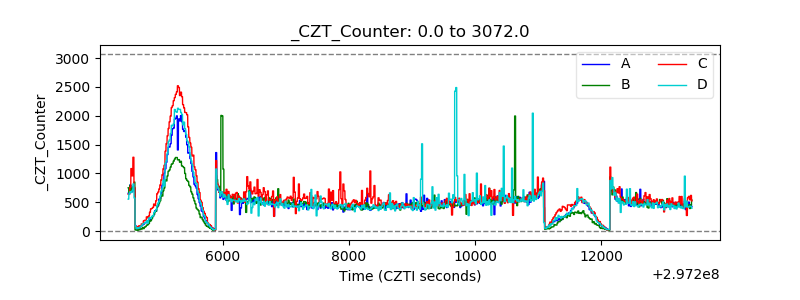 |
| +2.5 Volts monitor |  |
| +5 Volts monitor |  |
| _ROLL_ROT | 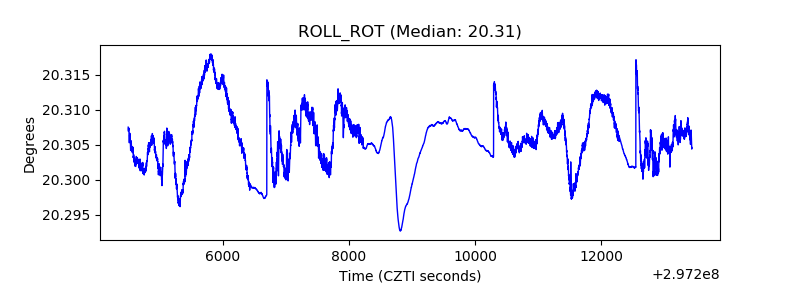 |
| _Roll_DEC | 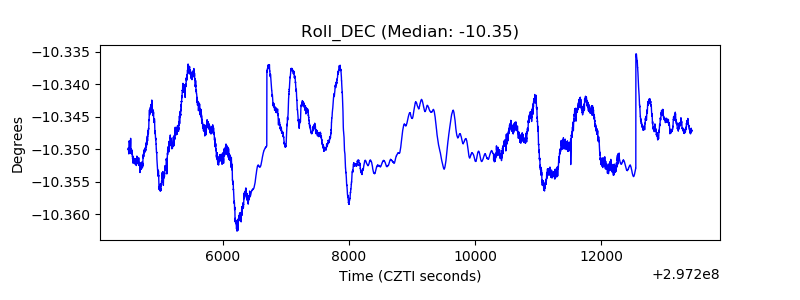 |
| _Roll_RA | 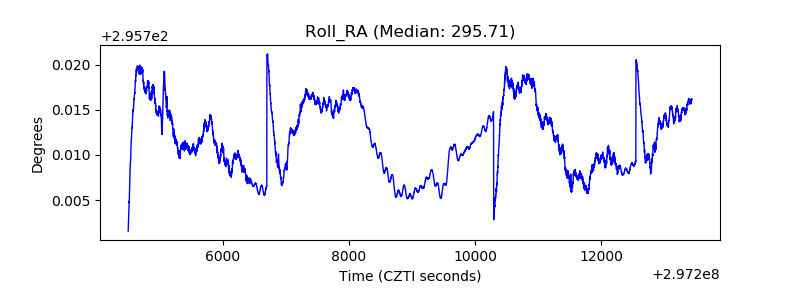 |
| Veto Counter | 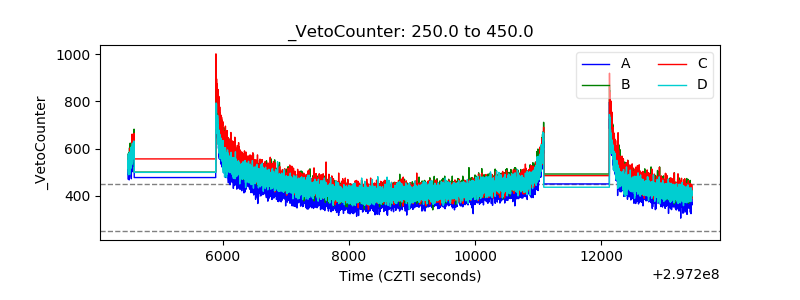 |