| Param | Original file | Final file |
|---|---|---|
| Filename | modeM0/AS1T03_118T01_9000002962_19893cztM0_level2.evt | modeM0/AS1T03_118T01_9000002962_19893cztM0_level2_quad_clean.evt |
| Size (bytes) | 595,408,320 | 113,544,000 |
| Size | 567.8 MB | 108.3 MB |
| Events in quadrant A | 4,176,526 | 742,514 |
| Events in quadrant B | 3,941,310 | 753,998 |
| Events in quadrant C | 4,048,937 | 720,574 |
| Events in quadrant D | 5,320,624 | 663,452 |
| Mode SS | |||
|---|---|---|---|
| Quadrant | BADHDUFLAG | Total packets | Discarded packets |
| A | 0 | 168 | 0 |
| B | 0 | 168 | 0 |
| C | 0 | 168 | 0 |
| D | 0 | 168 | 0 |
| Mode M9 | |||
|---|---|---|---|
| Quadrant | BADHDUFLAG | Total packets | Discarded packets |
| A | 0 | 4 | 0 |
| B | 0 | 4 | 0 |
| C | 0 | 4 | 0 |
| D | 0 | 4 | 0 |
| Mode M0 | |||
|---|---|---|---|
| Quadrant | BADHDUFLAG | Total packets | Discarded packets |
| A | 0 | 17714 | 2 |
| B | 0 | 16891 | 2 |
| C | 0 | 17126 | 2 |
| D | 0 | 21243 | 2 |
| Quadrant | Total seconds | Saturated seconds | Saturation percentage |
|---|---|---|---|
| A | 8010 | 273 | 3.408240% |
| B | 8010 | 242 | 3.021223% |
| C | 8010 | 254 | 3.171036% |
| D | 8010 | 703 | 8.776529% |
Noise dominated data is calculated using 1-second bins in cleaned event files. If a bin has >2000 counts, and if more than 50% of those come from <1% of pixels, then it is considered to be noise-dominated and hence unusable.
| Quadrant | # 1 sec bins | Bins with >0 counts | Bins with >2000 counts | High rate bins dominated by noise | Noise dominated (total time) | Noise dominated (detector-on time) | Marked lightcurve |
|---|---|---|---|---|---|---|---|
| A | 8540 | 8010 | 51 | 51 | 0.60% | 0.64% | 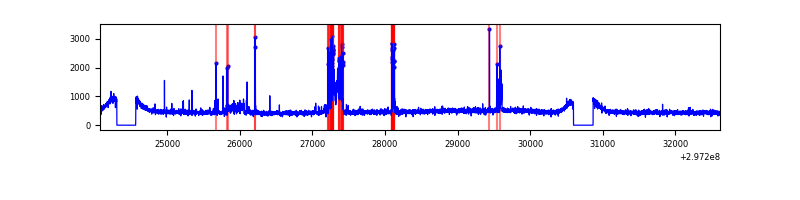 |
| B | 8540 | 8011 | 3 | 3 | 0.04% | 0.04% | 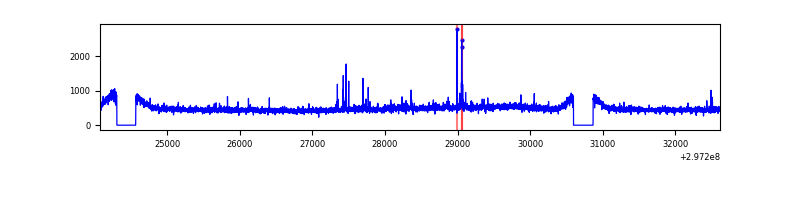 |
| C | 8540 | 8010 | 0 | 0 | 0.00% | 0.00% | 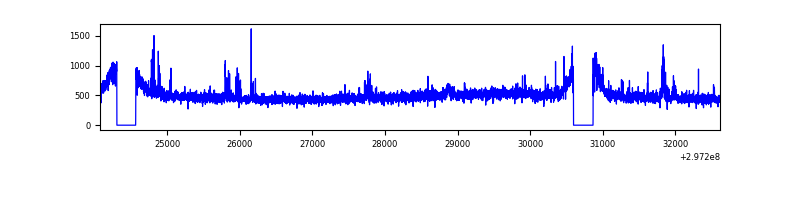 |
| D | 8540 | 8011 | 526 | 526 | 6.16% | 6.57% | 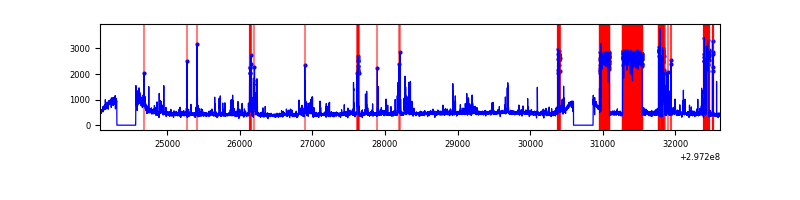 |
Top three noisy pixels from each quadrant. If the there are fewer than three noisy pixels in the level2.evt file, extra rows are filled as -1
| Pixel properties | Quadrant properties | ||||||
|---|---|---|---|---|---|---|---|
| Quadrant | DetID | PixID | Counts | Sigma | Mean | Median | Sigma |
| A | 5 | 16 | 369400 | 1828.61 | 987 | 965 | 201.5 |
| A | 3 | 137 | 8295 | 36.38 | 987 | 965 | 201.5 |
| A | 0 | 226 | 8221 | 36.01 | 987 | 965 | 201.5 |
| B | 4 | 216 | 41474 | 212.8 | 982 | 955 | 190.4 |
| B | 12 | 111 | 23739 | 119.66 | 982 | 955 | 190.4 |
| B | 11 | 111 | 20859 | 104.53 | 982 | 955 | 190.4 |
| C | 9 | 221 | 156249 | 684.26 | 953 | 957 | 226.9 |
| C | 14 | 238 | 144123 | 630.83 | 953 | 957 | 226.9 |
| C | 8 | 128 | 16657 | 69.18 | 953 | 957 | 226.9 |
| D | 1 | 52 | 1525426 | 6736.71 | 936 | 908 | 226.3 |
| D | 5 | 222 | 92360 | 404.12 | 936 | 908 | 226.3 |
| D | 12 | 218 | 83325 | 364.19 | 936 | 908 | 226.3 |
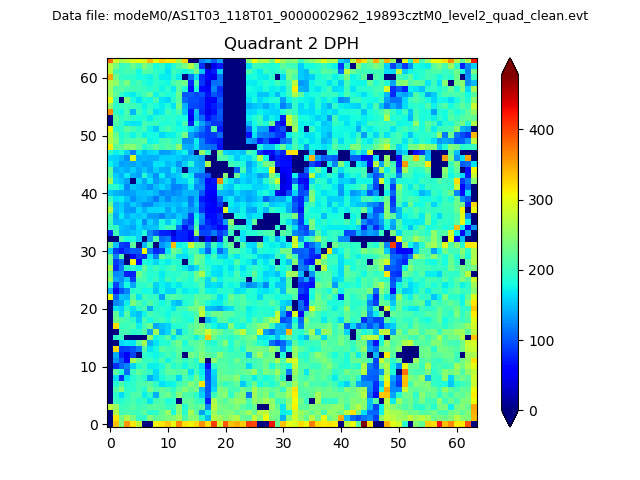
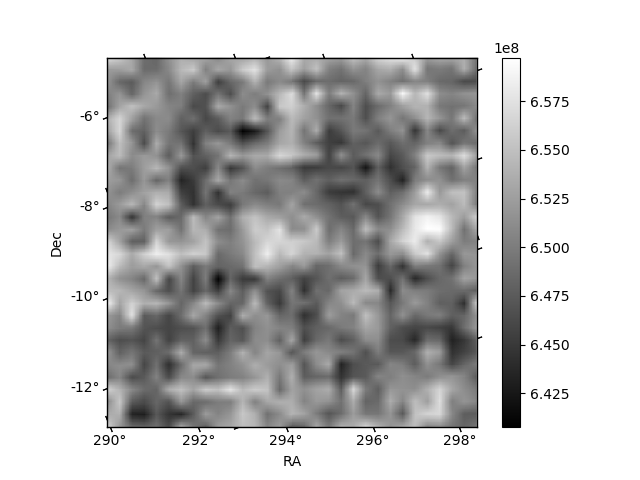
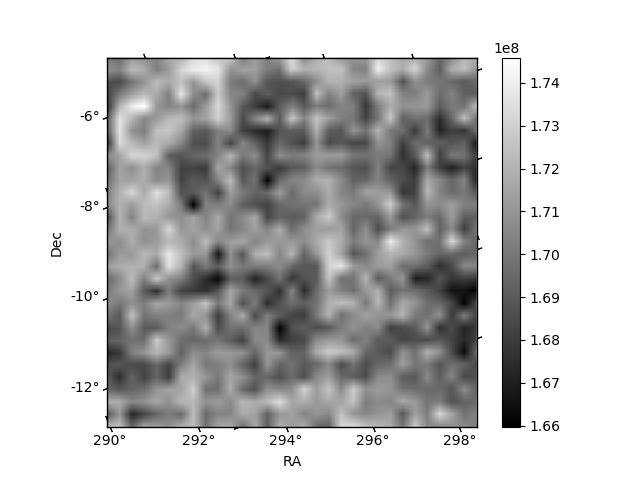
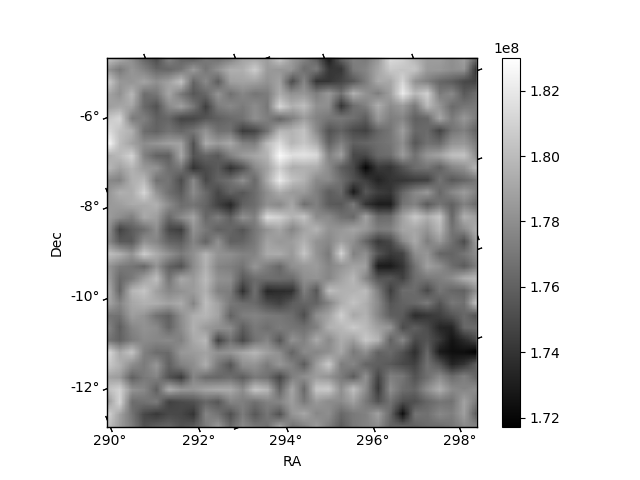
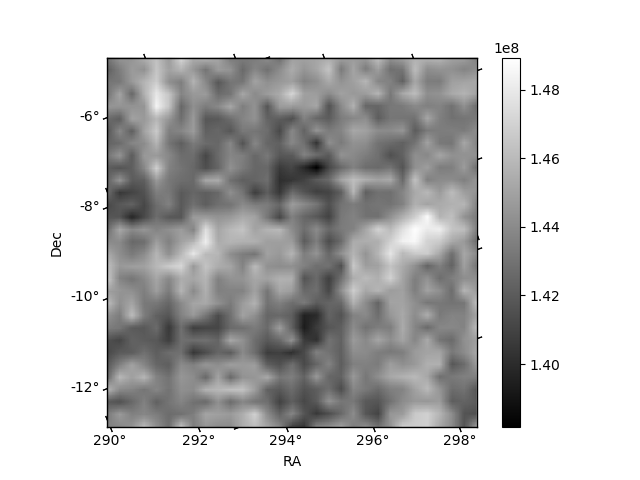
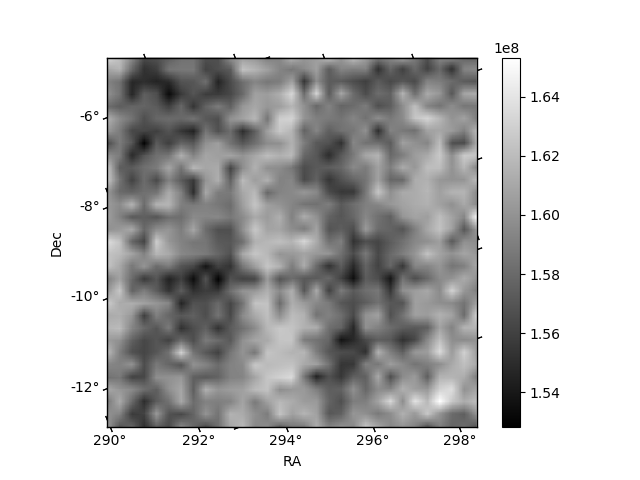
Histogram calculated using DETX and DETY for each event in the final _common_clean file
| Quadrant A | 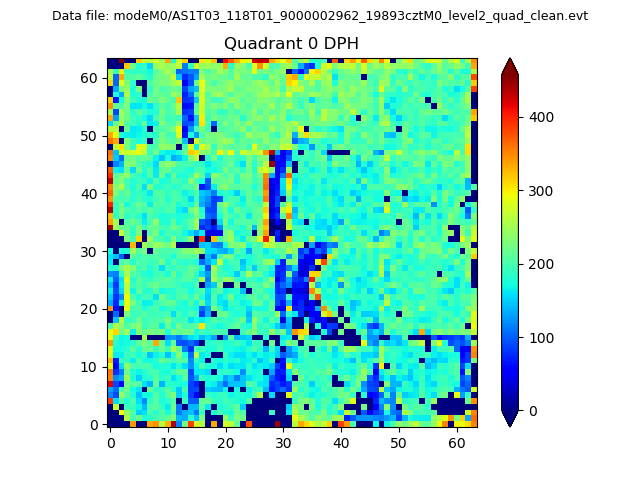 |
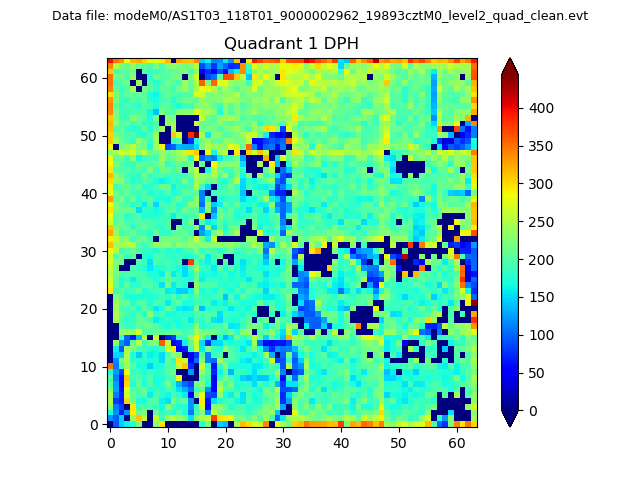 |
Quadrant B |
|---|---|---|---|
| Quadrant D | 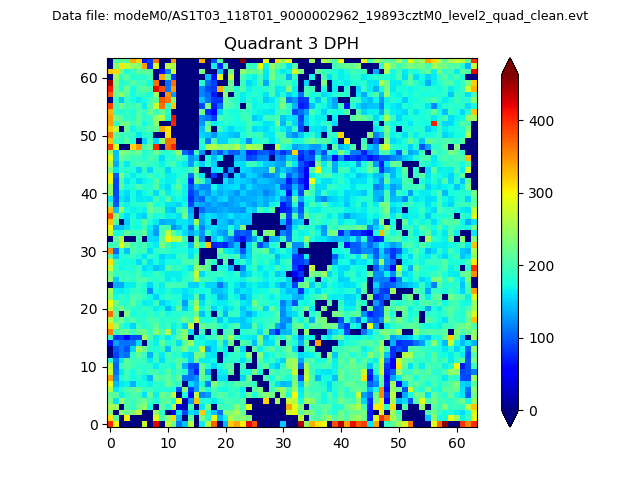 |
 |
Quadrant C |
| Plot type | Count rate plots | Images |
|---|---|---|
| Comparison with Poisson distribution Blue bars denote a histogram of data divided into 1 sec bins. Red curve is a Poisson curve with rate = median count rate of data. |
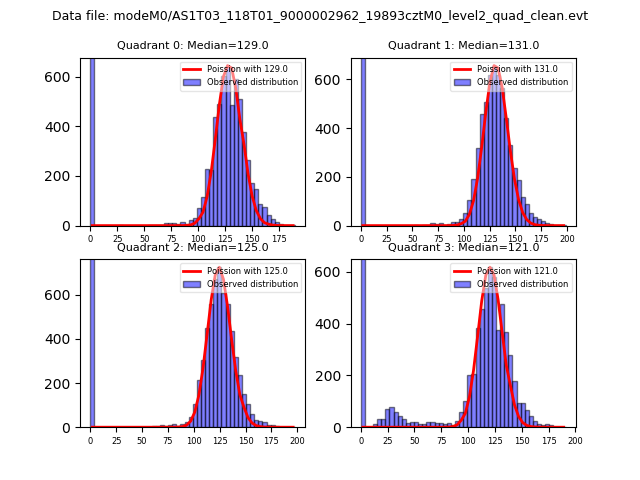 |
 |
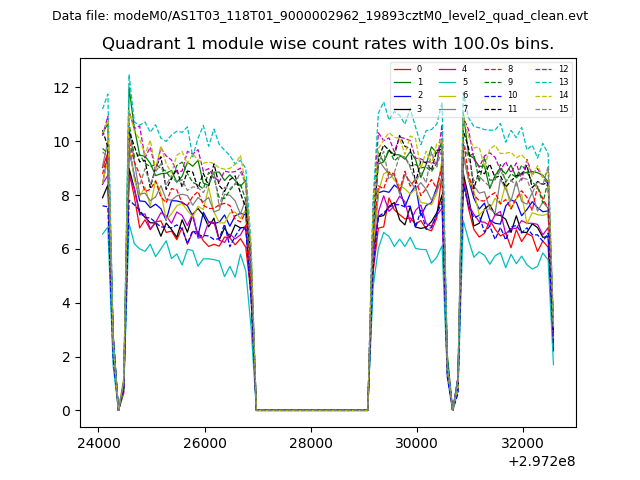
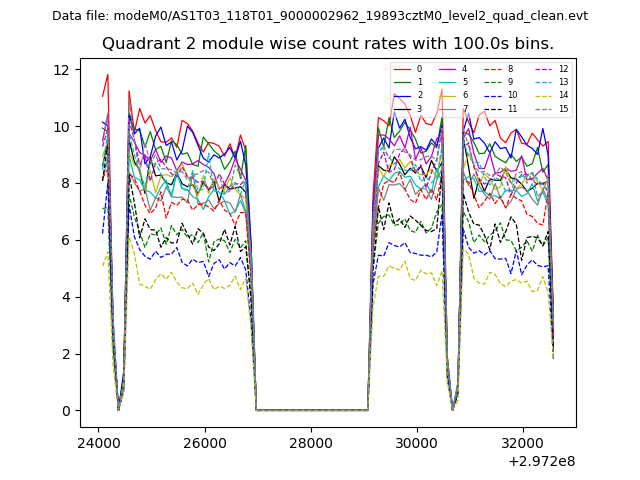
| Quadrant-wise count rates Data is divided into 100 sec bins |
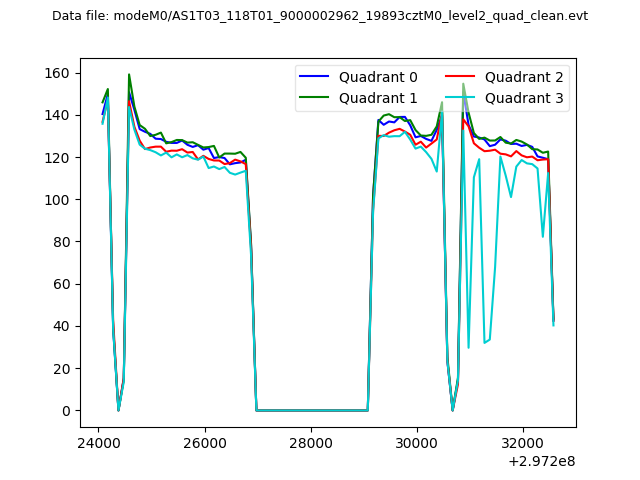 |
|
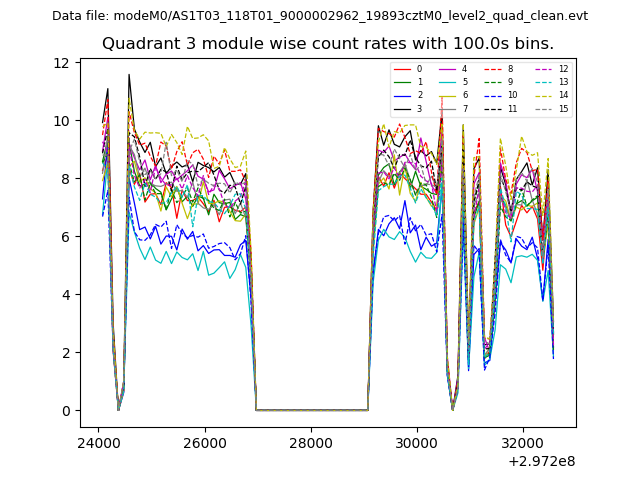
| Module-wise count rates for Quadrant A Data is divided into 100 sec bins |
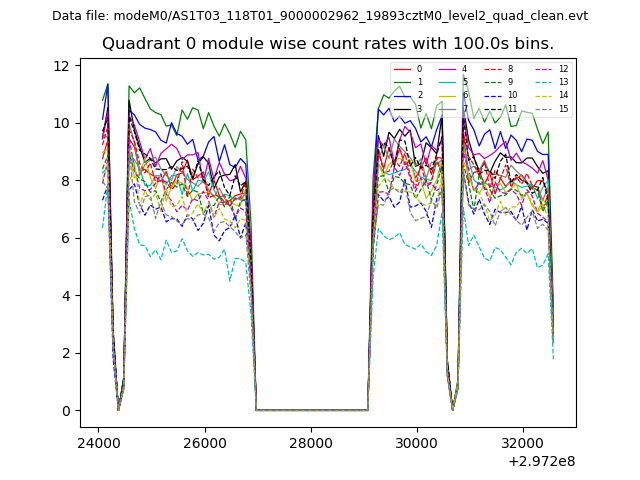 |
 |
| Module-wise count rates for Quadrant B Data is divided into 100 sec bins |
 |
 |
| Module-wise count rates for Quadrant C Data is divided into 100 sec bins |
 |
 |
| Module-wise count rates for Quadrant D Data is divided into 100 sec bins |
 |
 |
| Parameter | Plot |
|---|---|
| CZT HV Monitor | 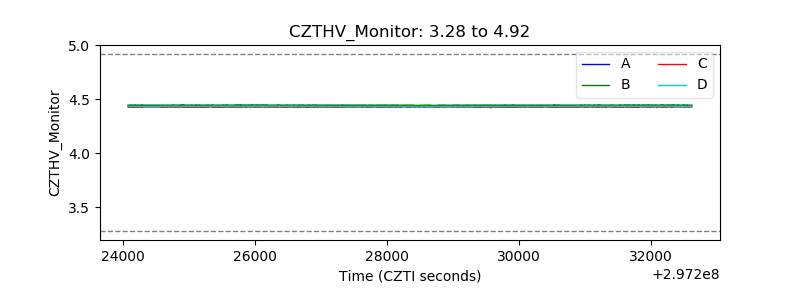 |
| D_VDD | 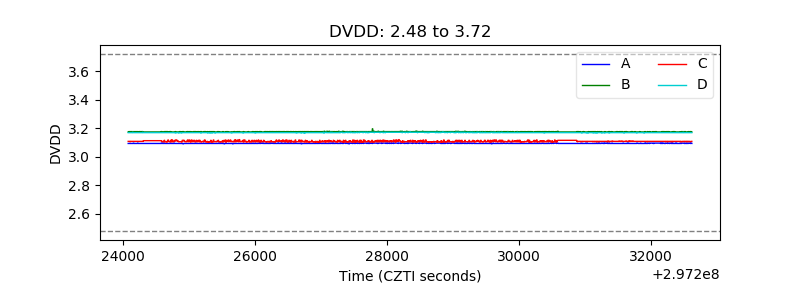 |
| Temperature 1 | 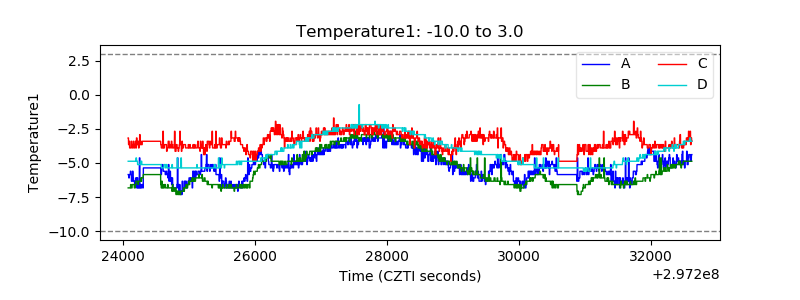 |
| Veto HV Monitor |  |
| Veto LLD | 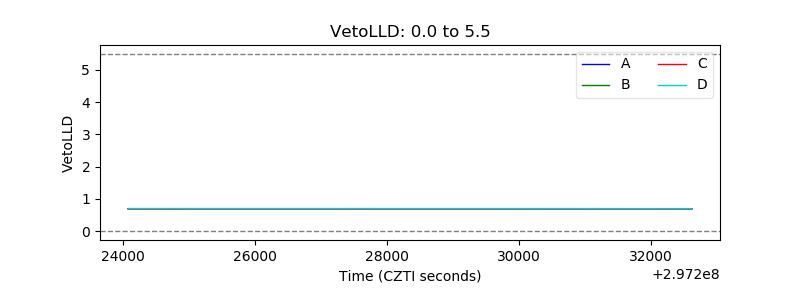 |
| Alpha Counter | 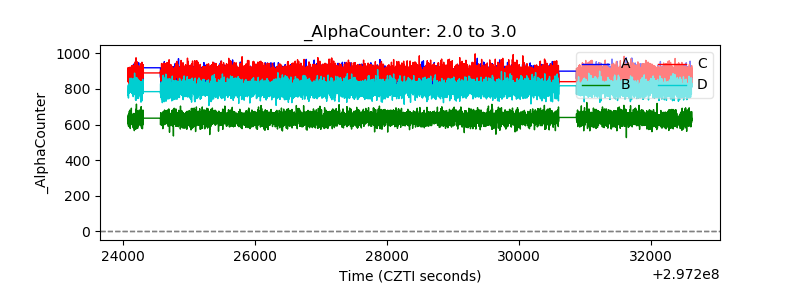 |
| _CPM_Rate | 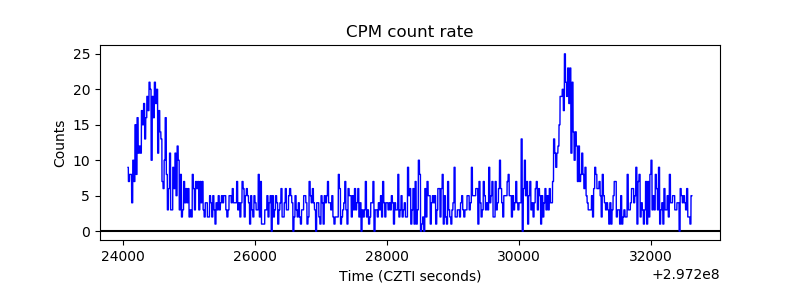 |
| CZT Counter | 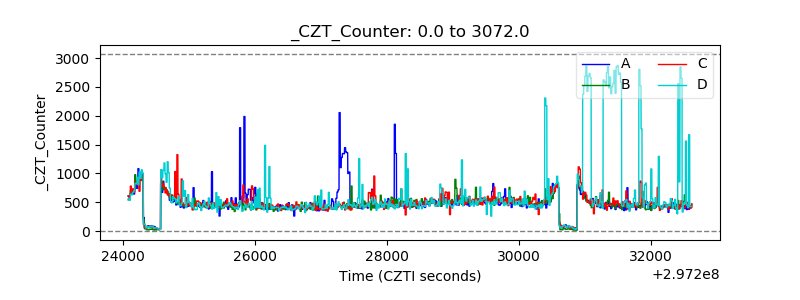 |
| +2.5 Volts monitor | 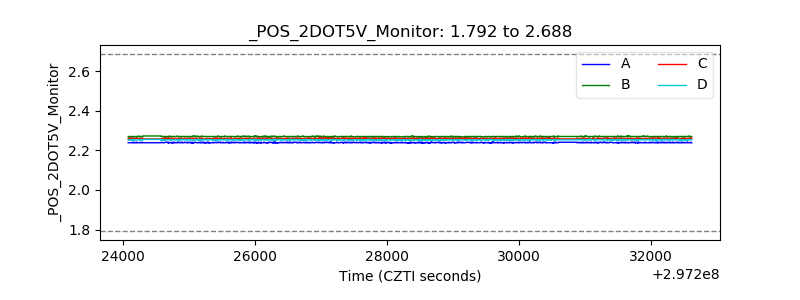 |
| +5 Volts monitor | 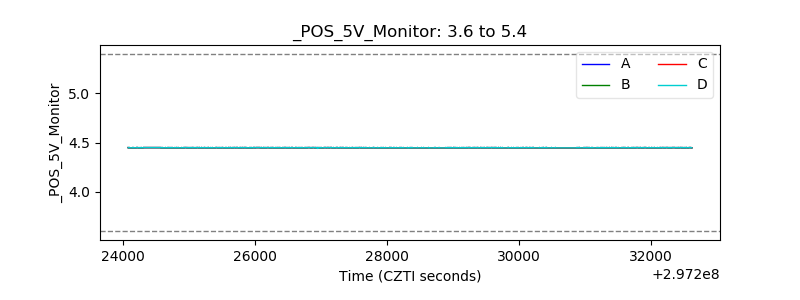 |
| _ROLL_ROT | 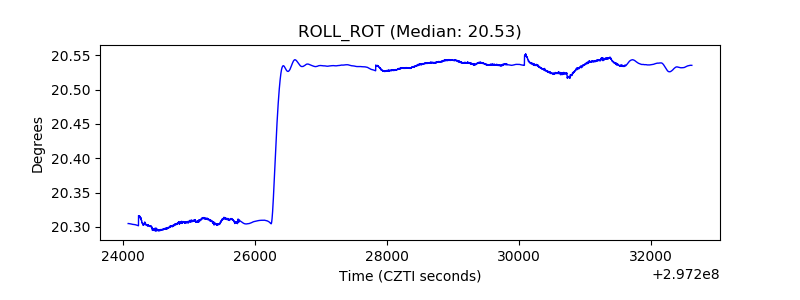 |
| _Roll_DEC | 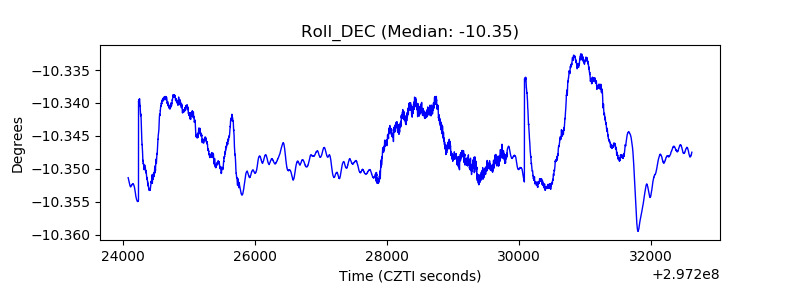 |
| _Roll_RA | 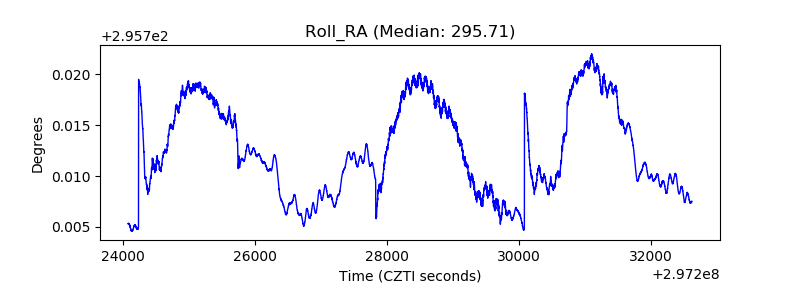 |
| Veto Counter | 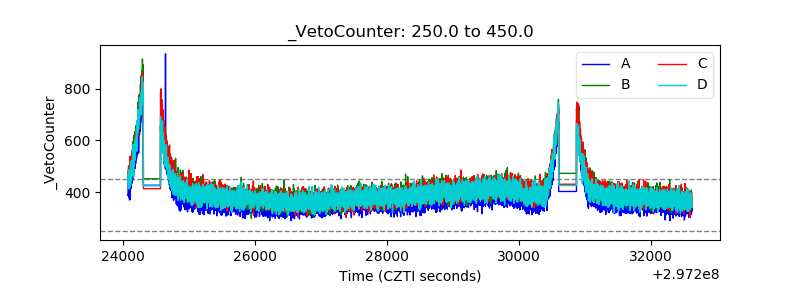 |