| Param | Original file | Final file |
|---|---|---|
| Filename | modeM0/AS1T03_118T01_9000002962_19896cztM0_level2.evt | modeM0/AS1T03_118T01_9000002962_19896cztM0_level2_quad_clean.evt |
| Size (bytes) | 1,402,038,720 | 222,920,640 |
| Size | 1.3 GB | 212.6 MB |
| Events in quadrant A | 9,397,874 | 1,413,710 |
| Events in quadrant B | 9,130,817 | 1,424,978 |
| Events in quadrant C | 8,976,449 | 1,365,950 |
| Events in quadrant D | 13,705,346 | 1,271,286 |
| Mode SS | |||
|---|---|---|---|
| Quadrant | BADHDUFLAG | Total packets | Discarded packets |
| A | 0 | 374 | 0 |
| B | 0 | 374 | 0 |
| C | 0 | 374 | 0 |
| D | 0 | 374 | 0 |
| Mode M9 | |||
|---|---|---|---|
| Quadrant | BADHDUFLAG | Total packets | Discarded packets |
| A | 0 | 19 | 0 |
| B | 0 | 19 | 0 |
| C | 0 | 19 | 0 |
| D | 0 | 19 | 0 |
| Mode M0 | |||
|---|---|---|---|
| Quadrant | BADHDUFLAG | Total packets | Discarded packets |
| A | 0 | 39866 | 3 |
| B | 0 | 38645 | 3 |
| C | 0 | 38231 | 3 |
| D | 0 | 52818 | 3 |
| Quadrant | Total seconds | Saturated seconds | Saturation percentage |
|---|---|---|---|
| A | 18509 | 435 | 2.350208% |
| B | 18509 | 402 | 2.171916% |
| C | 18510 | 339 | 1.831442% |
| D | 18509 | 1744 | 9.422443% |
Noise dominated data is calculated using 1-second bins in cleaned event files. If a bin has >2000 counts, and if more than 50% of those come from <1% of pixels, then it is considered to be noise-dominated and hence unusable.
| Quadrant | # 1 sec bins | Bins with >0 counts | Bins with >2000 counts | High rate bins dominated by noise | Noise dominated (total time) | Noise dominated (detector-on time) | Marked lightcurve |
|---|---|---|---|---|---|---|---|
| A | 20239 | 18509 | 139 | 139 | 0.69% | 0.75% | 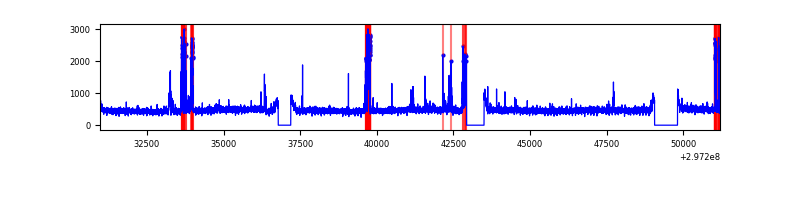 |
| B | 20239 | 18509 | 102 | 102 | 0.50% | 0.55% | 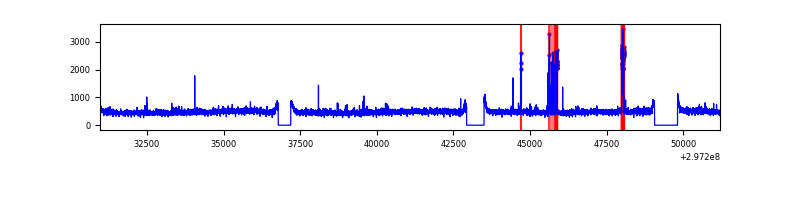 |
| C | 20240 | 18510 | 0 | 0 | 0.00% | 0.00% | 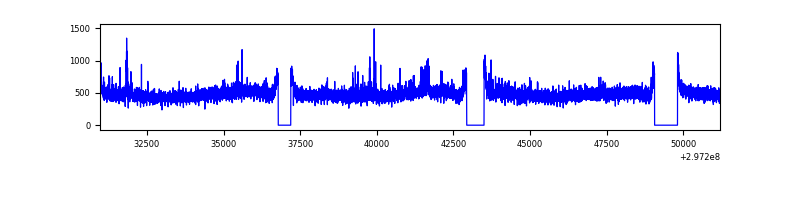 |
| D | 20239 | 18509 | 1476 | 1476 | 7.29% | 7.97% |  |
Top three noisy pixels from each quadrant. If the there are fewer than three noisy pixels in the level2.evt file, extra rows are filled as -1
| Pixel properties | Quadrant properties | ||||||
|---|---|---|---|---|---|---|---|
| Quadrant | DetID | PixID | Counts | Sigma | Mean | Median | Sigma |
| A | 5 | 16 | 790812 | 1750.81 | 2236 | 2186 | 450.4 |
| A | 0 | 226 | 18865 | 37.03 | 2236 | 2186 | 450.4 |
| A | 3 | 137 | 18823 | 36.93 | 2236 | 2186 | 450.4 |
| B | 3 | 64 | 152488 | 353.88 | 2222 | 2158 | 424.8 |
| B | 7 | 220 | 149685 | 347.28 | 2222 | 2158 | 424.8 |
| B | 12 | 111 | 52994 | 119.67 | 2222 | 2158 | 424.8 |
| C | 14 | 238 | 331789 | 652.77 | 2157 | 2171 | 505.0 |
| C | 9 | 221 | 154506 | 301.68 | 2157 | 2171 | 505.0 |
| C | 3 | 9 | 81406 | 156.92 | 2157 | 2171 | 505.0 |
| D | 1 | 52 | 4223466 | 8356.47 | 2093 | 2037 | 505.2 |
| D | 1 | 20 | 807328 | 1594.1 | 2093 | 2037 | 505.2 |
| D | 5 | 222 | 495065 | 975.97 | 2093 | 2037 | 505.2 |
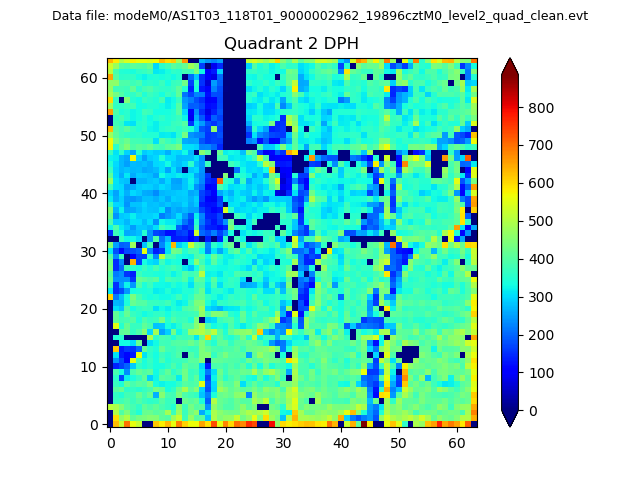
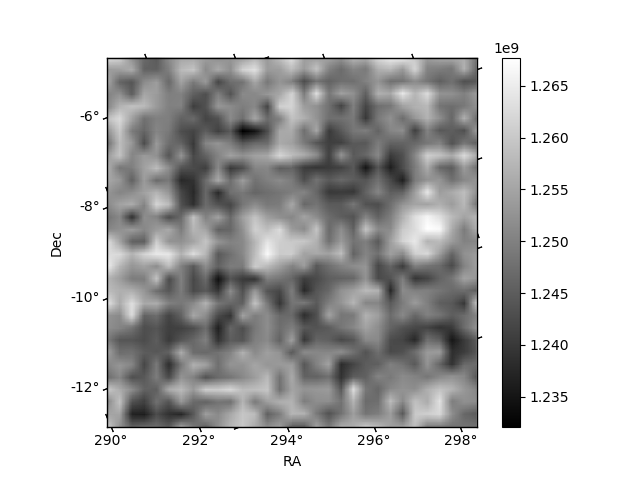
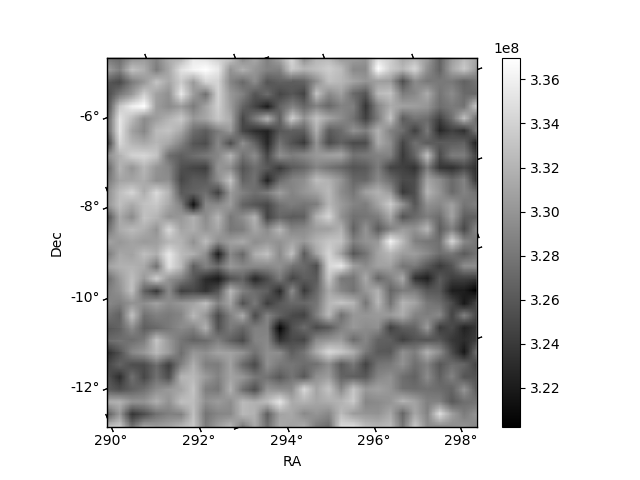
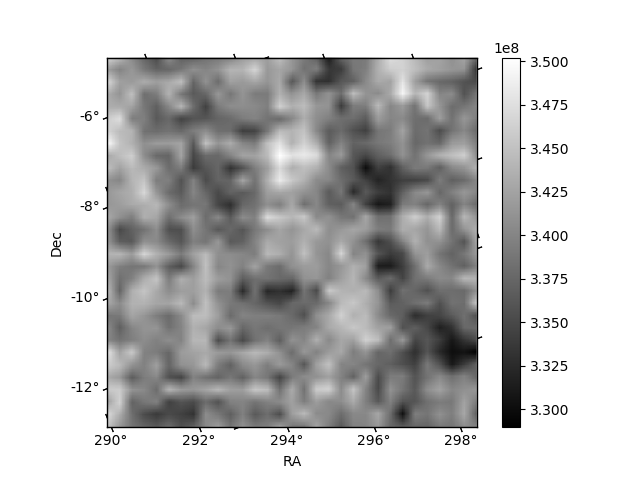
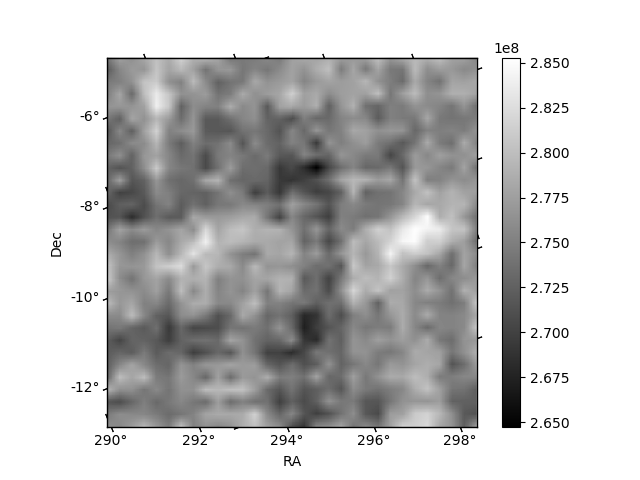
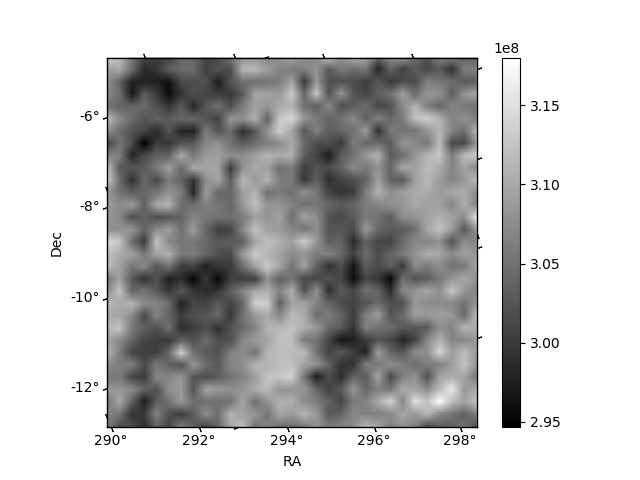
Histogram calculated using DETX and DETY for each event in the final _common_clean file
| Quadrant A | 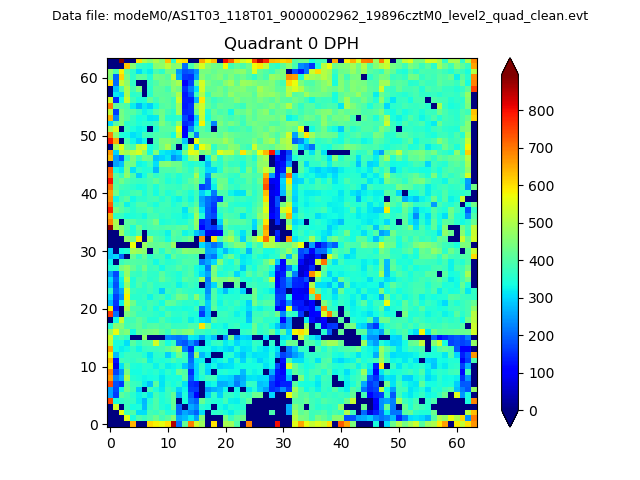 |
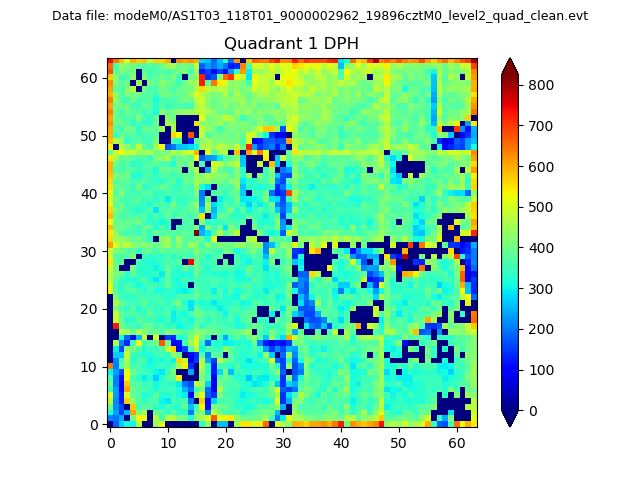 |
Quadrant B |
|---|---|---|---|
| Quadrant D | 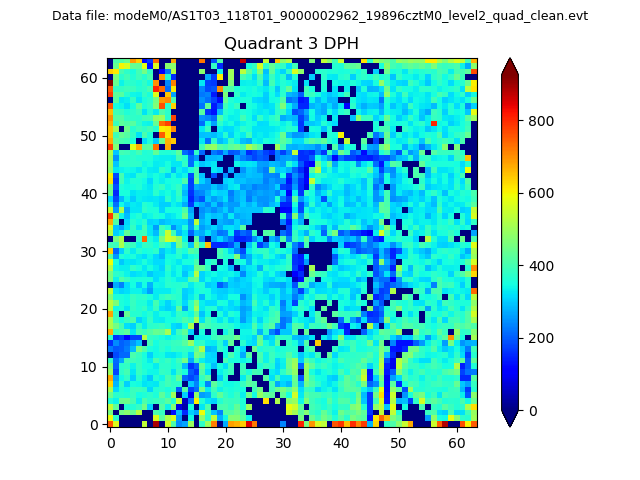 |
 |
Quadrant C |
| Plot type | Count rate plots | Images |
|---|---|---|
| Comparison with Poisson distribution Blue bars denote a histogram of data divided into 1 sec bins. Red curve is a Poisson curve with rate = median count rate of data. |
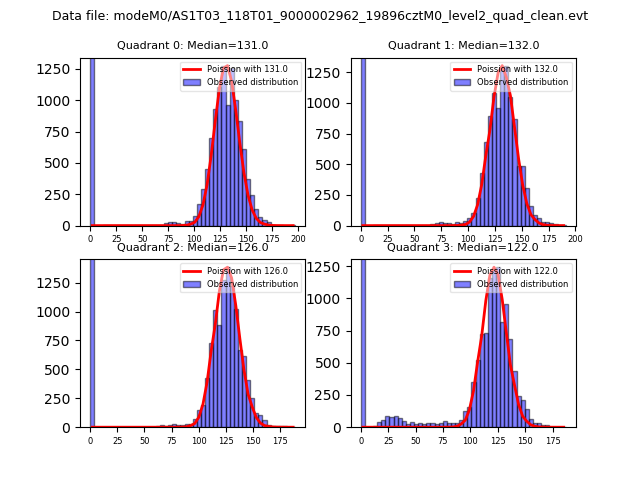 |
 |
| Quadrant-wise count rates Data is divided into 100 sec bins |
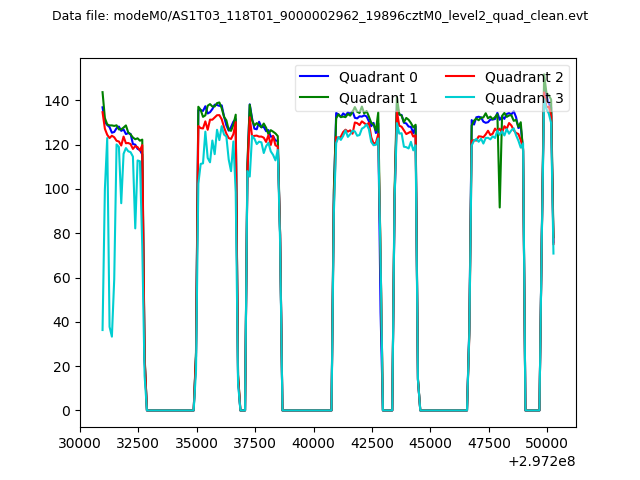 |
|
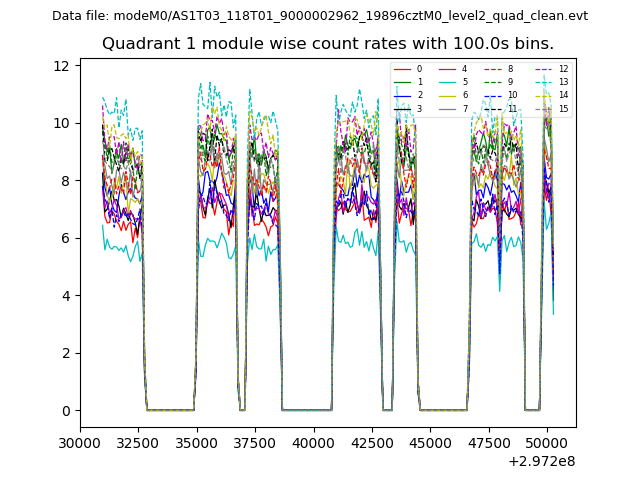
| Module-wise count rates for Quadrant A Data is divided into 100 sec bins |
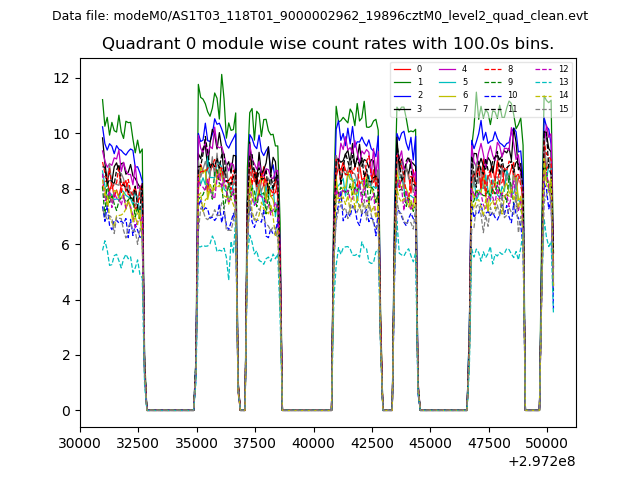 |
 |
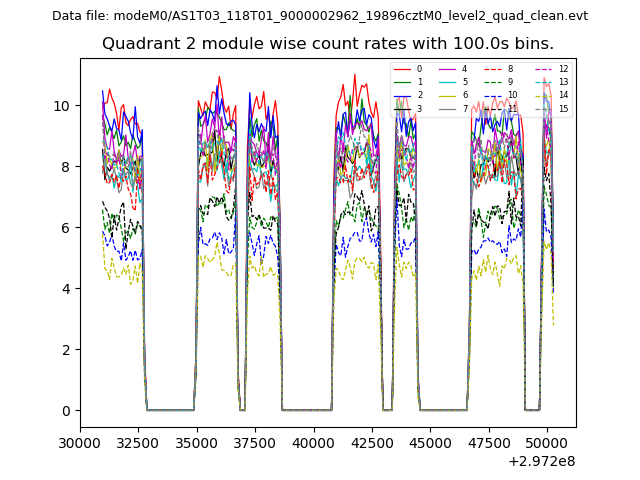
| Module-wise count rates for Quadrant B Data is divided into 100 sec bins |
 |
 |
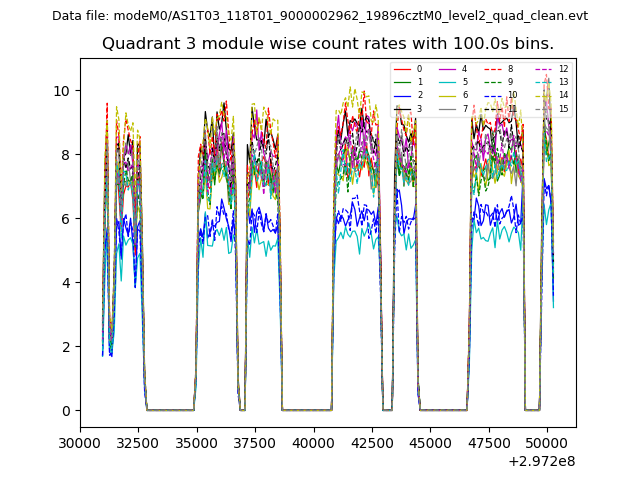
| Module-wise count rates for Quadrant C Data is divided into 100 sec bins |
 |
 |
| Module-wise count rates for Quadrant D Data is divided into 100 sec bins |
 |
 |
| Parameter | Plot |
|---|---|
| CZT HV Monitor | 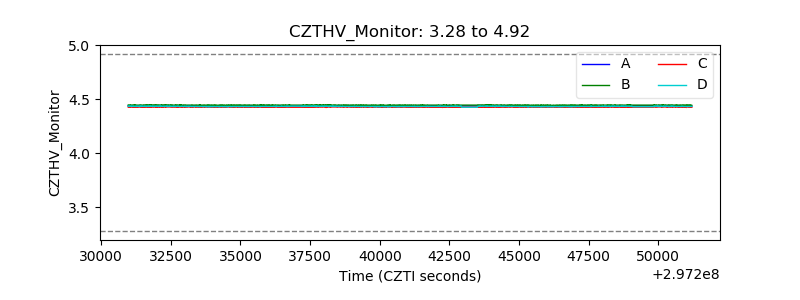 |
| D_VDD |  |
| Temperature 1 | 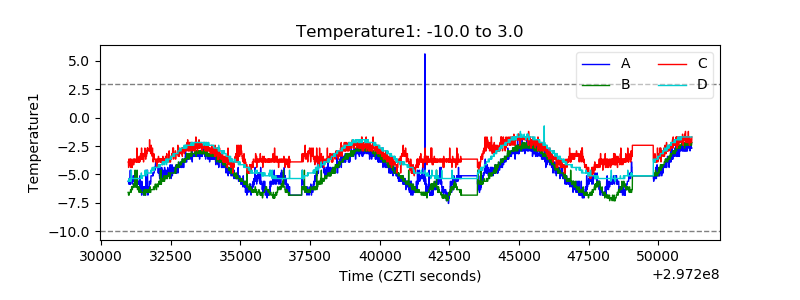 |
| Veto HV Monitor | 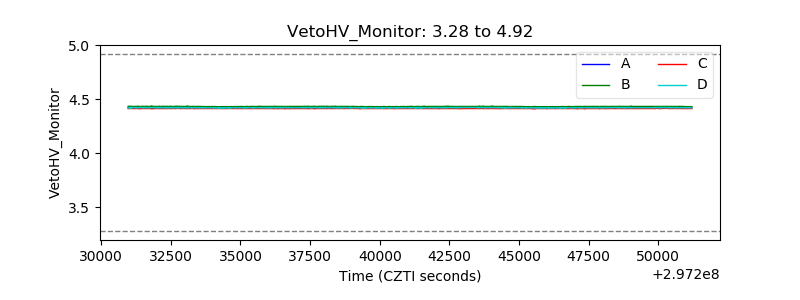 |
| Veto LLD |  |
| Alpha Counter | 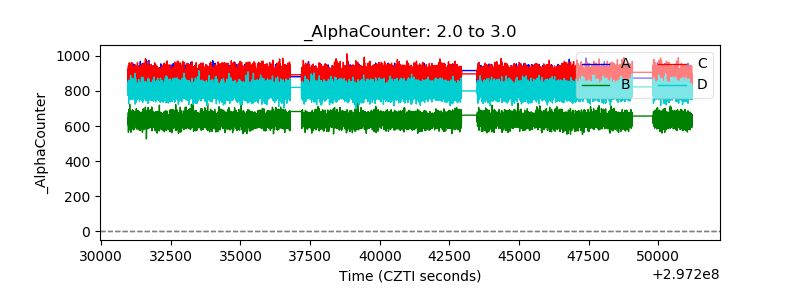 |
| _CPM_Rate | 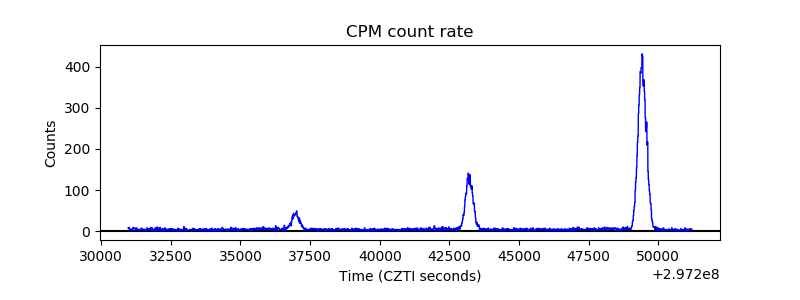 |
| CZT Counter | 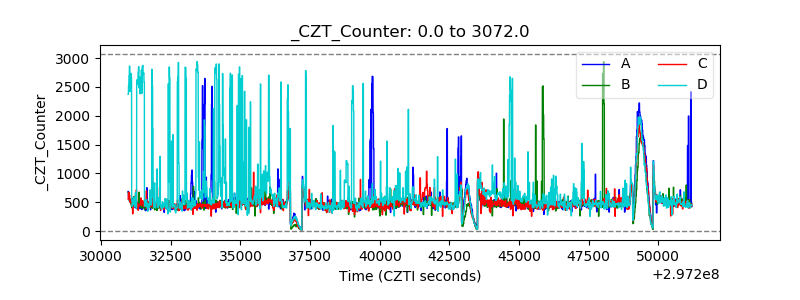 |
| +2.5 Volts monitor | 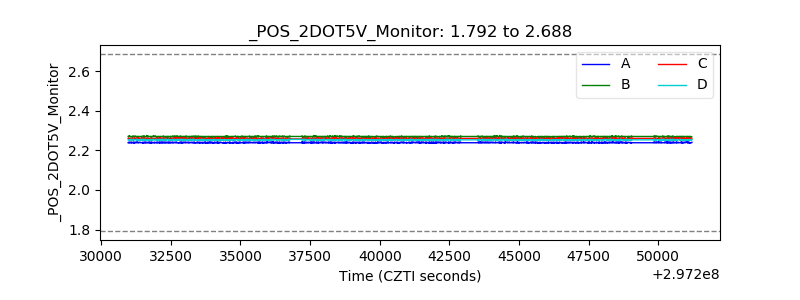 |
| +5 Volts monitor |  |
| _ROLL_ROT | 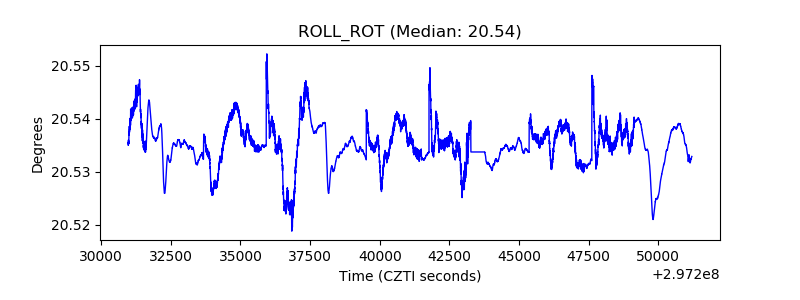 |
| _Roll_DEC | 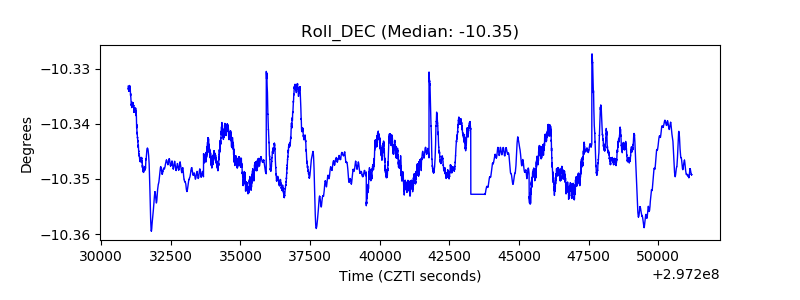 |
| _Roll_RA | 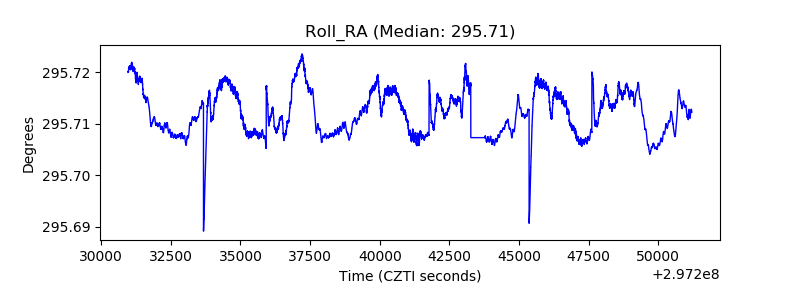 |
| Veto Counter | 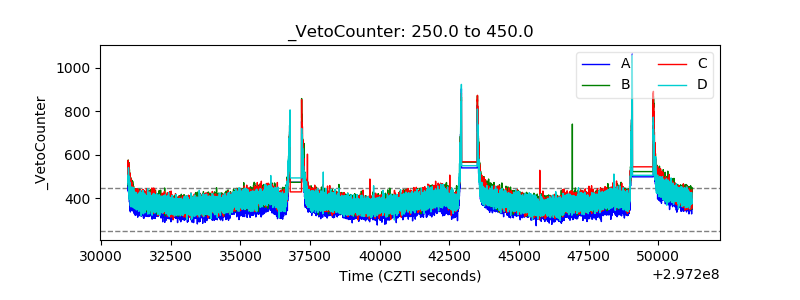 |