| Param | Original file | Final file |
|---|---|---|
| Filename | modeM0/AS1T03_118T01_9000002962_19897cztM0_level2.evt | modeM0/AS1T03_118T01_9000002962_19897cztM0_level2_quad_clean.evt |
| Size (bytes) | 512,406,720 | 70,047,360 |
| Size | 488.7 MB | 66.8 MB |
| Events in quadrant A | 4,646,861 | 422,076 |
| Events in quadrant B | 3,406,255 | 425,337 |
| Events in quadrant C | 3,290,617 | 404,464 |
| Events in quadrant D | 3,716,248 | 398,480 |
| Mode SS | |||
|---|---|---|---|
| Quadrant | BADHDUFLAG | Total packets | Discarded packets |
| A | 0 | 136 | 0 |
| B | 0 | 136 | 0 |
| C | 0 | 136 | 0 |
| D | 0 | 136 | 0 |
| Mode M9 | |||
|---|---|---|---|
| Quadrant | BADHDUFLAG | Total packets | Discarded packets |
| A | 0 | 13 | 0 |
| B | 0 | 14 | 0 |
| C | 0 | 14 | 0 |
| D | 0 | 14 | 0 |
| Mode M0 | |||
|---|---|---|---|
| Quadrant | BADHDUFLAG | Total packets | Discarded packets |
| A | 0 | 18028 | 2 |
| B | 0 | 14276 | 2 |
| C | 0 | 13940 | 2 |
| D | 0 | 15331 | 2 |
| Quadrant | Total seconds | Saturated seconds | Saturation percentage |
|---|---|---|---|
| A | 6754 | 466 | 6.899615% |
| B | 6754 | 105 | 1.554634% |
| C | 6754 | 102 | 1.510216% |
| D | 6754 | 138 | 2.043234% |
Noise dominated data is calculated using 1-second bins in cleaned event files. If a bin has >2000 counts, and if more than 50% of those come from <1% of pixels, then it is considered to be noise-dominated and hence unusable.
| Quadrant | # 1 sec bins | Bins with >0 counts | Bins with >2000 counts | High rate bins dominated by noise | Noise dominated (total time) | Noise dominated (detector-on time) | Marked lightcurve |
|---|---|---|---|---|---|---|---|
| A | 7669 | 6754 | 346 | 346 | 4.51% | 5.12% |  |
| B | 7669 | 6754 | 3 | 3 | 0.04% | 0.04% | 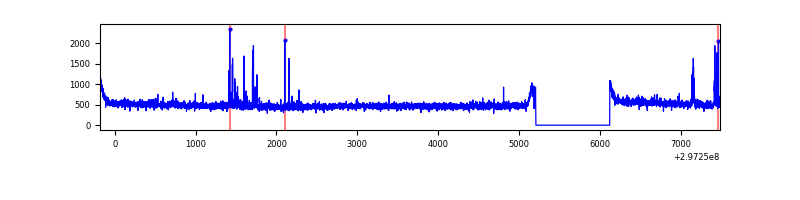 |
| C | 7669 | 6754 | 0 | 0 | 0.00% | 0.00% | 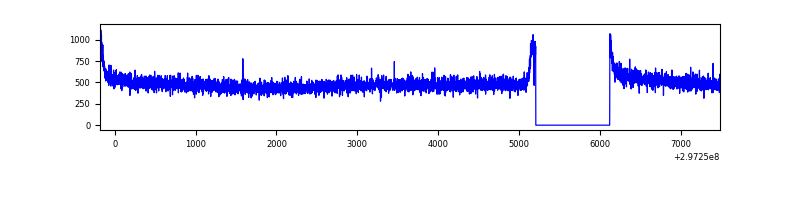 |
| D | 7669 | 6754 | 60 | 60 | 0.78% | 0.89% | 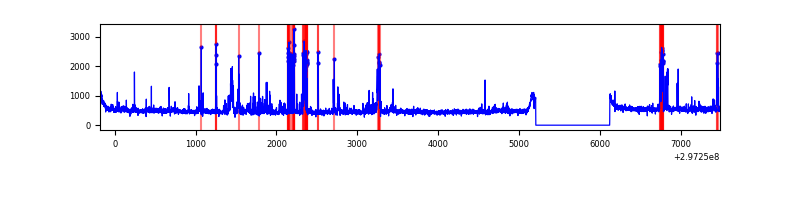 |
Top three noisy pixels from each quadrant. If the there are fewer than three noisy pixels in the level2.evt file, extra rows are filled as -1
| Pixel properties | Quadrant properties | ||||||
|---|---|---|---|---|---|---|---|
| Quadrant | DetID | PixID | Counts | Sigma | Mean | Median | Sigma |
| A | 5 | 16 | 1447173 | 8600.44 | 832 | 814 | 168.2 |
| A | 0 | 226 | 7108 | 37.43 | 832 | 814 | 168.2 |
| A | 3 | 137 | 6802 | 35.61 | 832 | 814 | 168.2 |
| B | 7 | 220 | 69007 | 419.08 | 842 | 820 | 162.7 |
| B | 12 | 111 | 19737 | 116.27 | 842 | 820 | 162.7 |
| B | 11 | 111 | 18069 | 106.01 | 842 | 820 | 162.7 |
| C | 14 | 238 | 127779 | 664.0 | 810 | 814 | 191.2 |
| C | 13 | 61 | 5541 | 24.72 | 810 | 814 | 191.2 |
| C | 7 | 220 | 3286 | 12.93 | 810 | 814 | 191.2 |
| D | 12 | 218 | 173938 | 865.59 | 826 | 803 | 200.0 |
| D | 1 | 52 | 171174 | 851.77 | 826 | 803 | 200.0 |
| D | 1 | 20 | 122227 | 607.06 | 826 | 803 | 200.0 |
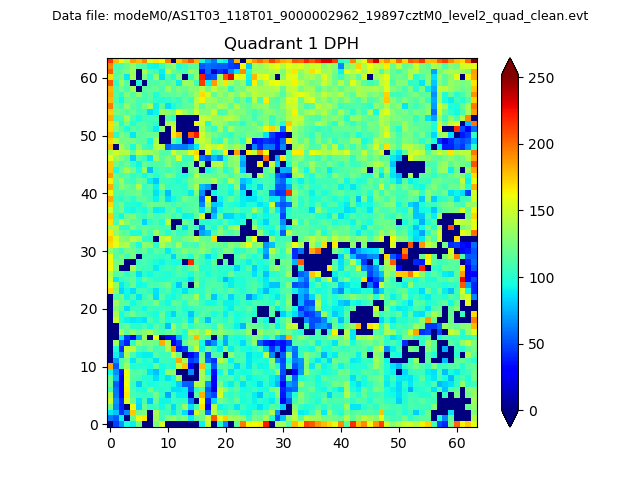
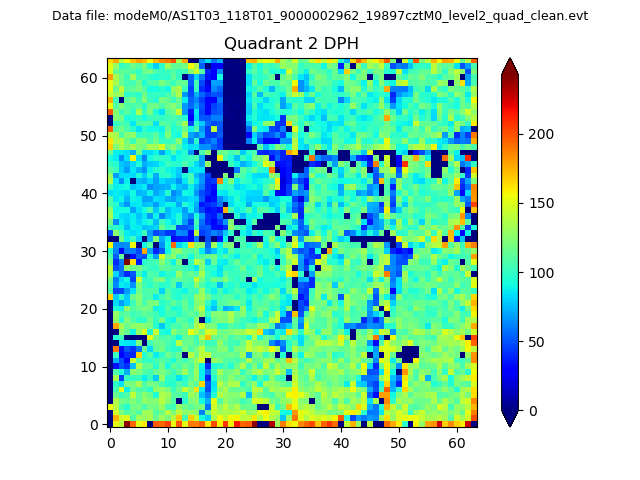
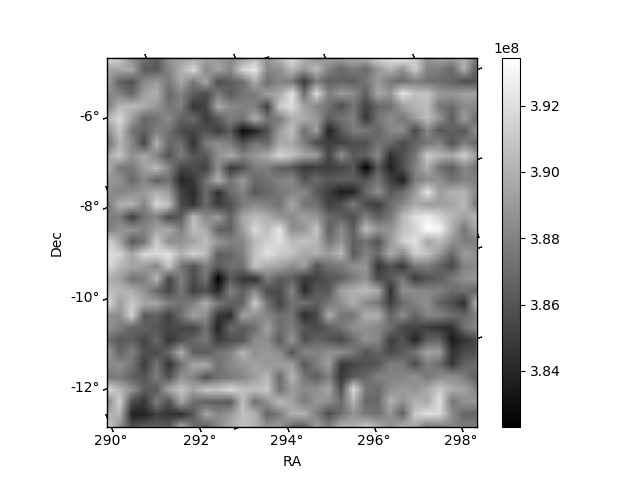
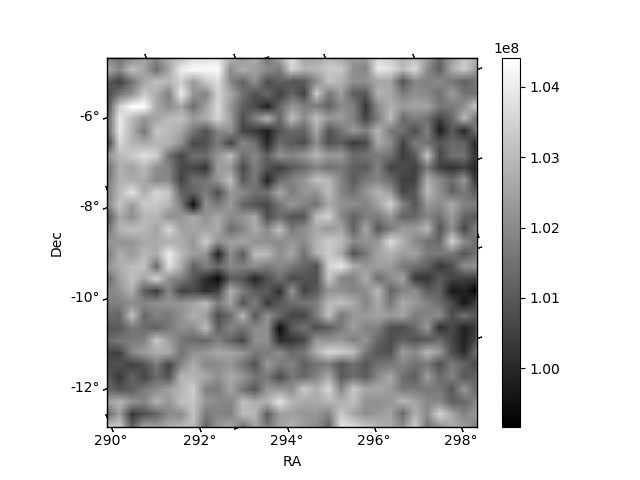
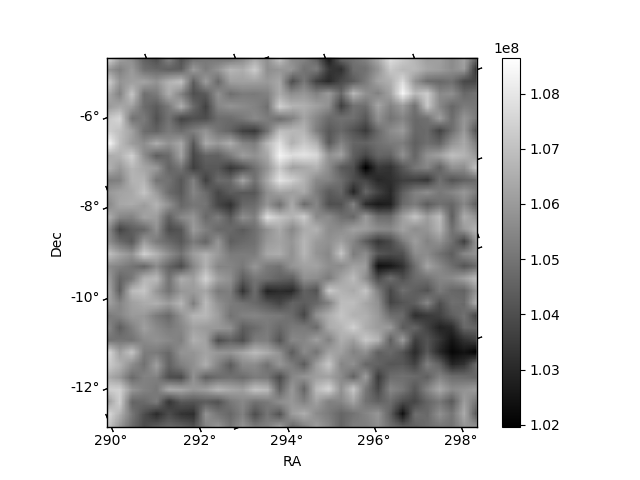
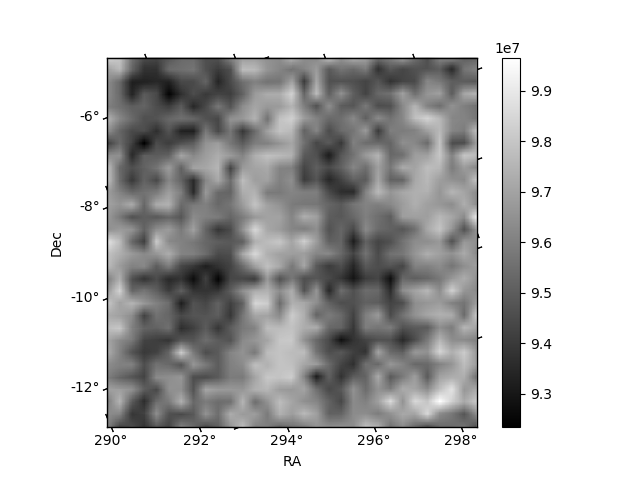
Histogram calculated using DETX and DETY for each event in the final _common_clean file
| Quadrant A | 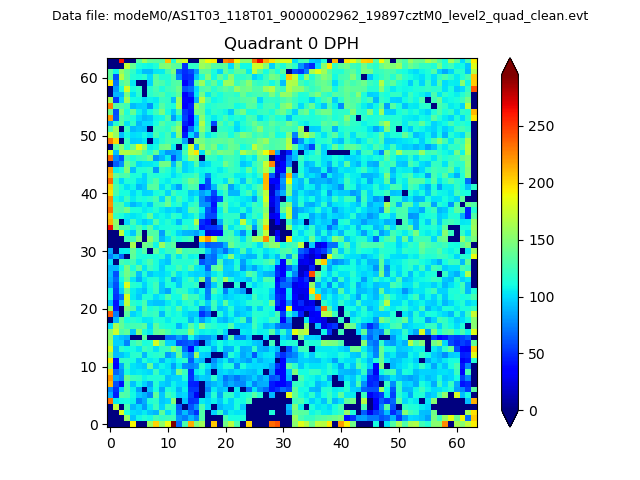 |
 |
Quadrant B |
|---|---|---|---|
| Quadrant D | 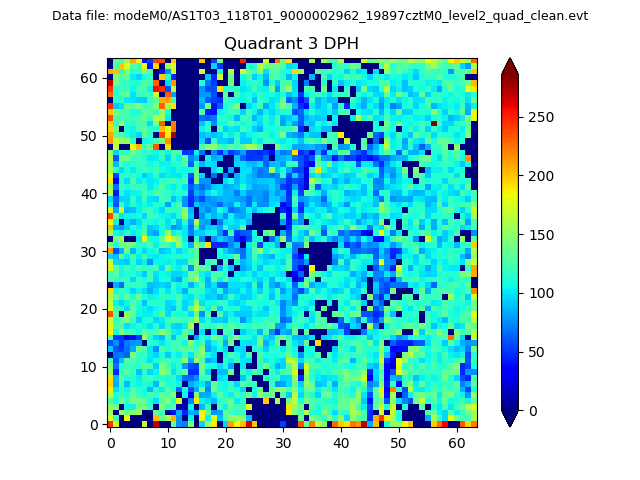 |
 |
Quadrant C |
| Plot type | Count rate plots | Images |
|---|---|---|
| Comparison with Poisson distribution Blue bars denote a histogram of data divided into 1 sec bins. Red curve is a Poisson curve with rate = median count rate of data. |
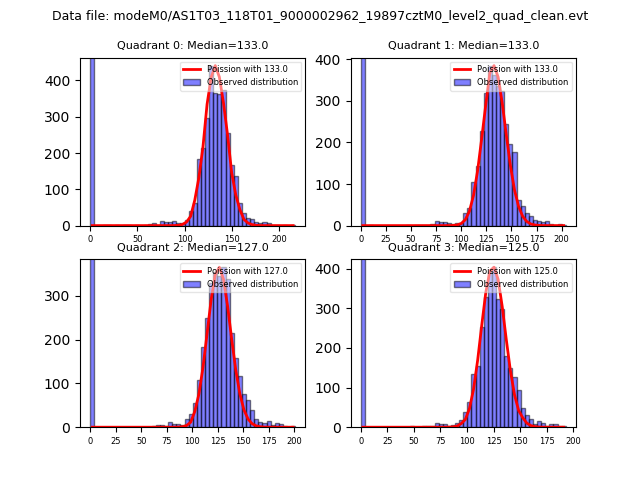 |
 |
| Quadrant-wise count rates Data is divided into 100 sec bins |
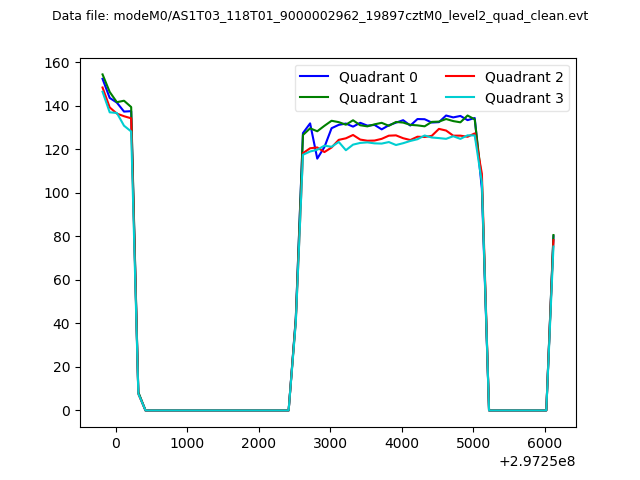 |
|
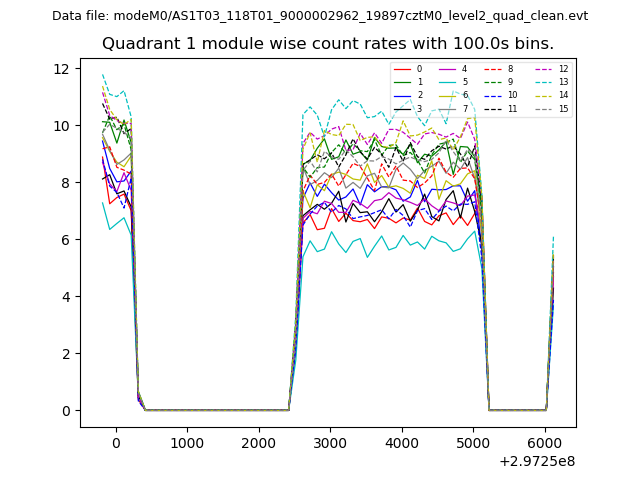
| Module-wise count rates for Quadrant A Data is divided into 100 sec bins |
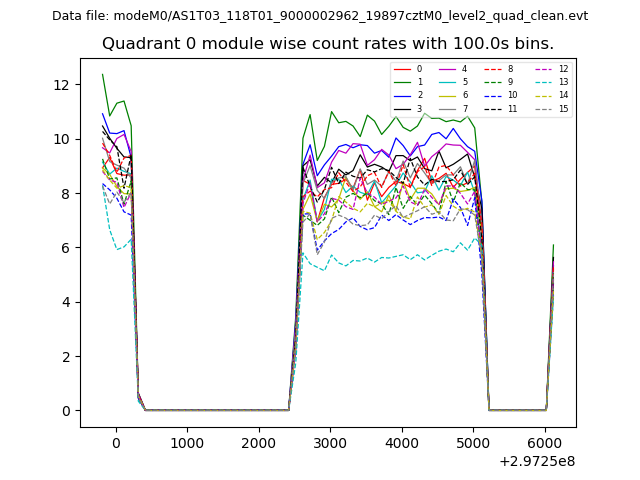 |
 |
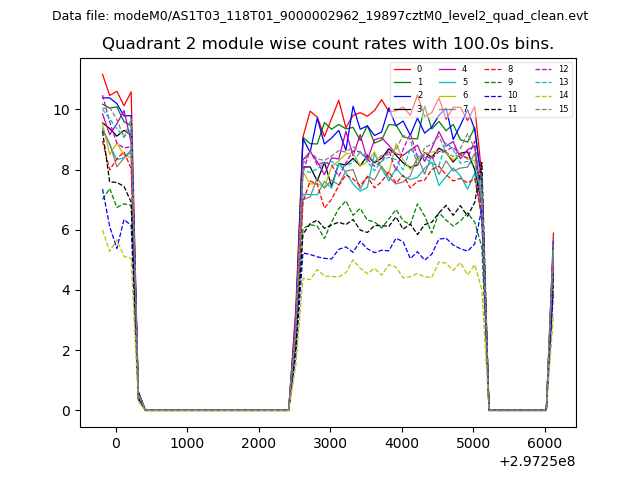
| Module-wise count rates for Quadrant B Data is divided into 100 sec bins |
 |
 |
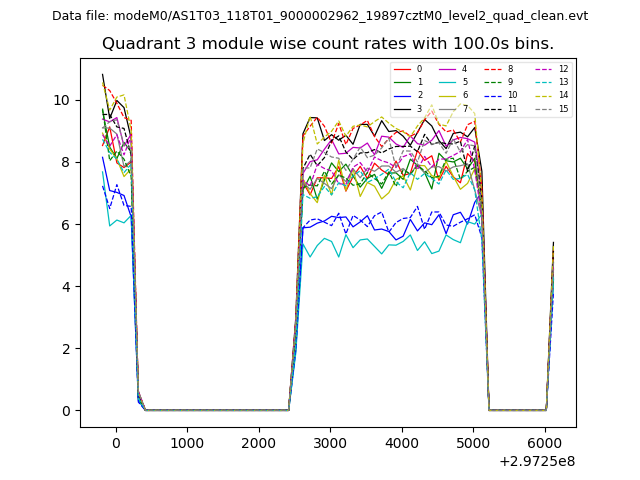
| Module-wise count rates for Quadrant C Data is divided into 100 sec bins |
 |
 |
| Module-wise count rates for Quadrant D Data is divided into 100 sec bins |
 |
 |
| Parameter | Plot |
|---|---|
| CZT HV Monitor | 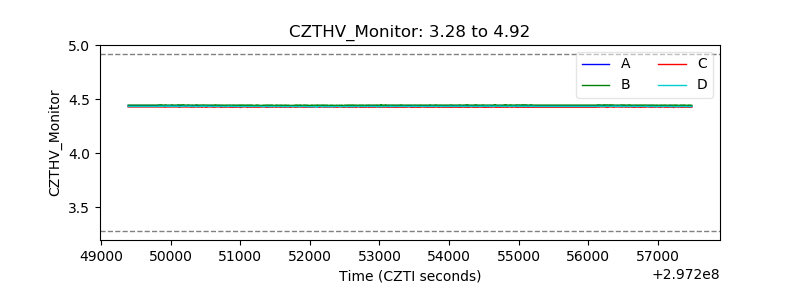 |
| D_VDD | 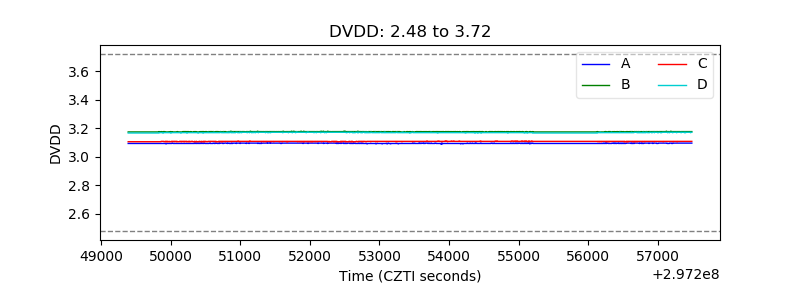 |
| Temperature 1 | 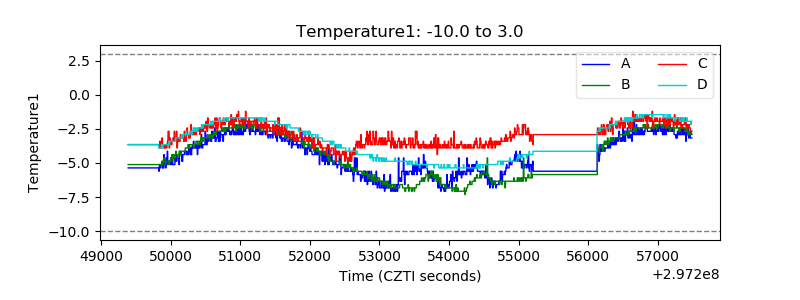 |
| Veto HV Monitor | 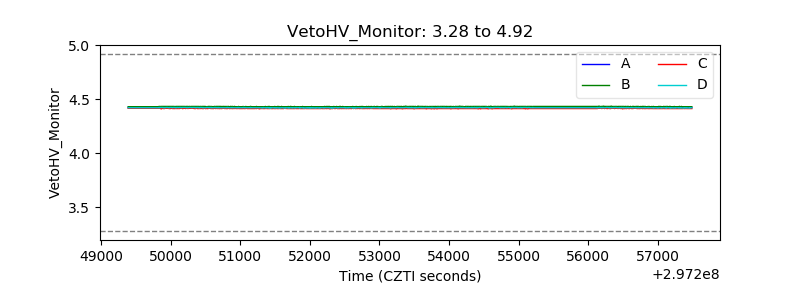 |
| Veto LLD | 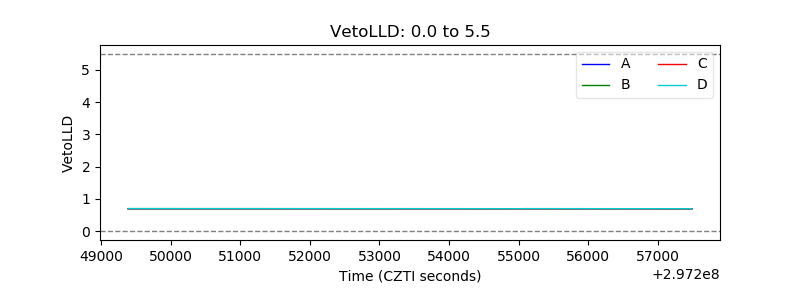 |
| Alpha Counter | 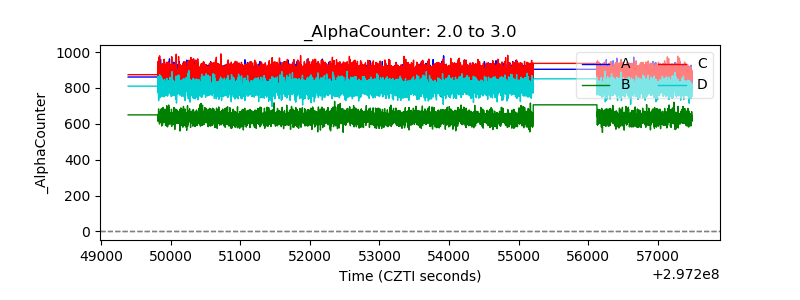 |
| _CPM_Rate | 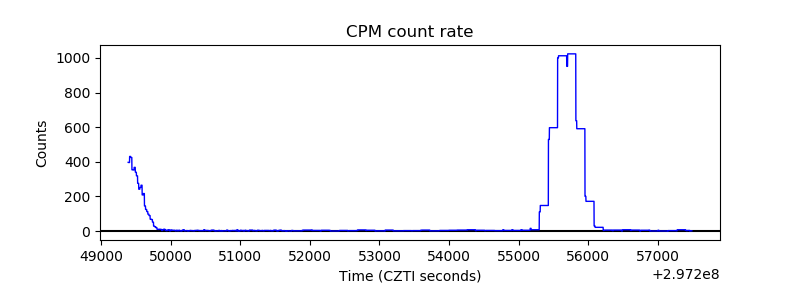 |
| CZT Counter | 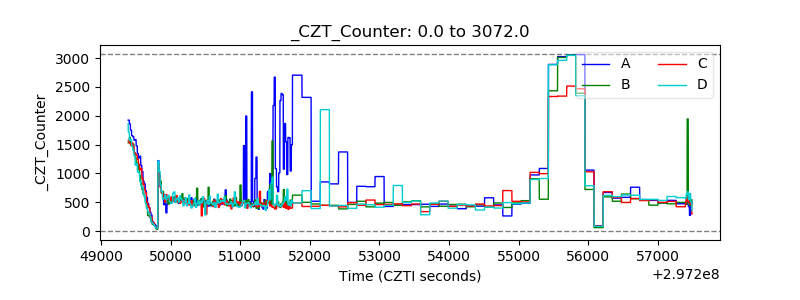 |
| +2.5 Volts monitor |  |
| +5 Volts monitor |  |
| _ROLL_ROT | 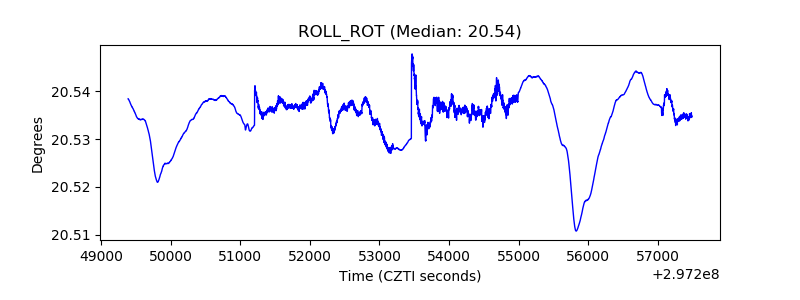 |
| _Roll_DEC | 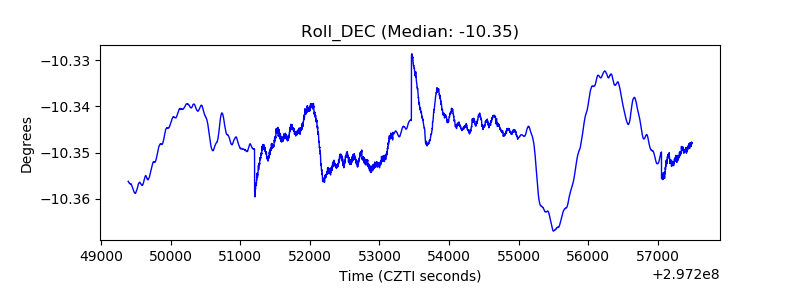 |
| _Roll_RA | 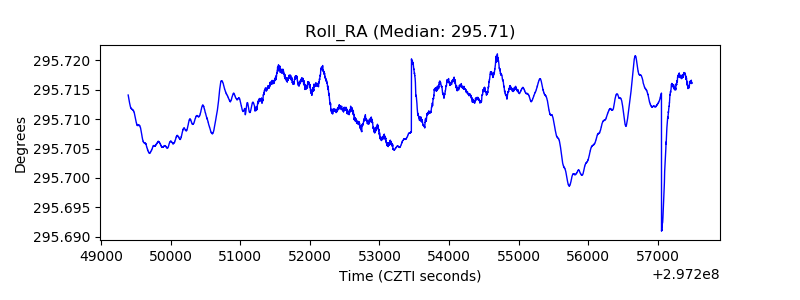 |
| Veto Counter | 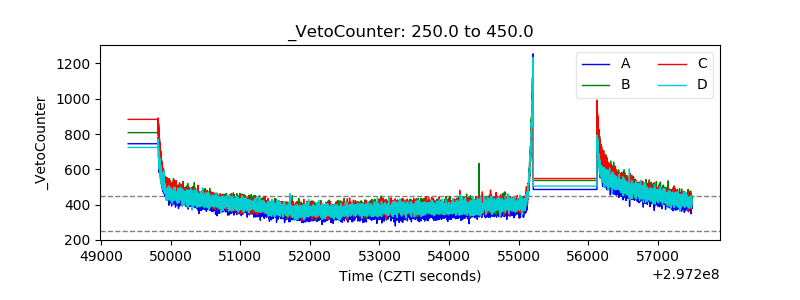 |