| Param | Original file | Final file |
|---|---|---|
| Filename | modeM0/AS1T03_118T01_9000002962_19900cztM0_level2.evt | modeM0/AS1T03_118T01_9000002962_19900cztM0_level2_quad_clean.evt |
| Size (bytes) | 489,833,280 | 71,447,040 |
| Size | 467.1 MB | 68.1 MB |
| Events in quadrant A | 3,299,597 | 445,887 |
| Events in quadrant B | 3,460,206 | 444,085 |
| Events in quadrant C | 3,444,087 | 421,792 |
| Events in quadrant D | 4,204,134 | 412,643 |
| Mode SS | |||
|---|---|---|---|
| Quadrant | BADHDUFLAG | Total packets | Discarded packets |
| A | 0 | 130 | 0 |
| B | 0 | 130 | 0 |
| C | 0 | 130 | 0 |
| D | 0 | 130 | 0 |
| Mode M9 | |||
|---|---|---|---|
| Quadrant | BADHDUFLAG | Total packets | Discarded packets |
| A | 0 | 22 | 0 |
| B | 0 | 23 | 0 |
| C | 0 | 23 | 0 |
| D | 0 | 23 | 0 |
| Mode M0 | |||
|---|---|---|---|
| Quadrant | BADHDUFLAG | Total packets | Discarded packets |
| A | 0 | 13842 | 2 |
| B | 0 | 14351 | 2 |
| C | 0 | 14254 | 2 |
| D | 0 | 16672 | 2 |
| Quadrant | Total seconds | Saturated seconds | Saturation percentage |
|---|---|---|---|
| A | 6286 | 57 | 0.906777% |
| B | 6286 | 85 | 1.352211% |
| C | 6286 | 81 | 1.288578% |
| D | 6286 | 183 | 2.911231% |
Noise dominated data is calculated using 1-second bins in cleaned event files. If a bin has >2000 counts, and if more than 50% of those come from <1% of pixels, then it is considered to be noise-dominated and hence unusable.
| Quadrant | # 1 sec bins | Bins with >0 counts | Bins with >2000 counts | High rate bins dominated by noise | Noise dominated (total time) | Noise dominated (detector-on time) | Marked lightcurve |
|---|---|---|---|---|---|---|---|
| A | 7491 | 6286 | 4 | 4 | 0.05% | 0.06% | 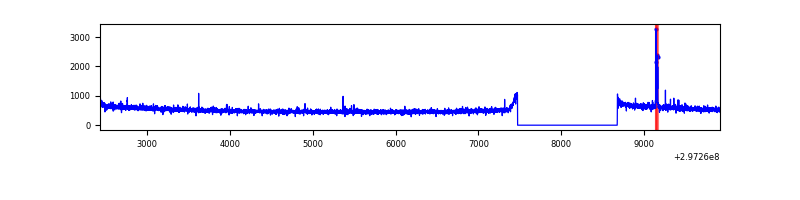 |
| B | 7491 | 6286 | 23 | 23 | 0.31% | 0.37% | 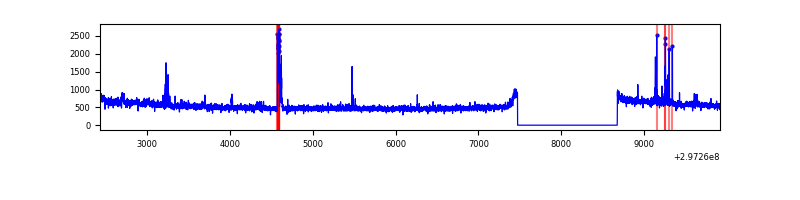 |
| C | 7491 | 6286 | 2 | 2 | 0.03% | 0.03% | 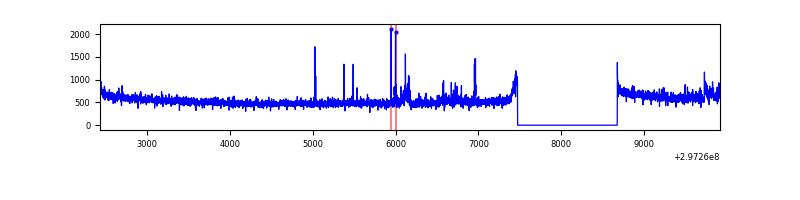 |
| D | 7491 | 6286 | 125 | 125 | 1.67% | 1.99% | 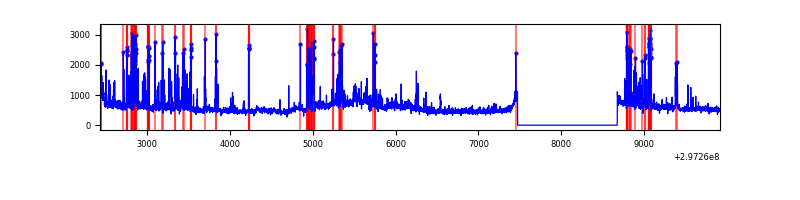 |
Top three noisy pixels from each quadrant. If the there are fewer than three noisy pixels in the level2.evt file, extra rows are filled as -1
| Pixel properties | Quadrant properties | ||||||
|---|---|---|---|---|---|---|---|
| Quadrant | DetID | PixID | Counts | Sigma | Mean | Median | Sigma |
| A | 5 | 16 | 39833 | 229.66 | 845 | 829 | 169.8 |
| A | 0 | 226 | 7473 | 39.12 | 845 | 829 | 169.8 |
| A | 14 | 238 | 6476 | 33.25 | 845 | 829 | 169.8 |
| B | 0 | 182 | 63885 | 401.05 | 840 | 823 | 157.2 |
| B | 7 | 220 | 55490 | 347.66 | 840 | 823 | 157.2 |
| B | 12 | 111 | 18611 | 113.12 | 840 | 823 | 157.2 |
| C | 9 | 221 | 151764 | 808.46 | 808 | 814 | 186.7 |
| C | 14 | 238 | 129773 | 690.68 | 808 | 814 | 186.7 |
| C | 7 | 220 | 9981 | 49.1 | 808 | 814 | 186.7 |
| D | 1 | 20 | 330096 | 1694.94 | 812 | 791 | 194.3 |
| D | 12 | 218 | 298126 | 1530.39 | 812 | 791 | 194.3 |
| D | 5 | 222 | 217114 | 1113.42 | 812 | 791 | 194.3 |
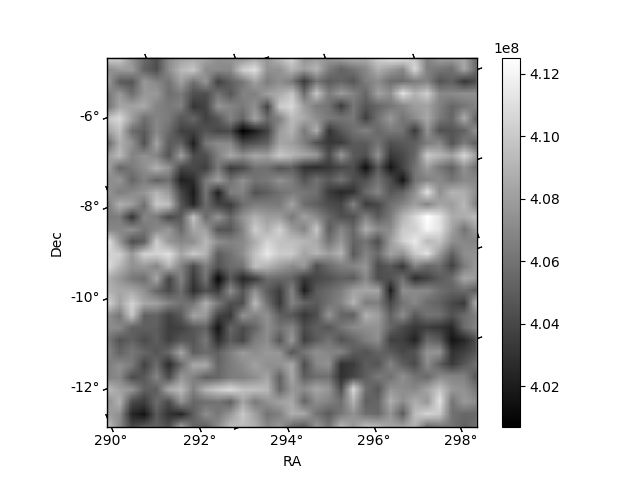
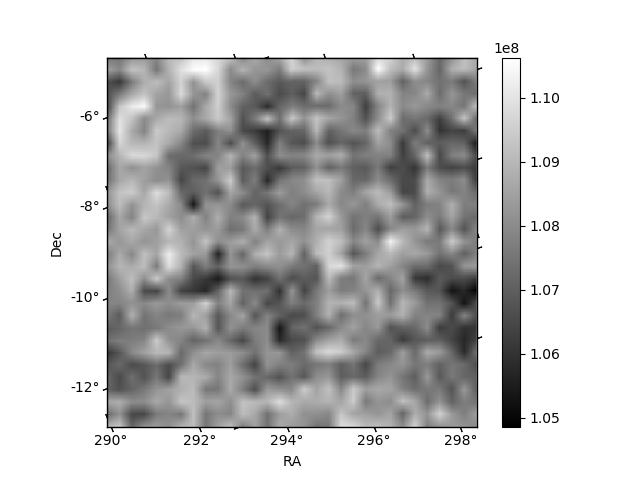
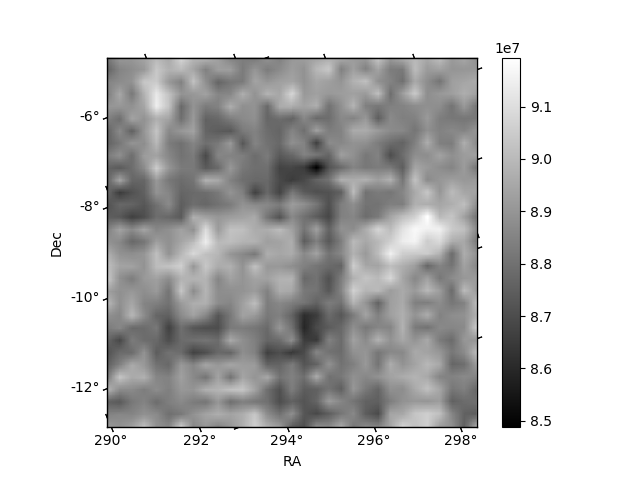
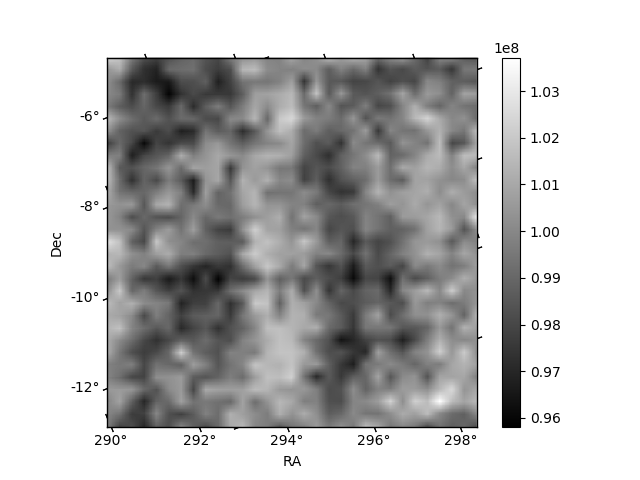
Histogram calculated using DETX and DETY for each event in the final _common_clean file
| Quadrant A | 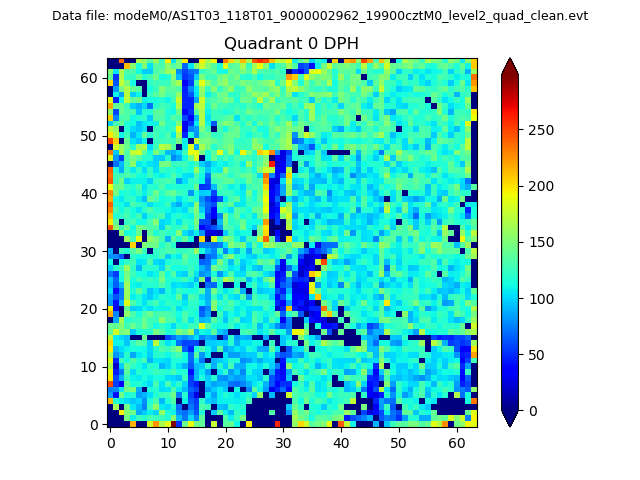 |
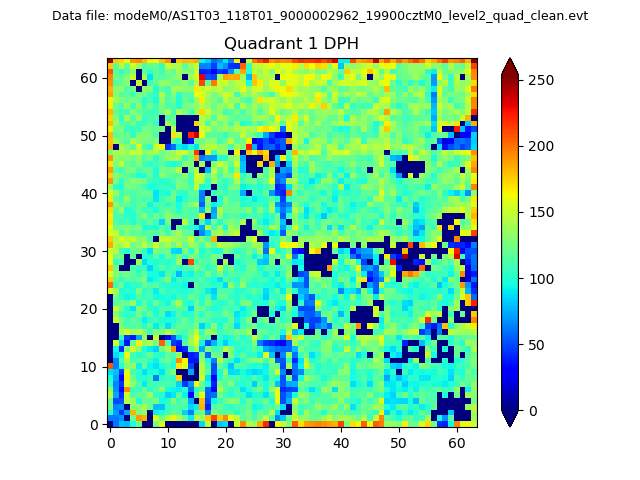 |
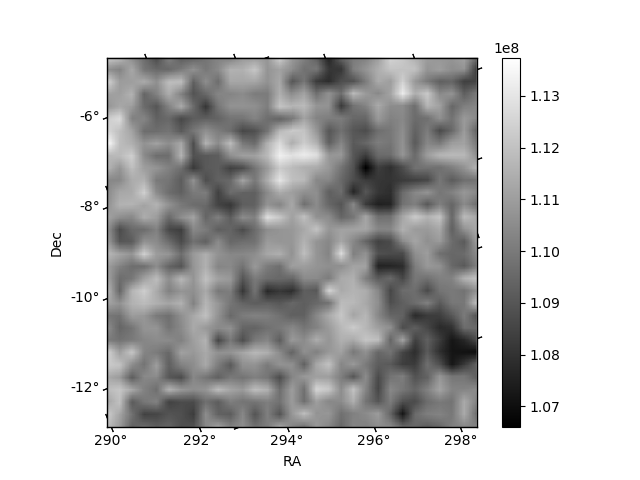
Quadrant B |
|---|---|---|---|
| Quadrant D | 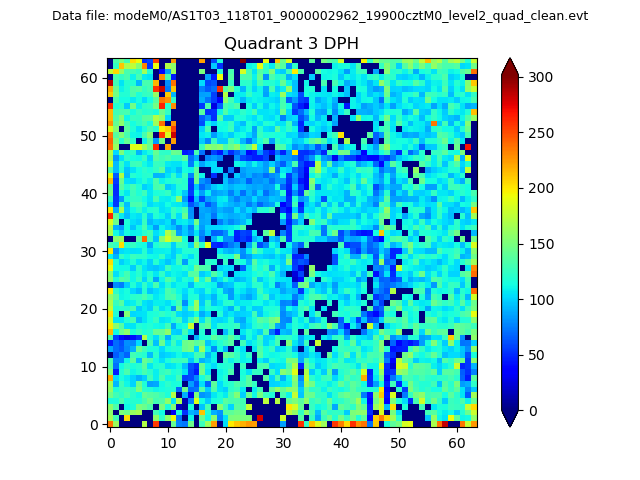 |
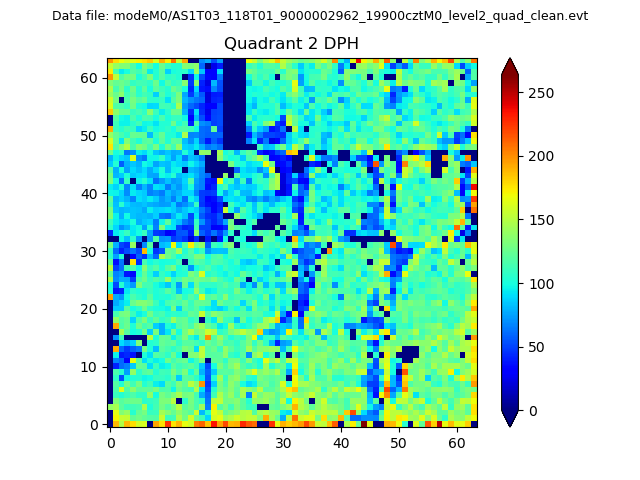 |
Quadrant C |
| Plot type | Count rate plots | Images |
|---|---|---|
| Comparison with Poisson distribution Blue bars denote a histogram of data divided into 1 sec bins. Red curve is a Poisson curve with rate = median count rate of data. |
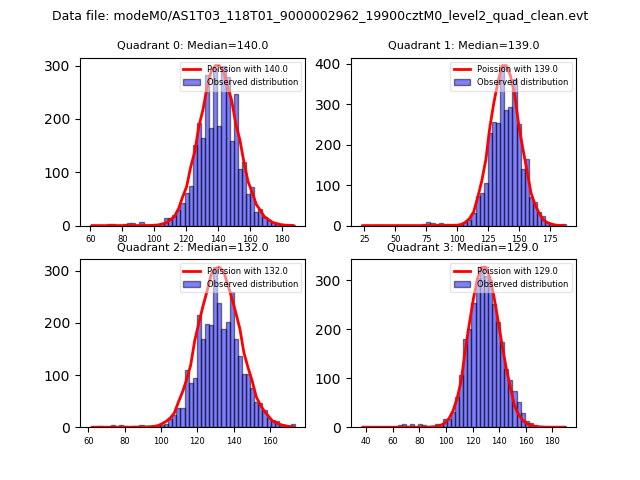 |
 |
| Quadrant-wise count rates Data is divided into 100 sec bins |
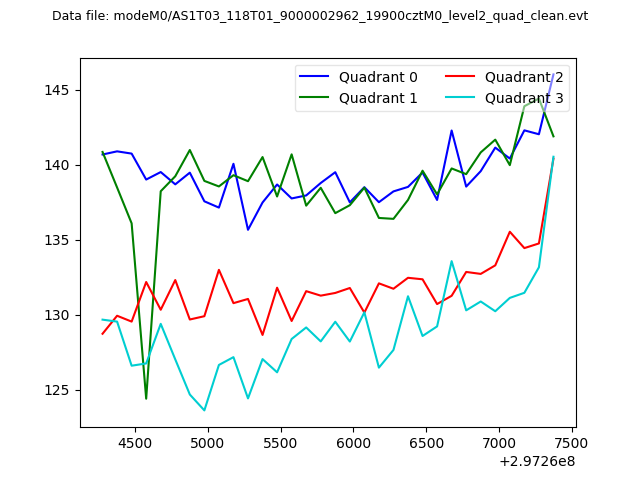 |
|
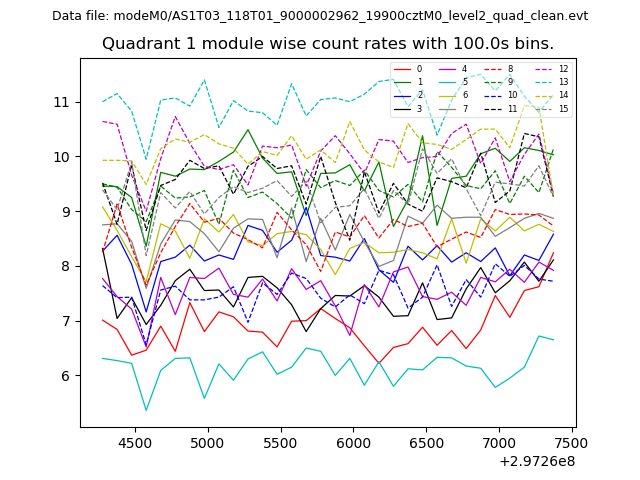
| Module-wise count rates for Quadrant A Data is divided into 100 sec bins |
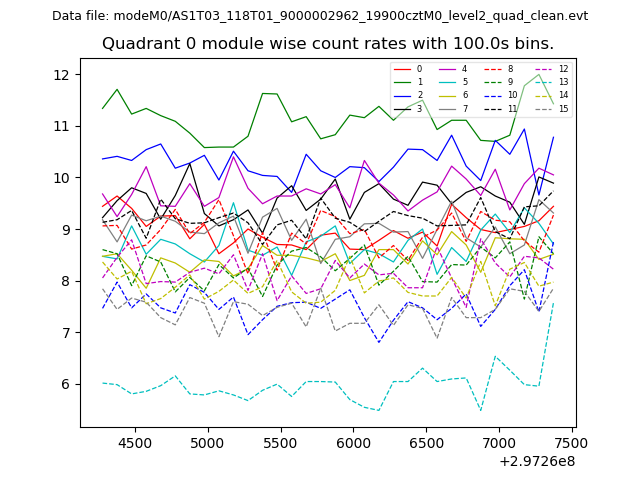 |
 |
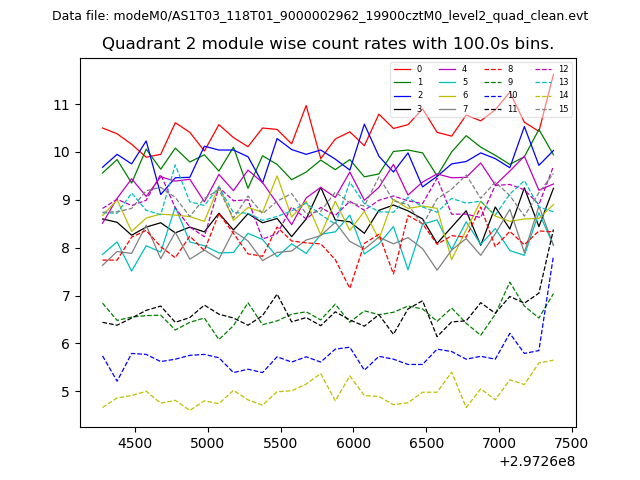
| Module-wise count rates for Quadrant B Data is divided into 100 sec bins |
 |
 |
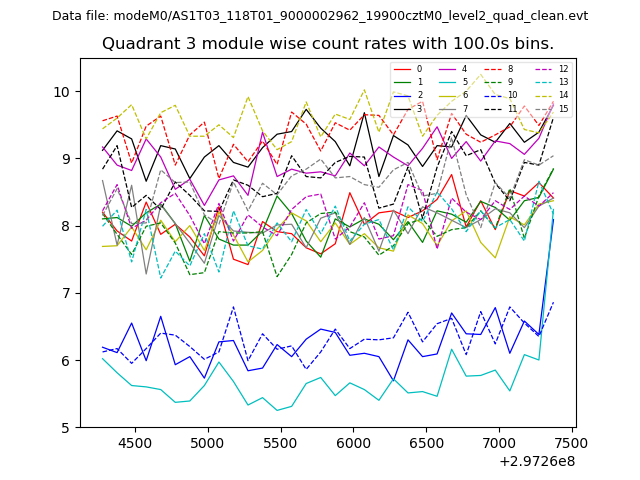
| Module-wise count rates for Quadrant C Data is divided into 100 sec bins |
 |
 |
| Module-wise count rates for Quadrant D Data is divided into 100 sec bins |
 |
 |
| Parameter | Plot |
|---|---|
| CZT HV Monitor | 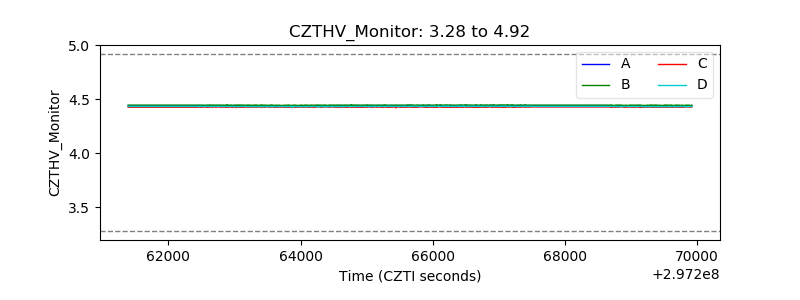 |
| D_VDD | 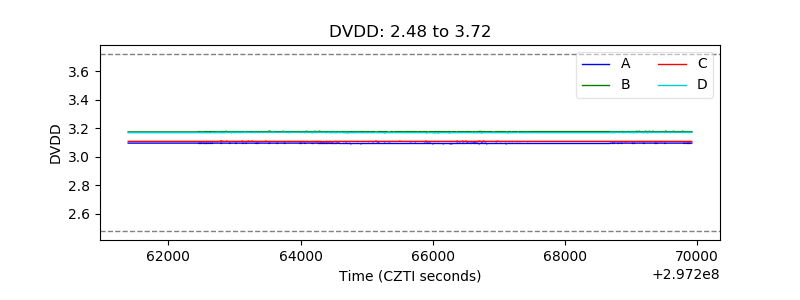 |
| Temperature 1 | 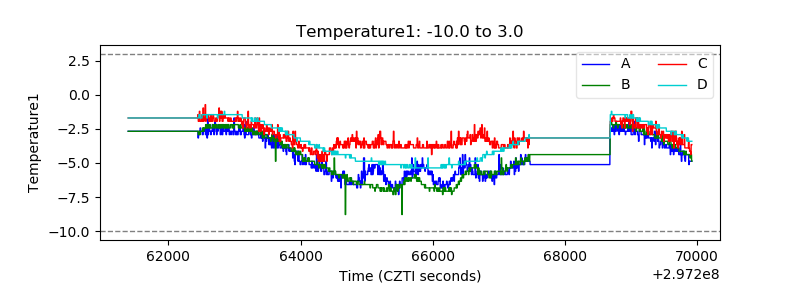 |
| Veto HV Monitor | 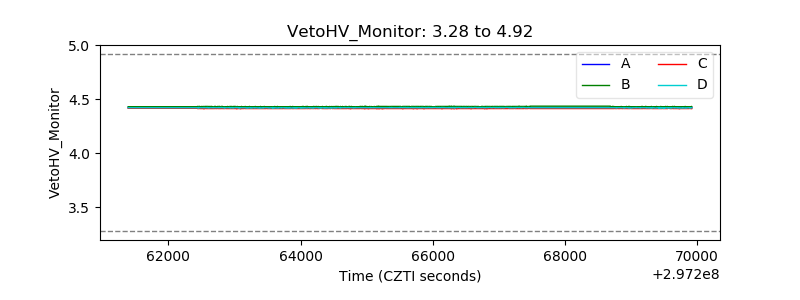 |
| Veto LLD | 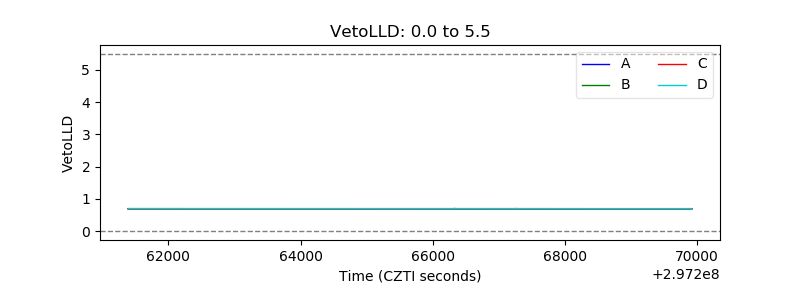 |
| Alpha Counter | 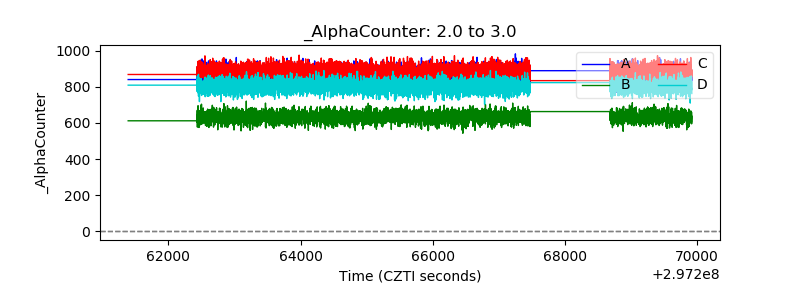 |
| _CPM_Rate | 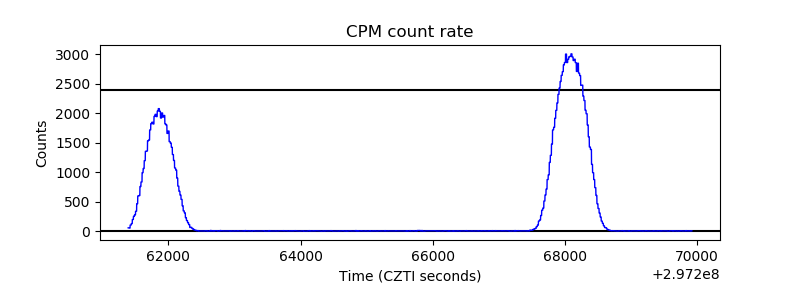 |
| CZT Counter | 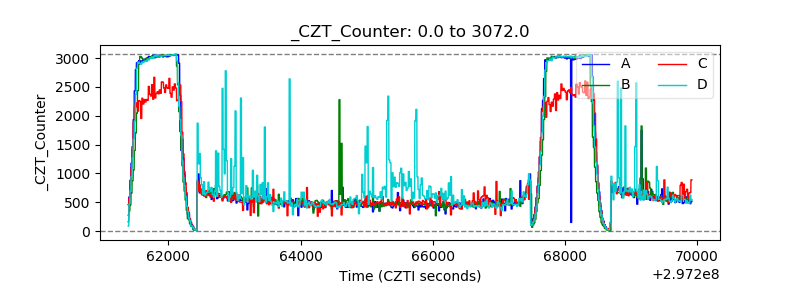 |
| +2.5 Volts monitor | 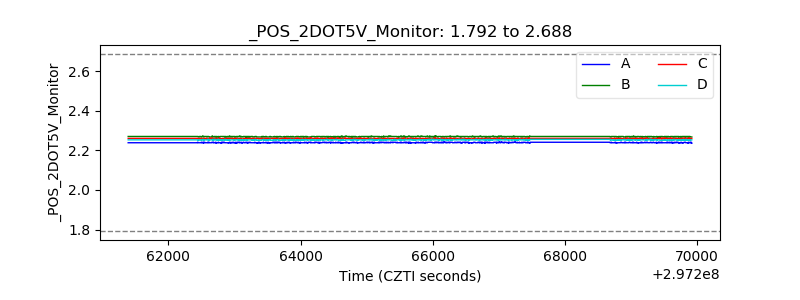 |
| +5 Volts monitor | 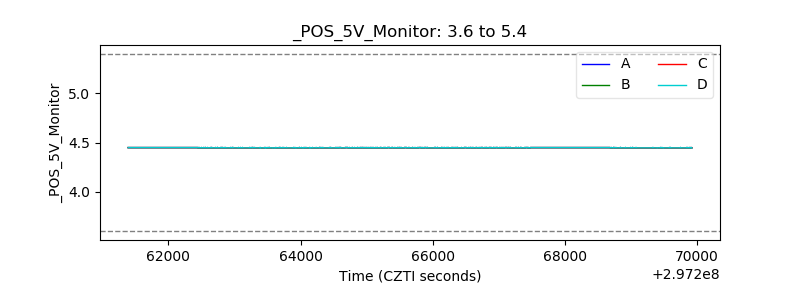 |
| _ROLL_ROT | 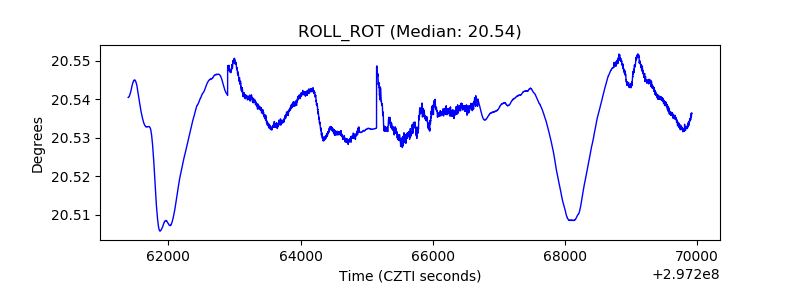 |
| _Roll_DEC | 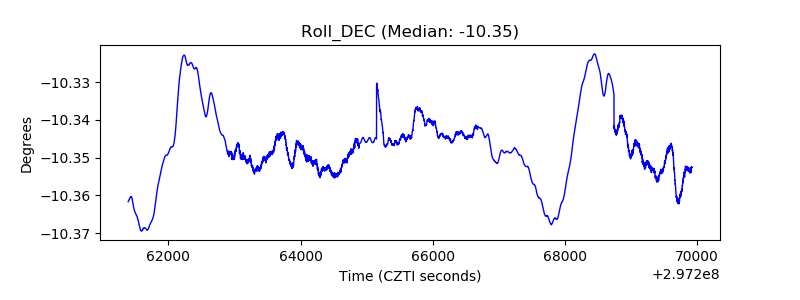 |
| _Roll_RA | 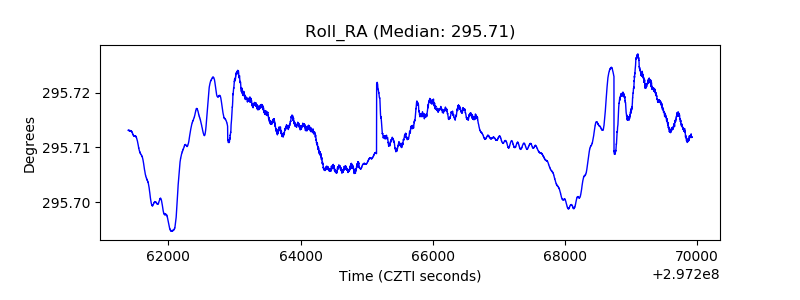 |
| Veto Counter | 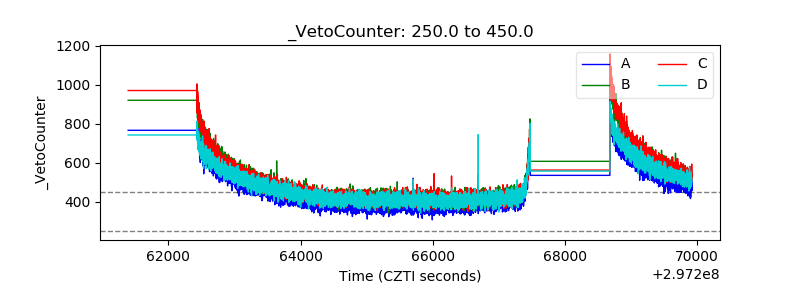 |