| Param | Original file | Final file |
|---|---|---|
| Filename | modeM0/AS1T03_118T01_9000002962_19901cztM0_level2.evt | modeM0/AS1T03_118T01_9000002962_19901cztM0_level2_quad_clean.evt |
| Size (bytes) | 250,053,120 | 33,073,920 |
| Size | 238.5 MB | 31.5 MB |
| Events in quadrant A | 1,554,365 | 208,702 |
| Events in quadrant B | 1,610,789 | 211,260 |
| Events in quadrant C | 2,087,724 | 190,117 |
| Events in quadrant D | 2,124,451 | 186,861 |
| Mode SS | |||
|---|---|---|---|
| Quadrant | BADHDUFLAG | Total packets | Discarded packets |
| A | 0 | 58 | 0 |
| B | 0 | 58 | 0 |
| C | 0 | 58 | 0 |
| D | 0 | 58 | 0 |
| Mode M9 | |||
|---|---|---|---|
| Quadrant | BADHDUFLAG | Total packets | Discarded packets |
| A | 0 | 3 | 0 |
| B | 0 | 4 | 0 |
| C | 0 | 4 | 0 |
| D | 0 | 4 | 0 |
| Mode M0 | |||
|---|---|---|---|
| Quadrant | BADHDUFLAG | Total packets | Discarded packets |
| A | 0 | 6446 | 1 |
| B | 0 | 6584 | 1 |
| C | 0 | 8257 | 1 |
| D | 0 | 8103 | 1 |
| Quadrant | Total seconds | Saturated seconds | Saturation percentage |
|---|---|---|---|
| A | 2853 | 20 | 0.701016% |
| B | 2853 | 16 | 0.560813% |
| C | 2853 | 173 | 6.063792% |
| D | 2853 | 148 | 5.187522% |
Noise dominated data is calculated using 1-second bins in cleaned event files. If a bin has >2000 counts, and if more than 50% of those come from <1% of pixels, then it is considered to be noise-dominated and hence unusable.
| Quadrant | # 1 sec bins | Bins with >0 counts | Bins with >2000 counts | High rate bins dominated by noise | Noise dominated (total time) | Noise dominated (detector-on time) | Marked lightcurve |
|---|---|---|---|---|---|---|---|
| A | 2853 | 2853 | 4 | 4 | 0.14% | 0.14% | 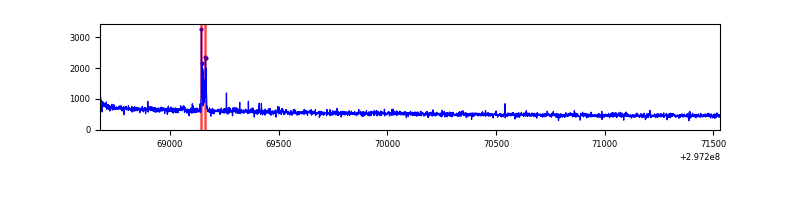 |
| B | 2853 | 2853 | 6 | 6 | 0.21% | 0.21% | 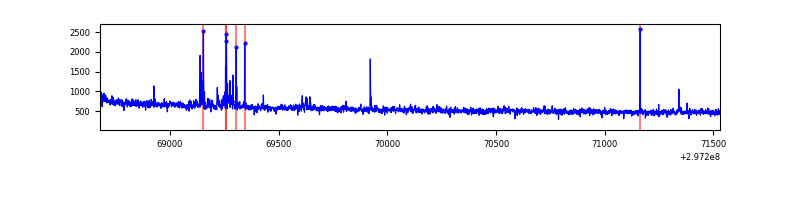 |
| C | 2853 | 2853 | 84 | 84 | 2.94% | 2.94% | 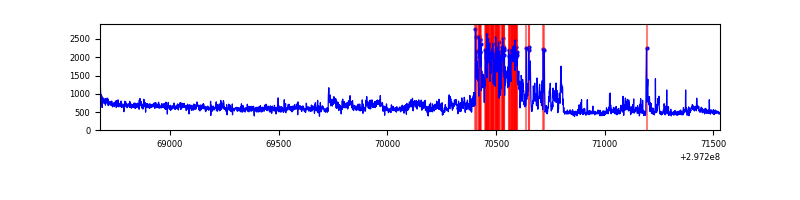 |
| D | 2853 | 2853 | 149 | 149 | 5.22% | 5.22% | 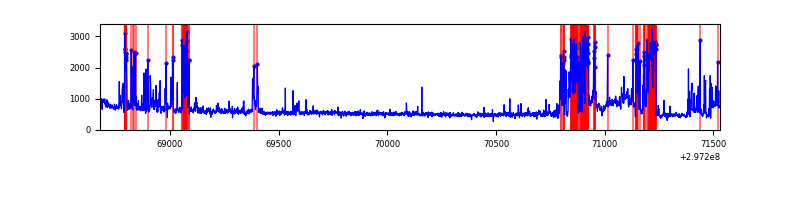 |
Top three noisy pixels from each quadrant. If the there are fewer than three noisy pixels in the level2.evt file, extra rows are filled as -1
| Pixel properties | Quadrant properties | ||||||
|---|---|---|---|---|---|---|---|
| Quadrant | DetID | PixID | Counts | Sigma | Mean | Median | Sigma |
| A | 5 | 16 | 32820 | 407.13 | 393 | 387 | 79.7 |
| A | 14 | 238 | 5181 | 60.18 | 393 | 387 | 79.7 |
| A | 0 | 226 | 3496 | 39.03 | 393 | 387 | 79.7 |
| B | 7 | 220 | 37605 | 499.49 | 395 | 387 | 74.5 |
| B | 0 | 190 | 9628 | 124.02 | 395 | 387 | 74.5 |
| B | 12 | 111 | 8361 | 107.02 | 395 | 387 | 74.5 |
| C | 9 | 221 | 566592 | 6483.56 | 374 | 376 | 87.3 |
| C | 14 | 238 | 60203 | 685.06 | 374 | 376 | 87.3 |
| C | 13 | 61 | 2675 | 26.33 | 374 | 376 | 87.3 |
| D | 1 | 52 | 388980 | 4250.7 | 375 | 366 | 91.4 |
| D | 12 | 218 | 225909 | 2467.01 | 375 | 366 | 91.4 |
| D | 2 | 120 | 60859 | 661.68 | 375 | 366 | 91.4 |
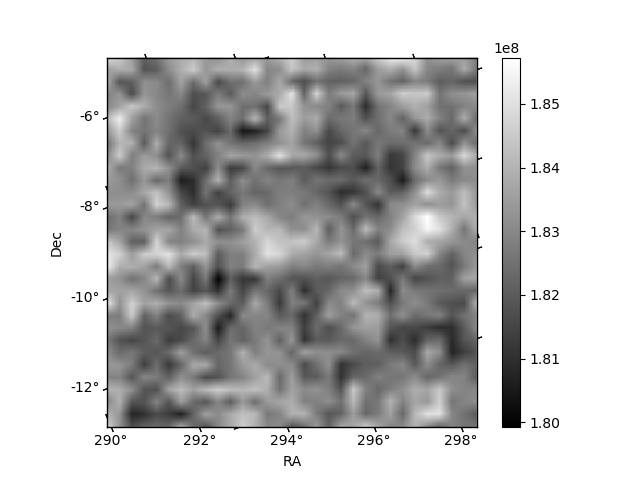
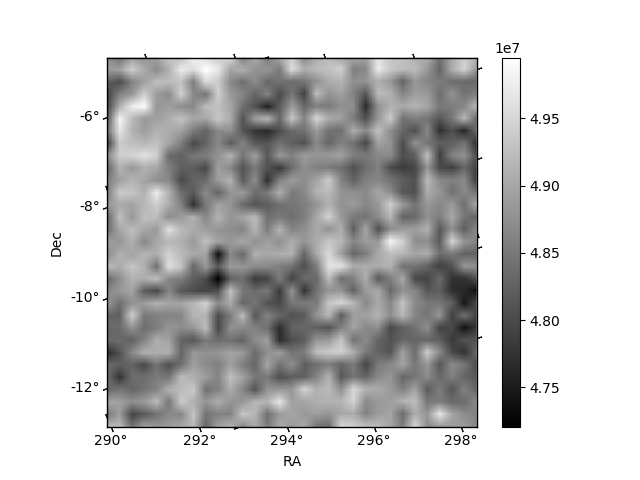
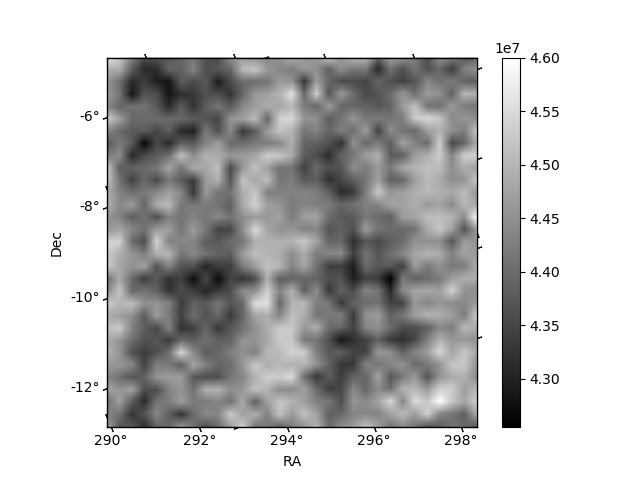
Histogram calculated using DETX and DETY for each event in the final _common_clean file
| Quadrant A | 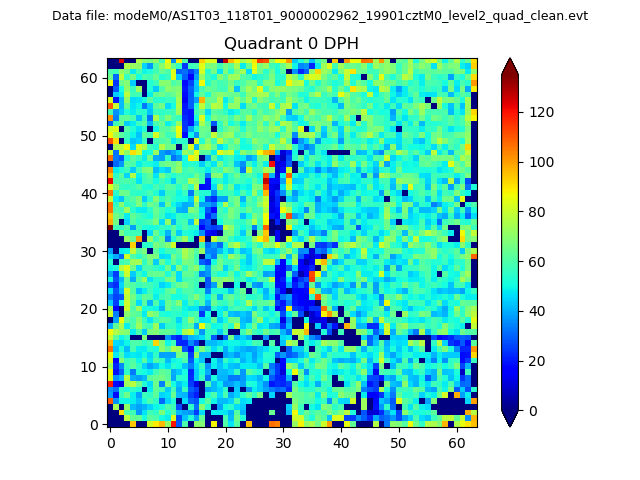 |
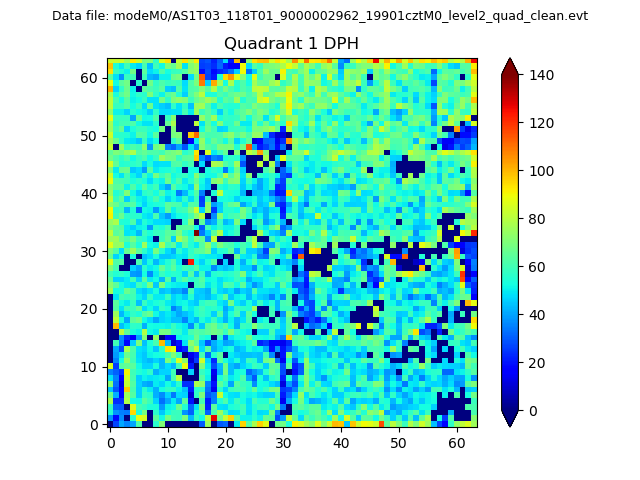 |
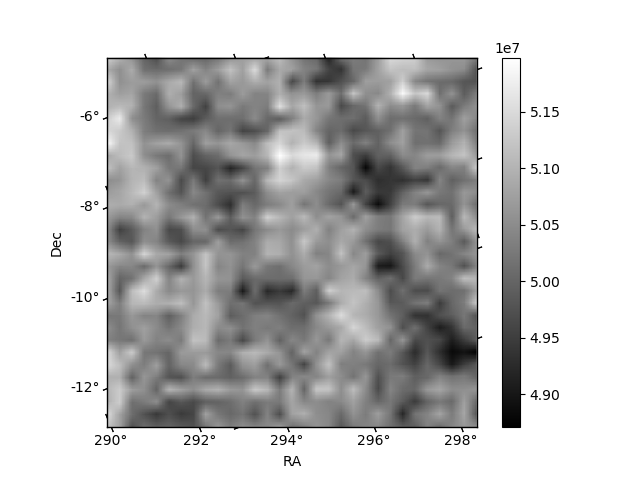
Quadrant B |
|---|---|---|---|
| Quadrant D | 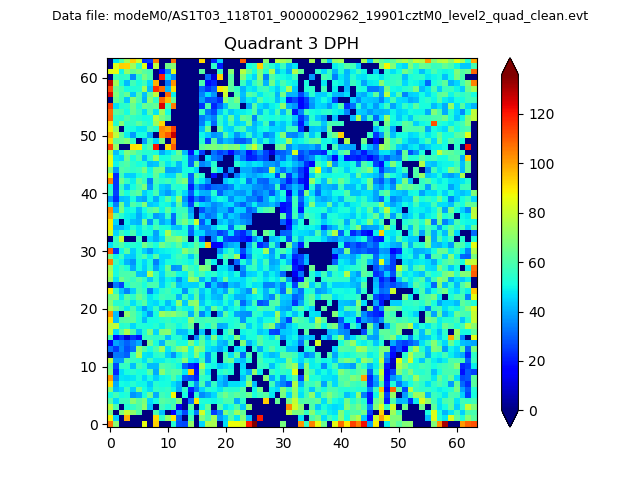 |
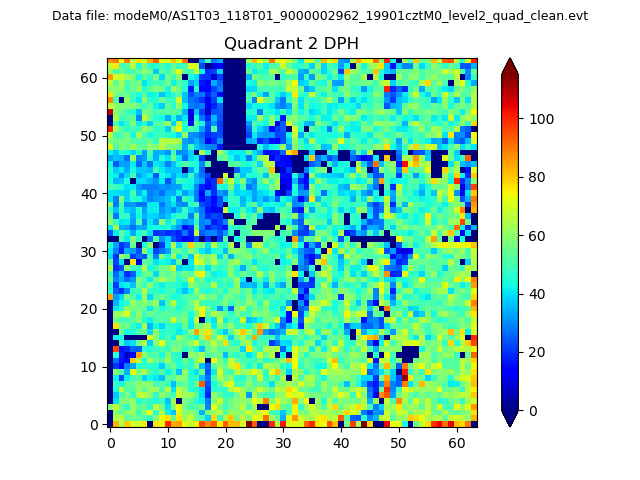 |
Quadrant C |
| Plot type | Count rate plots | Images |
|---|---|---|
| Comparison with Poisson distribution Blue bars denote a histogram of data divided into 1 sec bins. Red curve is a Poisson curve with rate = median count rate of data. |
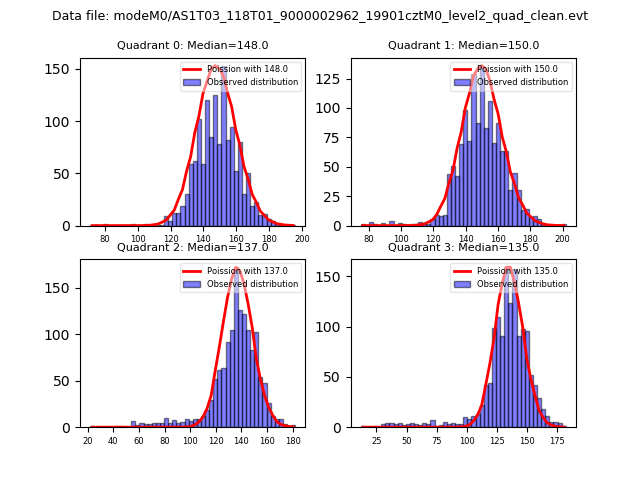 |
 |
| Quadrant-wise count rates Data is divided into 100 sec bins |
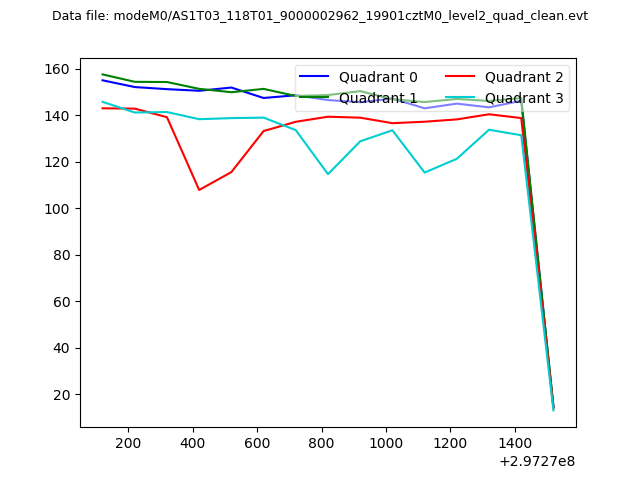 |
|
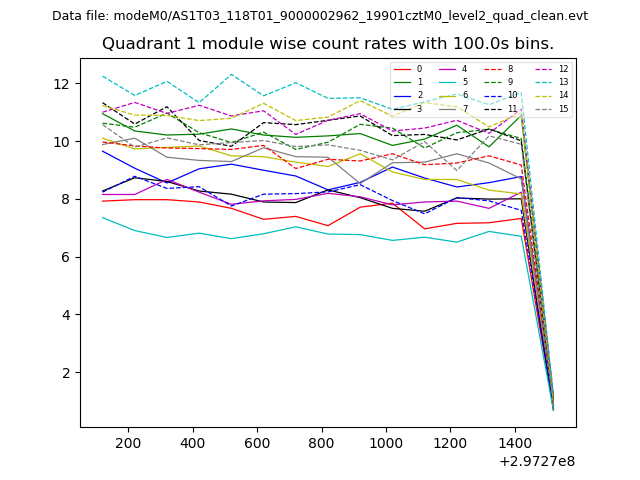
| Module-wise count rates for Quadrant A Data is divided into 100 sec bins |
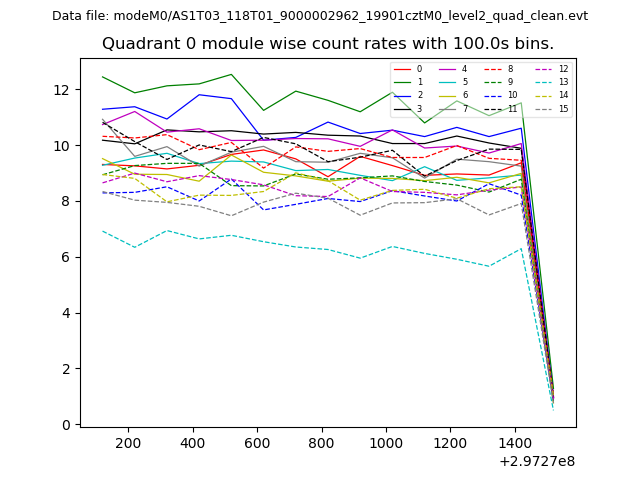 |
 |
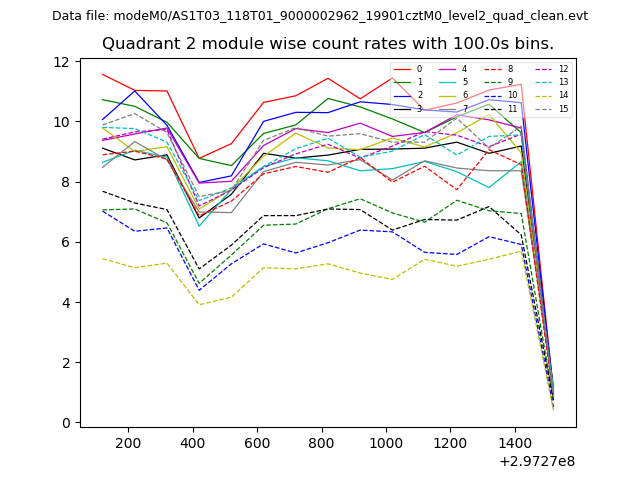
| Module-wise count rates for Quadrant B Data is divided into 100 sec bins |
 |
 |
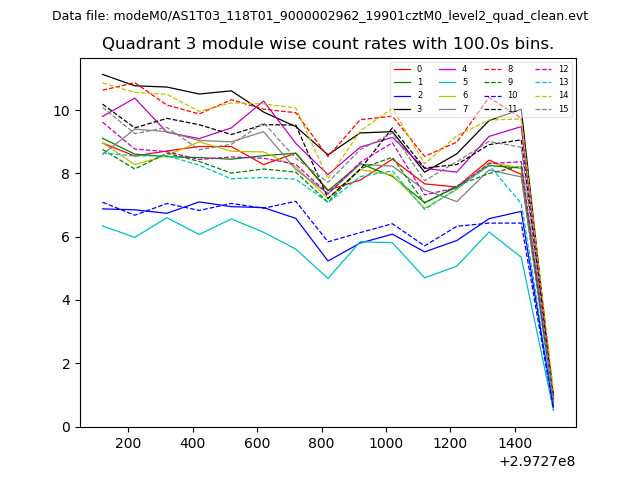
| Module-wise count rates for Quadrant C Data is divided into 100 sec bins |
 |
 |
| Module-wise count rates for Quadrant D Data is divided into 100 sec bins |
 |
 |
| Parameter | Plot |
|---|---|
| CZT HV Monitor |  |
| D_VDD | 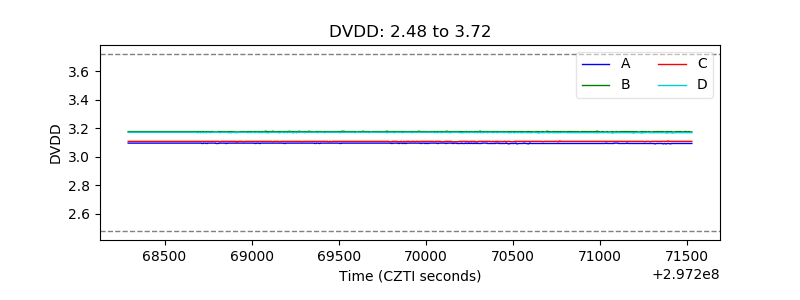 |
| Temperature 1 | 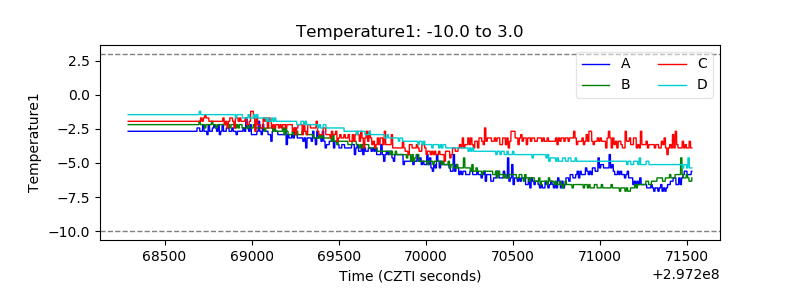 |
| Veto HV Monitor | 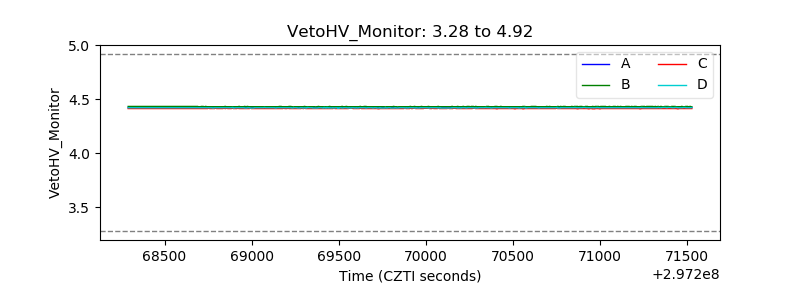 |
| Veto LLD | 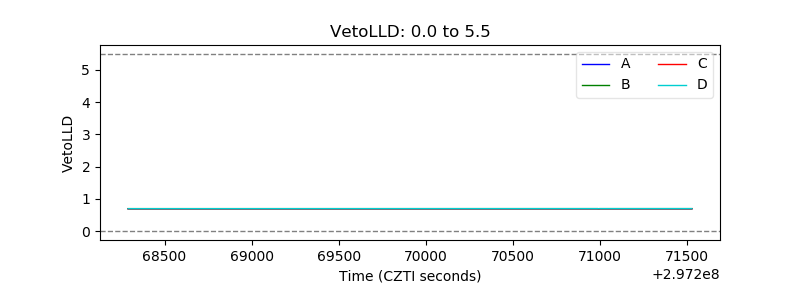 |
| Alpha Counter | 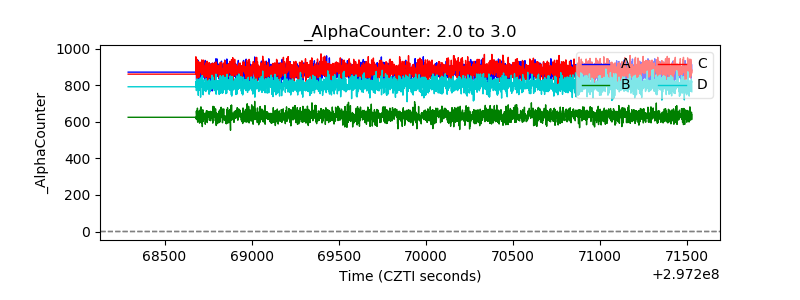 |
| _CPM_Rate | 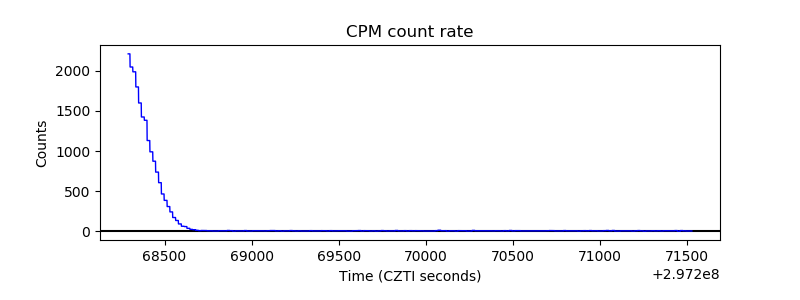 |
| CZT Counter | 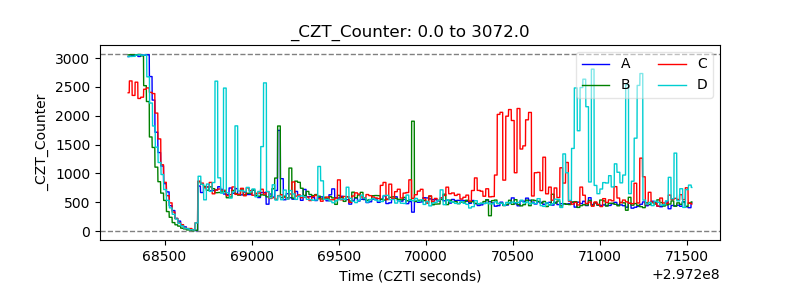 |
| +2.5 Volts monitor |  |
| +5 Volts monitor |  |
| _ROLL_ROT | 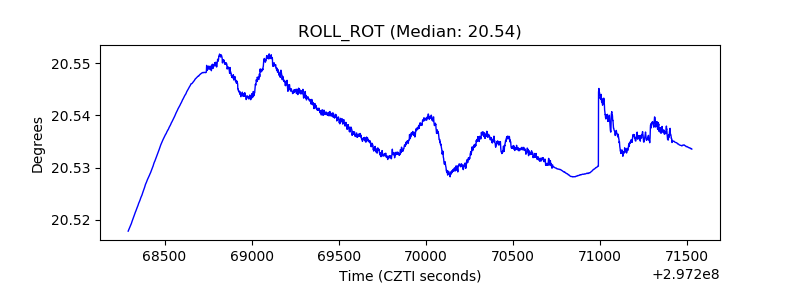 |
| _Roll_DEC | 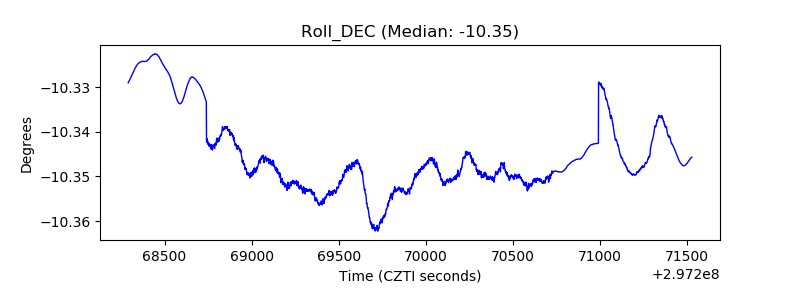 |
| _Roll_RA | 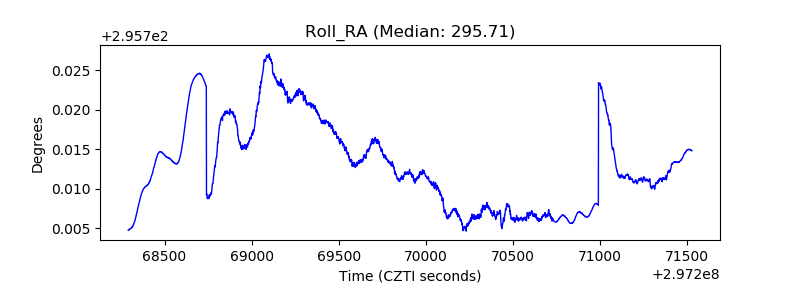 |
| Veto Counter | 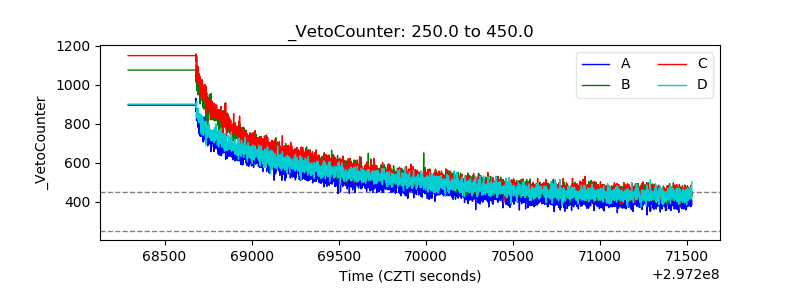 |