| Param | Original file | Final file |
|---|---|---|
| Filename | modeM0/AS1A05_064T01_9000002964cztM0_level2.fits | modeM0/AS1A05_064T01_9000002964cztM0_level2_quad_clean.evt |
| Size (bytes) | 1,196,562,240 | 1,370,096,640 |
| Size | 1.1 GB | 1.3 GB |
| Events in quadrant A | 7,512,612 | 9,022,067 |
| Events in quadrant B | 7,134,376 | 8,973,531 |
| Events in quadrant C | 7,250,986 | 8,419,973 |
| Events in quadrant D | 5,418,368 | 6,177,905 |
| Mode M0 | |||
|---|---|---|---|
| Quadrant | BADHDUFLAG | Total packets | Discarded packets |
| A | 0 | 271098 | 0 |
| B | 0 | 311836 | 0 |
| C | 0 | 373811 | 0 |
| D | 0 | 562870 | 0 |
| Mode SS | |||
|---|---|---|---|
| Quadrant | BADHDUFLAG | Total packets | Discarded packets |
| A | 0 | 2654 | 0 |
| B | 0 | 2654 | 0 |
| C | 0 | 2654 | 0 |
| D | 0 | 2654 | 0 |
| Mode M9 | |||
|---|---|---|---|
| Quadrant | BADHDUFLAG | Total packets | Discarded packets |
| A | 0 | 203 | 0 |
| B | 0 | 203 | 0 |
| C | 0 | 203 | 0 |
| D | 0 | 203 | 0 |
| Quadrant | Total seconds | Saturated seconds | Saturation percentage |
|---|---|---|---|
| A | 129887 | 1215 | 0.935428% |
| B | 129887 | 2229 | 1.716107% |
| C | 129887 | 9447 | 7.273245% |
| D | 129887 | 34676 | 26.697052% |
Noise dominated data is calculated using 1-second bins in cleaned event files. If a bin has >2000 counts, and if more than 50% of those come from <1% of pixels, then it is considered to be noise-dominated and hence unusable.
| Quadrant | # 1 sec bins | Bins with >0 counts | Bins with >2000 counts | High rate bins dominated by noise | Noise dominated (total time) | Noise dominated (detector-on time) | Marked lightcurve |
|---|---|---|---|---|---|---|---|
| A | 150447 | 129868 | 0 | 0 | 0.00% | 0.00% |  |
| B | 150447 | 129868 | 0 | 0 | 0.00% | 0.00% |  |
| C | 150447 | 129836 | 0 | 0 | 0.00% | 0.00% |  |
| D | 150447 | 128200 | 0 | 0 | 0.00% | 0.00% |  |
Top three noisy pixels from each quadrant. If the there are fewer than three noisy pixels in the level2.evt file, extra rows are filled as -1
| Pixel properties | Quadrant properties | ||||||
|---|---|---|---|---|---|---|---|
| Quadrant | DetID | PixID | Counts | Sigma | Mean | Median | Sigma |
| A | 0 | 29 | 7342 | 11.62 | 1957 | 1848 | 472.7 |
| A | 7 | 110 | 6041 | 8.87 | 1957 | 1848 | 472.7 |
| A | 0 | 30 | 5858 | 8.48 | 1957 | 1848 | 472.7 |
| B | 3 | 17 | 4775 | 8.15 | 1898 | 1817 | 362.8 |
| B | 5 | 128 | 4759 | 8.11 | 1898 | 1817 | 362.8 |
| B | 14 | 254 | 4721 | 8.0 | 1898 | 1817 | 362.8 |
| C | 12 | 241 | 5228 | 7.01 | 1916 | 1798 | 489.6 |
| C | 2 | 191 | 4934 | 6.41 | 1916 | 1798 | 489.6 |
| C | 3 | 126 | 4864 | 6.26 | 1916 | 1798 | 489.6 |
| D | 3 | 14 | 4008 | 6.32 | 1553 | 1420 | 409.6 |
| D | 10 | 189 | 4002 | 6.3 | 1553 | 1420 | 409.6 |
| D | 15 | 46 | 3884 | 6.01 | 1553 | 1420 | 409.6 |
Histogram calculated using DETX and DETY for each event in the final _common_clean file
| Quadrant A | 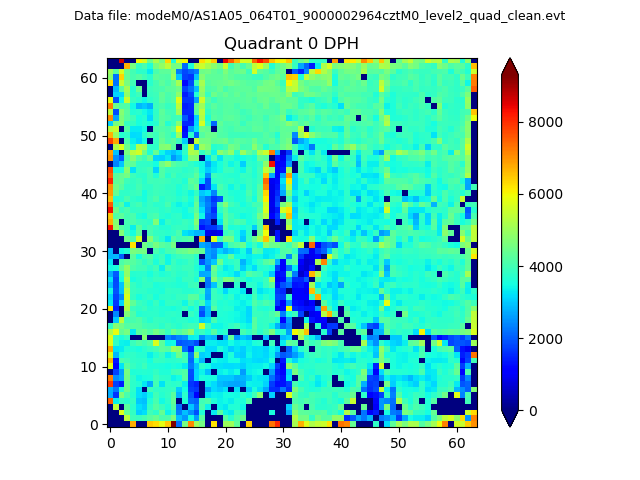 |
 |
Quadrant B |
|---|---|---|---|
| Quadrant D | 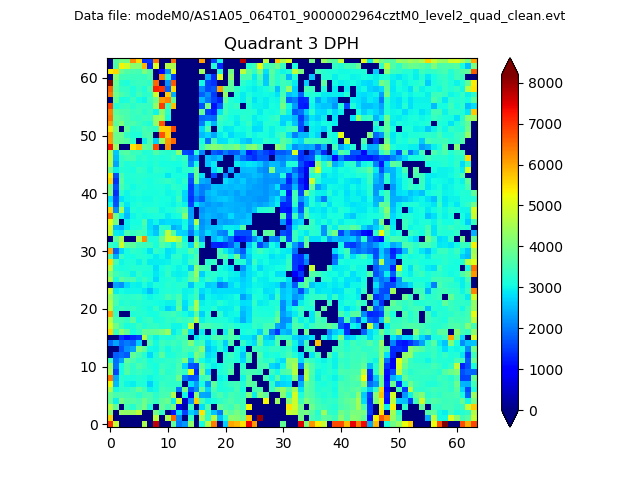 |
 |
Quadrant C |
| Plot type | Count rate plots | Images |
|---|---|---|
| Comparison with Poisson distribution Blue bars denote a histogram of data divided into 1 sec bins. Red curve is a Poisson curve with rate = median count rate of data. |
 |
 |
| Quadrant-wise count rates Data is divided into 100 sec bins |
 |
|
| Module-wise count rates for Quadrant A Data is divided into 100 sec bins |
 |
 |
| Module-wise count rates for Quadrant B Data is divided into 100 sec bins |
 |
 |
| Module-wise count rates for Quadrant C Data is divided into 100 sec bins |
 |
 |
| Module-wise count rates for Quadrant D Data is divided into 100 sec bins |
 |
 |
| Parameter | Plot |
|---|---|
| CZT HV Monitor |  |
| D_VDD |  |
| Temperature 1 |  |
| Veto HV Monitor |  |
| Veto LLD |  |
| Alpha Counter |  |
| _CPM_Rate |  |
| CZT Counter |  |
| +2.5 Volts monitor |  |
| +5 Volts monitor |  |
| _ROLL_ROT |  |
| _Roll_DEC |  |
| _Roll_RA |  |
| Veto Counter |  |