| Param | Original file | Final file |
|---|---|---|
| Filename | modeM0/AS1A05_064T01_9000002964_19902cztM0_level2.evt | modeM0/AS1A05_064T01_9000002964_19902cztM0_level2_quad_clean.evt |
| Size (bytes) | 685,693,440 | 113,512,320 |
| Size | 653.9 MB | 108.3 MB |
| Events in quadrant A | 2,987,543 | 789,771 |
| Events in quadrant B | 3,251,876 | 812,131 |
| Events in quadrant C | 3,687,810 | 790,655 |
| Events in quadrant D | 10,433,636 | 625,318 |
| Mode M0 | |||
|---|---|---|---|
| Quadrant | BADHDUFLAG | Total packets | Discarded packets |
| A | 0 | 12747 | 1 |
| B | 0 | 13632 | 1 |
| C | 0 | 14924 | 1 |
| D | 0 | 35212 | 1 |
| Mode SS | |||
|---|---|---|---|
| Quadrant | BADHDUFLAG | Total packets | Discarded packets |
| A | 0 | 124 | 0 |
| B | 0 | 124 | 0 |
| C | 0 | 124 | 0 |
| D | 0 | 124 | 0 |
| Mode M9 | |||
|---|---|---|---|
| Quadrant | BADHDUFLAG | Total packets | Discarded packets |
| A | 0 | 13 | 0 |
| B | 0 | 13 | 0 |
| C | 0 | 13 | 0 |
| D | 0 | 13 | 0 |
| Quadrant | Total seconds | Saturated seconds | Saturation percentage |
|---|---|---|---|
| A | 5993 | 20 | 0.333723% |
| B | 5994 | 21 | 0.350350% |
| C | 5994 | 135 | 2.252252% |
| D | 5994 | 2133 | 35.585586% |
Noise dominated data is calculated using 1-second bins in cleaned event files. If a bin has >2000 counts, and if more than 50% of those come from <1% of pixels, then it is considered to be noise-dominated and hence unusable.
| Quadrant | # 1 sec bins | Bins with >0 counts | Bins with >2000 counts | High rate bins dominated by noise | Noise dominated (total time) | Noise dominated (detector-on time) | Marked lightcurve |
|---|---|---|---|---|---|---|---|
| A | 7338 | 5994 | 3 | 3 | 0.04% | 0.05% | 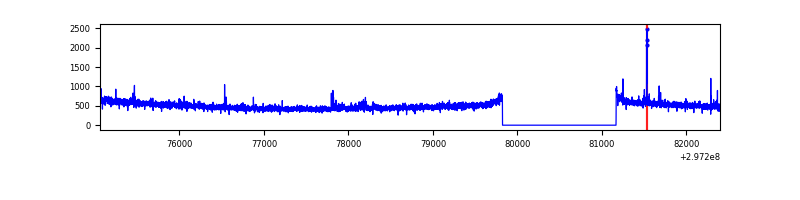 |
| B | 7339 | 5995 | 2 | 2 | 0.03% | 0.03% | 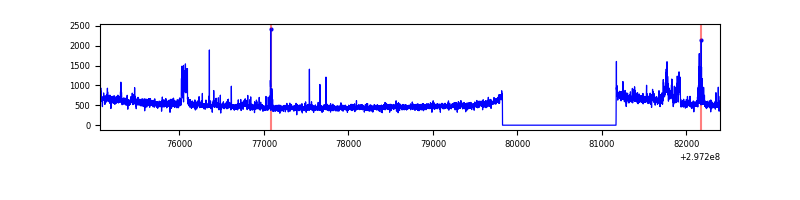 |
| C | 7339 | 5995 | 14 | 14 | 0.19% | 0.23% | 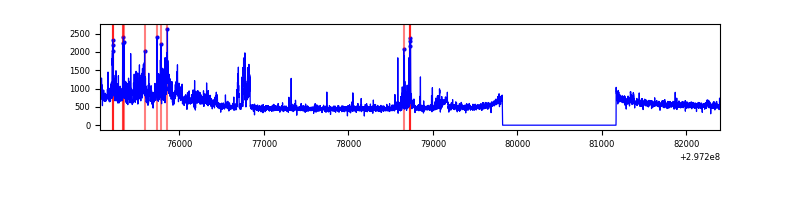 |
| D | 7338 | 5993 | 2201 | 2201 | 29.99% | 36.73% |  |
Top three noisy pixels from each quadrant. If the there are fewer than three noisy pixels in the level2.evt file, extra rows are filled as -1
| Pixel properties | Quadrant properties | ||||||
|---|---|---|---|---|---|---|---|
| Quadrant | DetID | PixID | Counts | Sigma | Mean | Median | Sigma |
| A | 4 | 2 | 30578 | 195.77 | 762 | 749 | 152.4 |
| A | 9 | 143 | 16575 | 103.87 | 762 | 749 | 152.4 |
| A | 0 | 226 | 6568 | 38.19 | 762 | 749 | 152.4 |
| B | 4 | 216 | 113860 | 806.97 | 769 | 751 | 140.2 |
| B | 0 | 190 | 39135 | 273.85 | 769 | 751 | 140.2 |
| B | 0 | 197 | 31409 | 218.73 | 769 | 751 | 140.2 |
| C | 9 | 221 | 613111 | 3502.47 | 754 | 759 | 174.8 |
| C | 14 | 238 | 119360 | 678.36 | 754 | 759 | 174.8 |
| C | 7 | 220 | 11851 | 63.44 | 754 | 759 | 174.8 |
| D | 2 | 184 | 5566299 | 34507.69 | 668 | 651 | 161.3 |
| D | 1 | 52 | 622973 | 3858.47 | 668 | 651 | 161.3 |
| D | 9 | 1 | 611720 | 3788.7 | 668 | 651 | 161.3 |
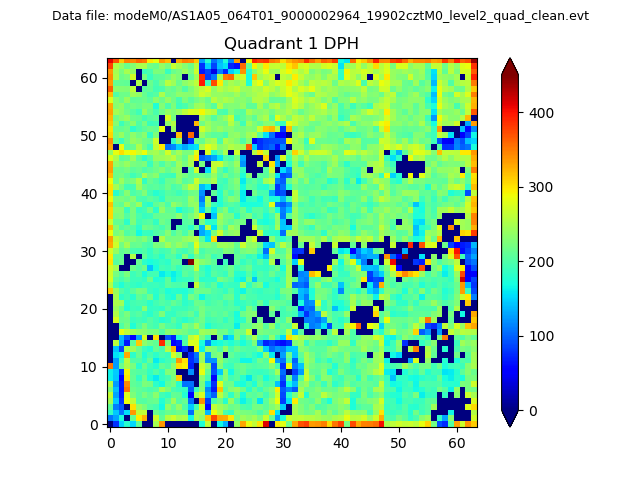
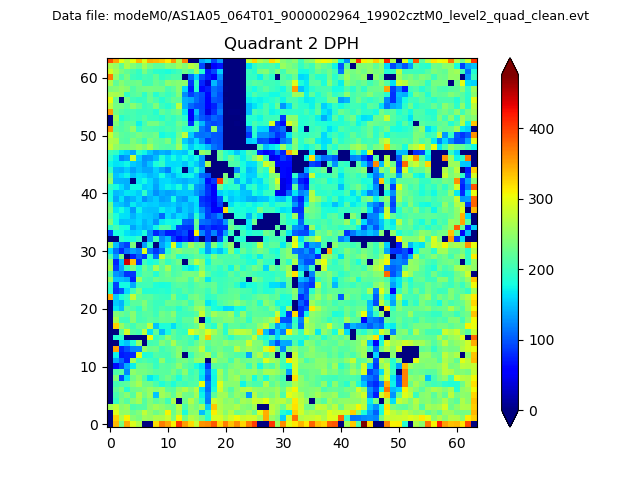
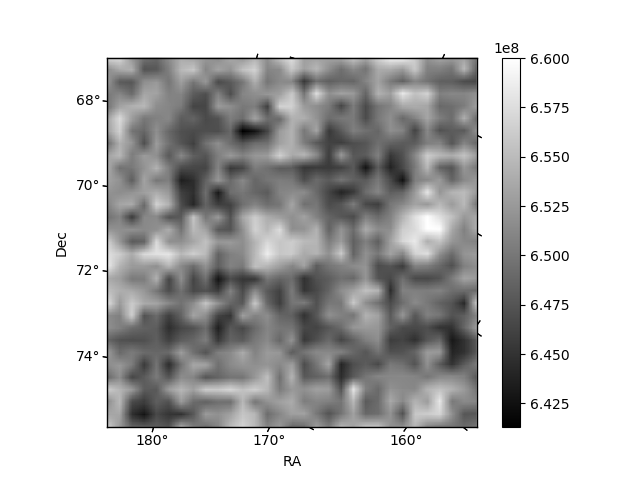
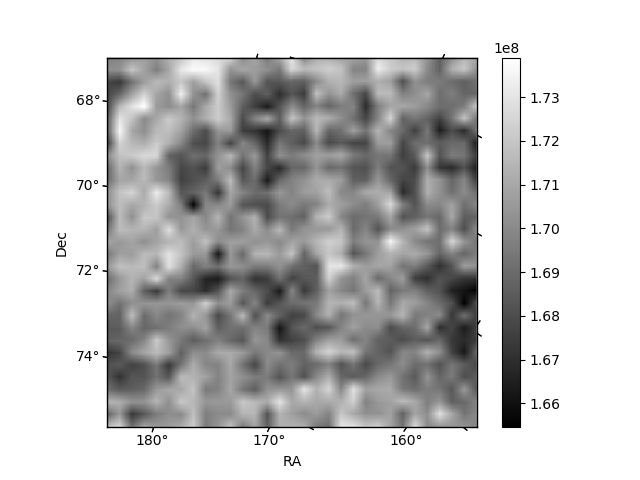
Histogram calculated using DETX and DETY for each event in the final _common_clean file
| Quadrant A | 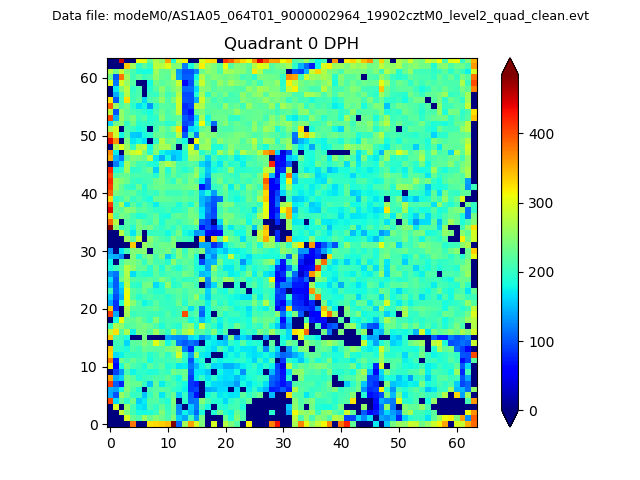 |
 |
Quadrant B |
|---|---|---|---|
| Quadrant D | 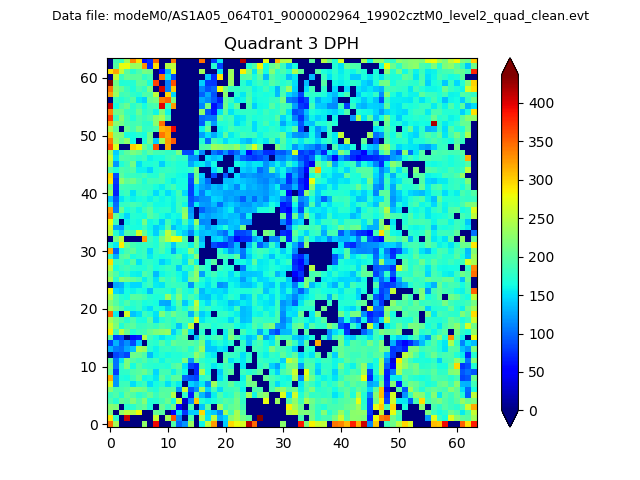 |
 |
Quadrant C |
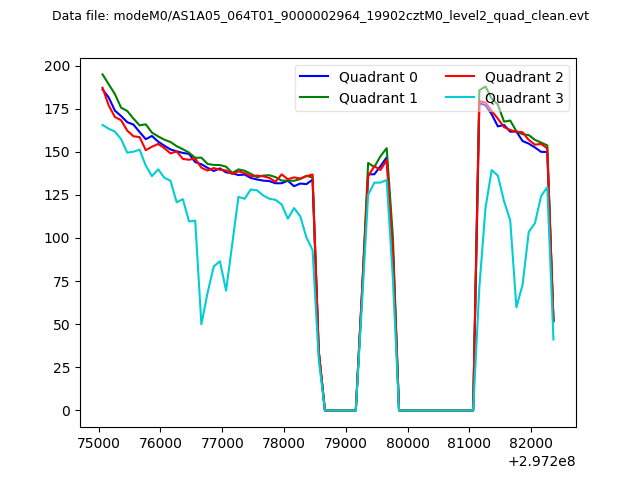
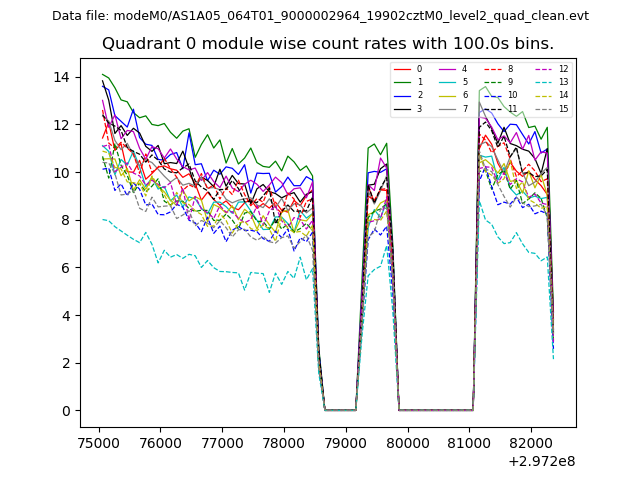
| Plot type | Count rate plots | Images |
|---|---|---|
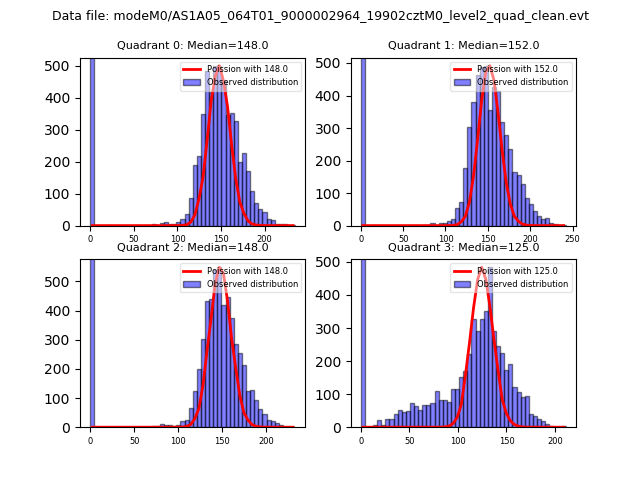
| Comparison with Poisson distribution Blue bars denote a histogram of data divided into 1 sec bins. Red curve is a Poisson curve with rate = median count rate of data. |
 |
 |
| Quadrant-wise count rates Data is divided into 100 sec bins |
 |
|
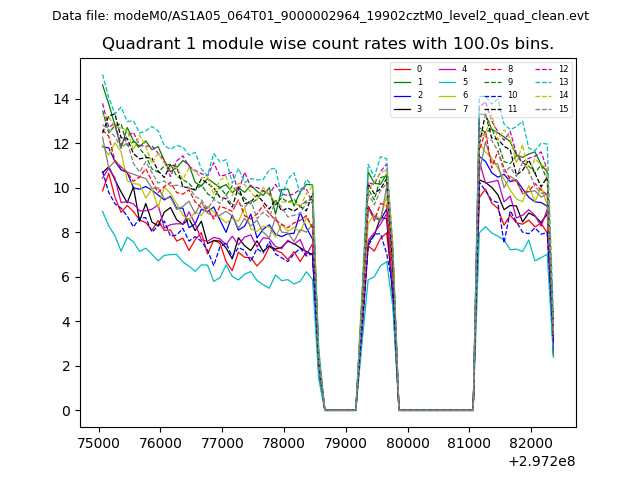
| Module-wise count rates for Quadrant A Data is divided into 100 sec bins |
 |
 |
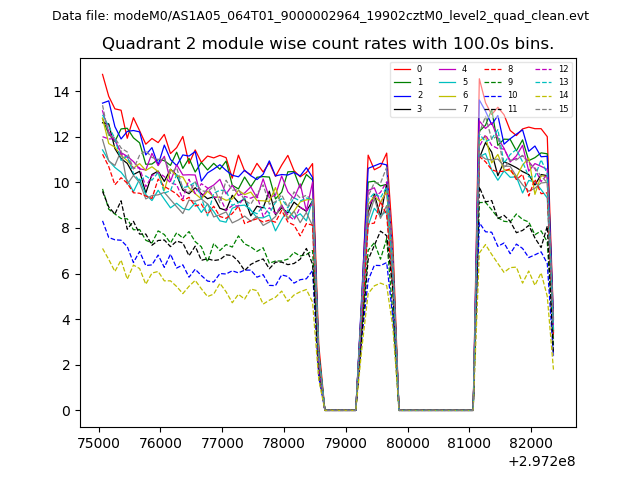
| Module-wise count rates for Quadrant B Data is divided into 100 sec bins |
 |
 |
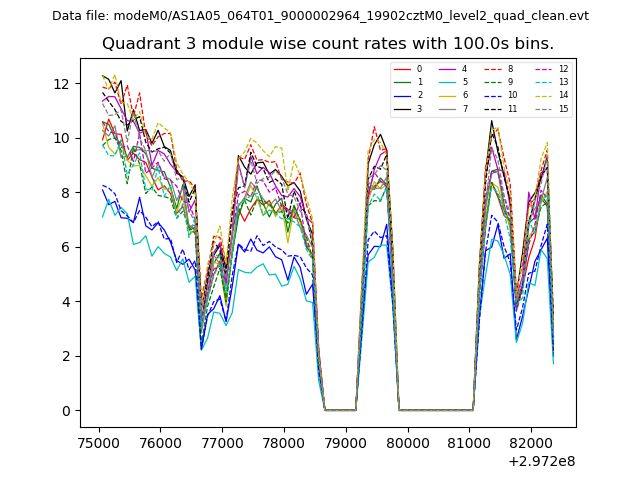
| Module-wise count rates for Quadrant C Data is divided into 100 sec bins |
 |
 |
| Module-wise count rates for Quadrant D Data is divided into 100 sec bins |
 |
 |
| Parameter | Plot |
|---|---|
| CZT HV Monitor | 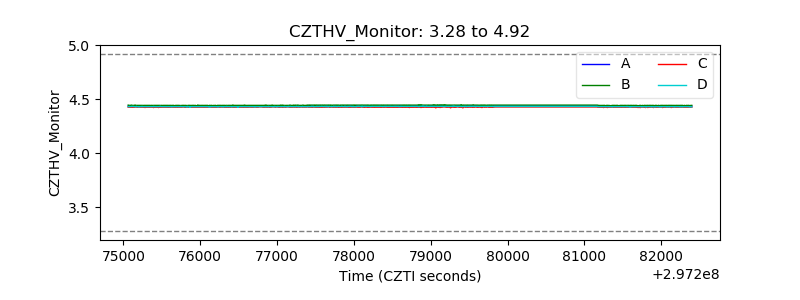 |
| D_VDD | 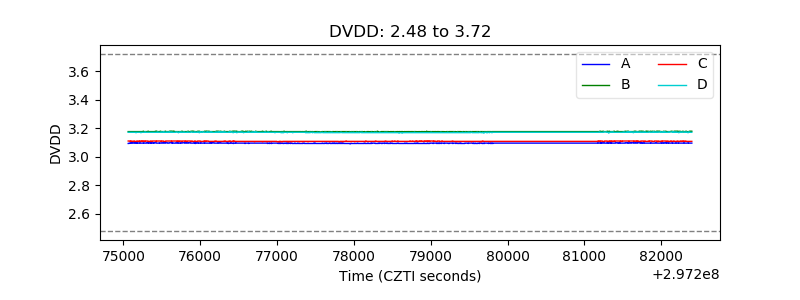 |
| Temperature 1 | 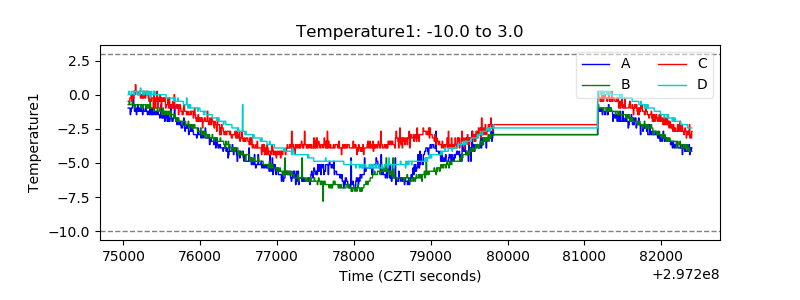 |
| Veto HV Monitor | 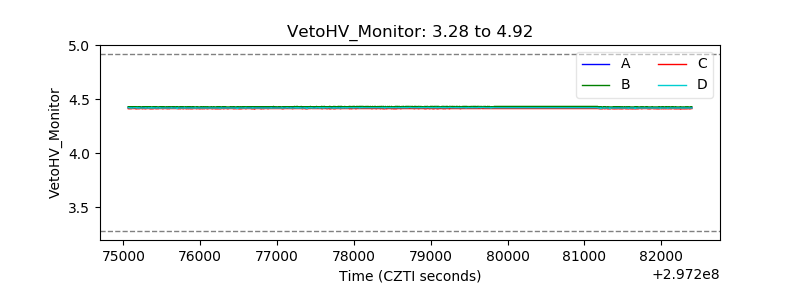 |
| Veto LLD | 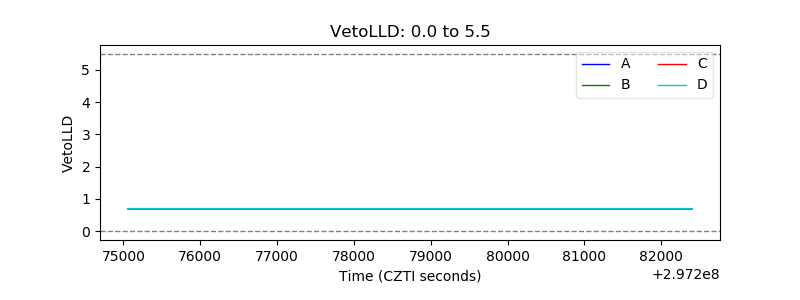 |
| Alpha Counter | 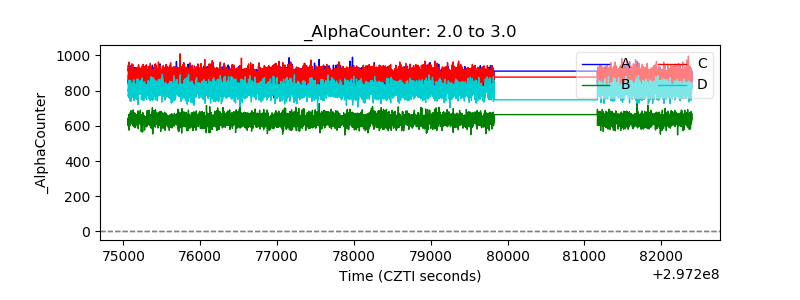 |
| _CPM_Rate | 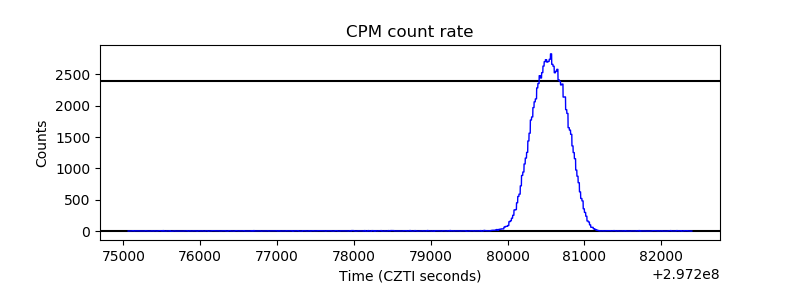 |
| CZT Counter | 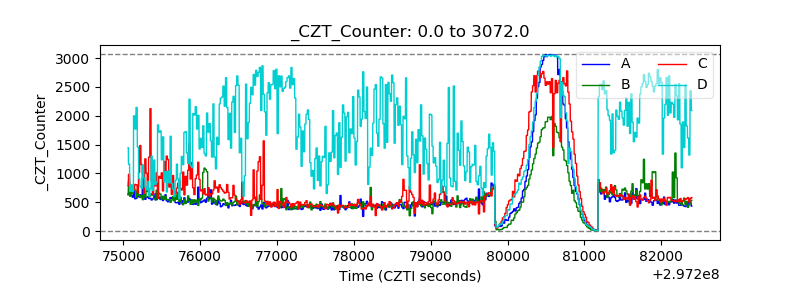 |
| +2.5 Volts monitor | 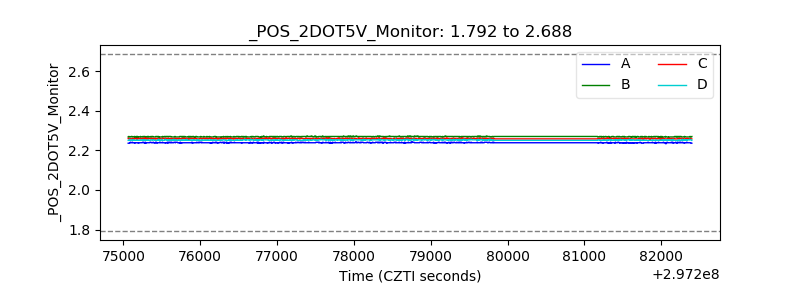 |
| +5 Volts monitor | 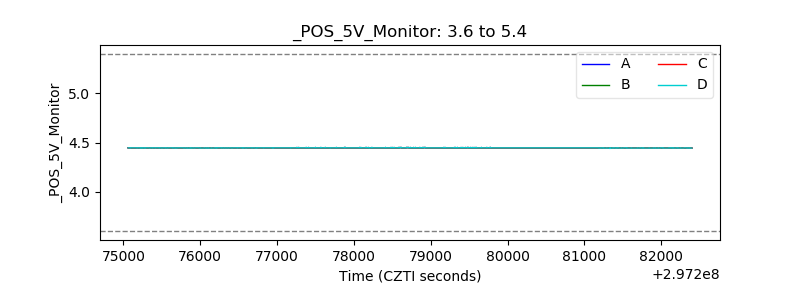 |
| _ROLL_ROT | 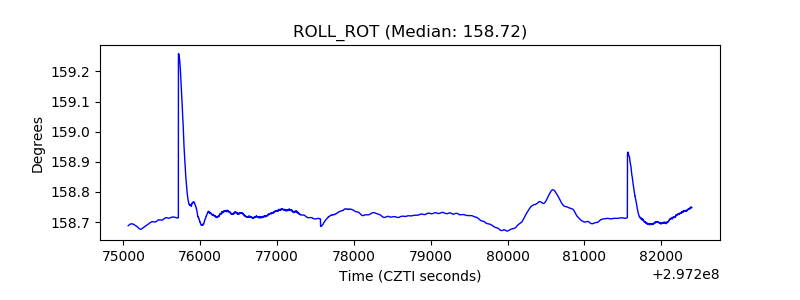 |
| _Roll_DEC | 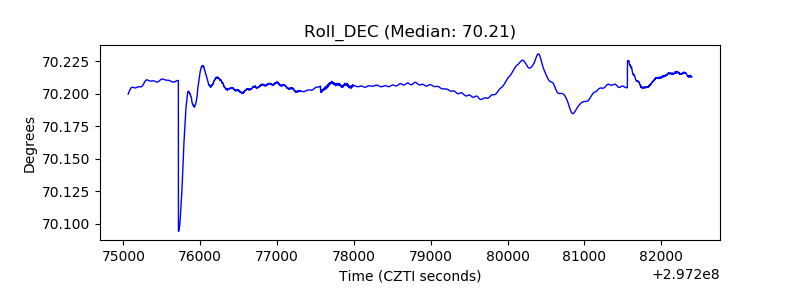 |
| _Roll_RA | 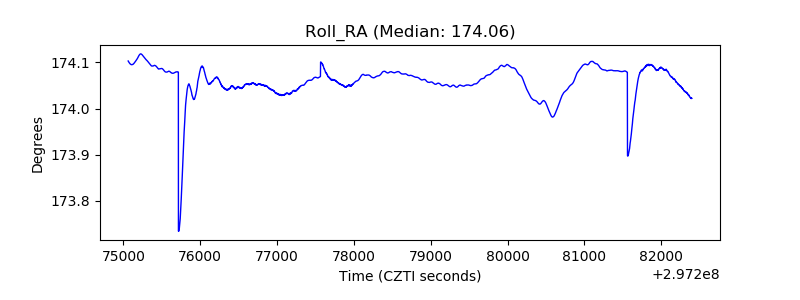 |
| Veto Counter | 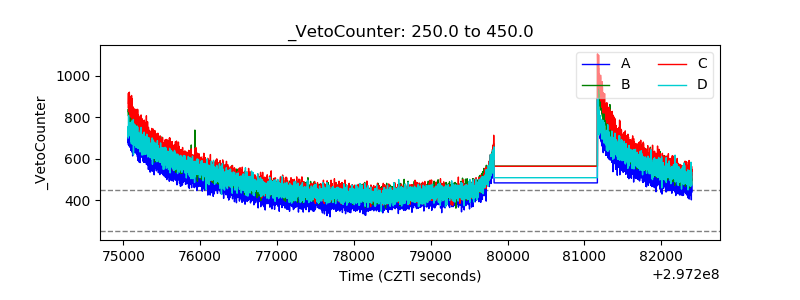 |