| Param | Original file | Final file |
|---|---|---|
| Filename | modeM0/AS1A05_064T01_9000002964_19907cztM0_level2.evt | modeM0/AS1A05_064T01_9000002964_19907cztM0_level2_quad_clean.evt |
| Size (bytes) | 709,807,680 | 111,568,320 |
| Size | 676.9 MB | 106.4 MB |
| Events in quadrant A | 3,220,172 | 747,690 |
| Events in quadrant B | 3,567,328 | 757,180 |
| Events in quadrant C | 4,339,301 | 737,220 |
| Events in quadrant D | 9,880,160 | 631,906 |
| Mode M0 | |||
|---|---|---|---|
| Quadrant | BADHDUFLAG | Total packets | Discarded packets |
| A | 0 | 14762 | 1 |
| B | 0 | 15524 | 1 |
| C | 0 | 17653 | 1 |
| D | 0 | 34426 | 1 |
| Mode SS | |||
|---|---|---|---|
| Quadrant | BADHDUFLAG | Total packets | Discarded packets |
| A | 0 | 148 | 0 |
| B | 0 | 148 | 0 |
| C | 0 | 148 | 0 |
| D | 0 | 148 | 0 |
| Mode M9 | |||
|---|---|---|---|
| Quadrant | BADHDUFLAG | Total packets | Discarded packets |
| A | 0 | 3 | 0 |
| B | 0 | 3 | 0 |
| C | 0 | 3 | 0 |
| D | 0 | 3 | 0 |
| Quadrant | Total seconds | Saturated seconds | Saturation percentage |
|---|---|---|---|
| A | 7243 | 58 | 0.800773% |
| B | 7243 | 131 | 1.808643% |
| C | 7243 | 192 | 2.650835% |
| D | 7243 | 1700 | 23.470937% |
Noise dominated data is calculated using 1-second bins in cleaned event files. If a bin has >2000 counts, and if more than 50% of those come from <1% of pixels, then it is considered to be noise-dominated and hence unusable.
| Quadrant | # 1 sec bins | Bins with >0 counts | Bins with >2000 counts | High rate bins dominated by noise | Noise dominated (total time) | Noise dominated (detector-on time) | Marked lightcurve |
|---|---|---|---|---|---|---|---|
| A | 7528 | 7243 | 0 | 0 | 0.00% | 0.00% | 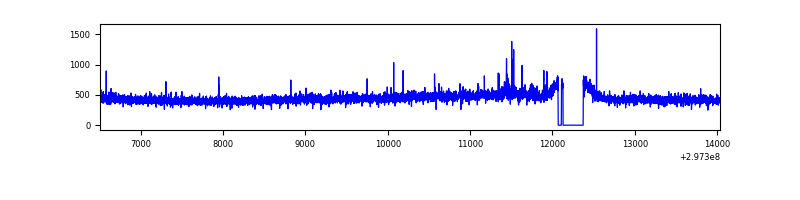 |
| B | 7528 | 7244 | 42 | 42 | 0.56% | 0.58% | 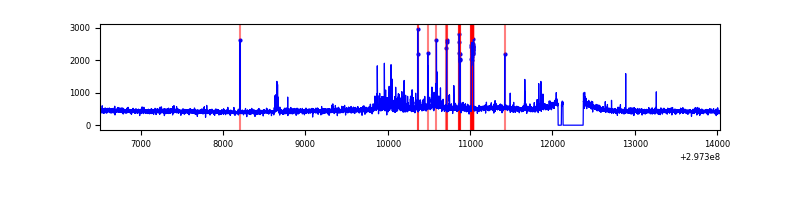 |
| C | 7528 | 7245 | 48 | 48 | 0.64% | 0.66% | 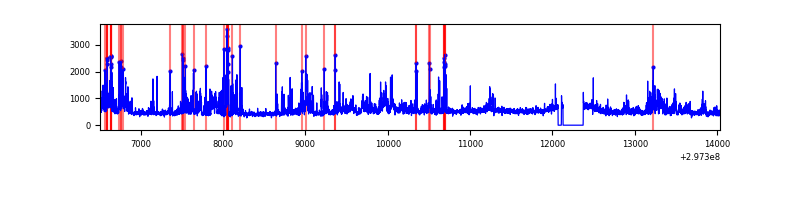 |
| D | 7528 | 7244 | 1714 | 1714 | 22.77% | 23.66% | 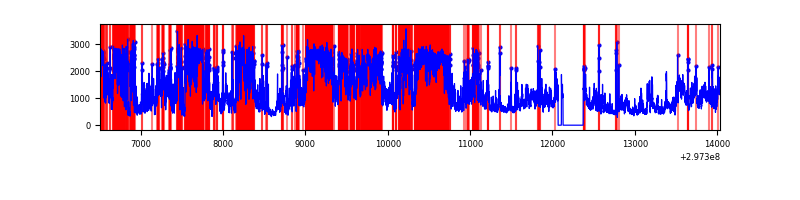 |
Top three noisy pixels from each quadrant. If the there are fewer than three noisy pixels in the level2.evt file, extra rows are filled as -1
| Pixel properties | Quadrant properties | ||||||
|---|---|---|---|---|---|---|---|
| Quadrant | DetID | PixID | Counts | Sigma | Mean | Median | Sigma |
| A | 10 | 253 | 26663 | 153.47 | 828 | 808 | 168.5 |
| A | 0 | 226 | 7262 | 38.31 | 828 | 808 | 168.5 |
| A | 3 | 137 | 6582 | 34.27 | 828 | 808 | 168.5 |
| B | 0 | 228 | 92347 | 581.91 | 830 | 811 | 157.3 |
| B | 7 | 220 | 88063 | 554.68 | 830 | 811 | 157.3 |
| B | 0 | 197 | 36134 | 224.55 | 830 | 811 | 157.3 |
| C | 9 | 221 | 1024744 | 5466.06 | 804 | 809 | 187.3 |
| C | 14 | 238 | 124166 | 658.52 | 804 | 809 | 187.3 |
| C | 0 | 207 | 30489 | 158.44 | 804 | 809 | 187.3 |
| D | 2 | 184 | 6165936 | 34154.19 | 742 | 719 | 180.5 |
| D | 7 | 38 | 468687 | 2592.46 | 742 | 719 | 180.5 |
| D | 12 | 233 | 121039 | 666.55 | 742 | 719 | 180.5 |
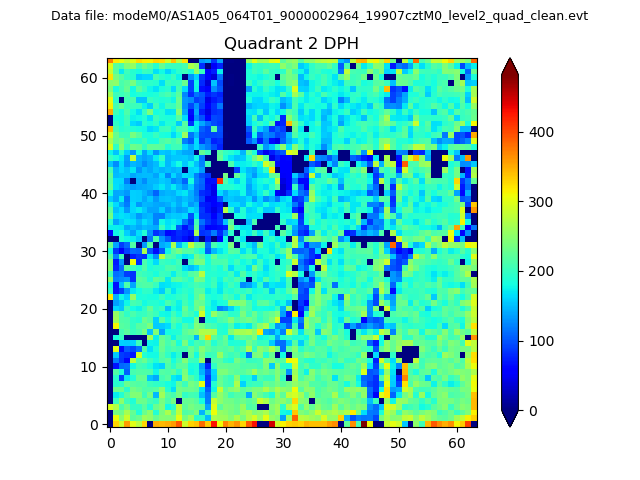
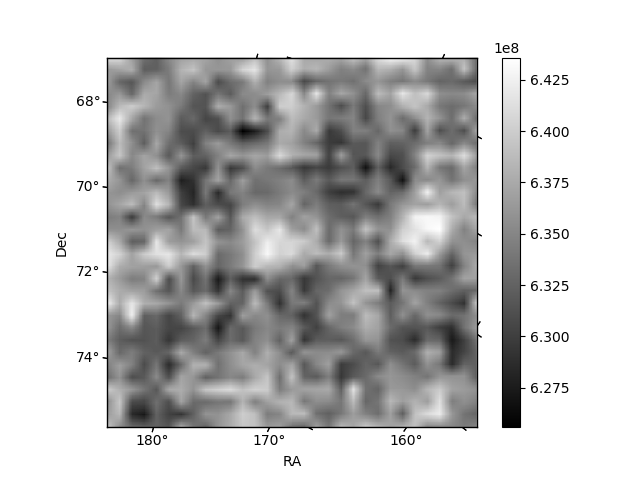
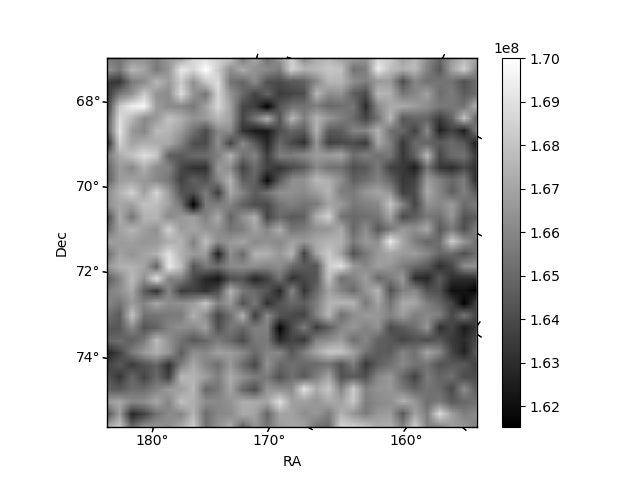
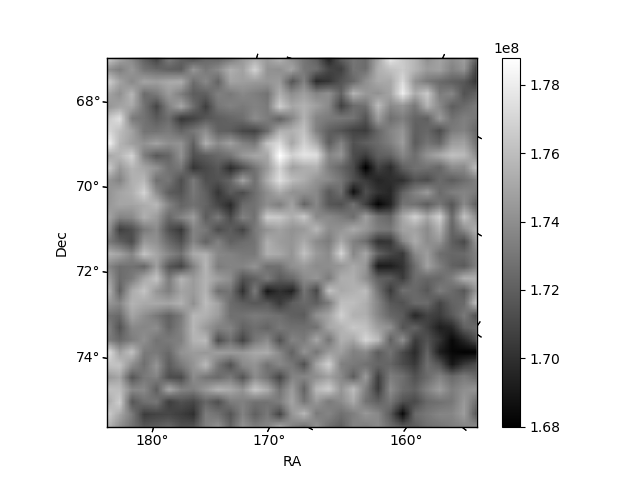
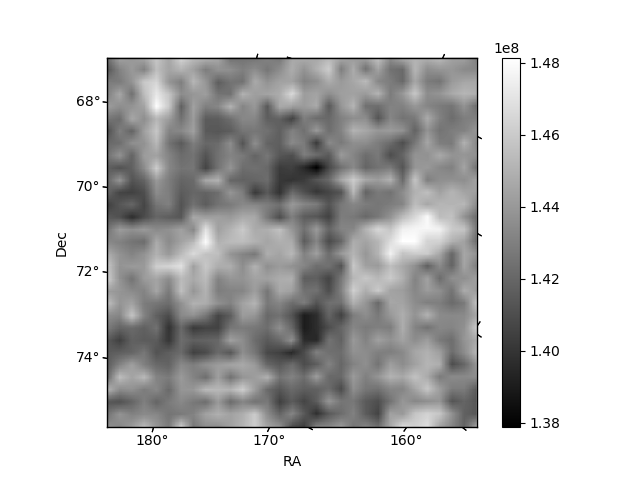
Histogram calculated using DETX and DETY for each event in the final _common_clean file
| Quadrant A | 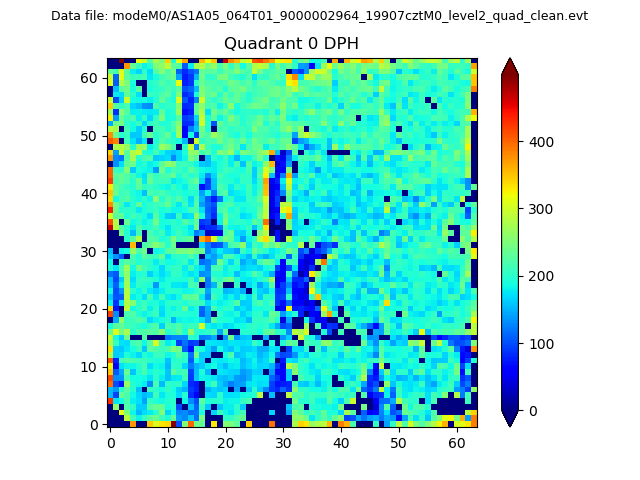 |
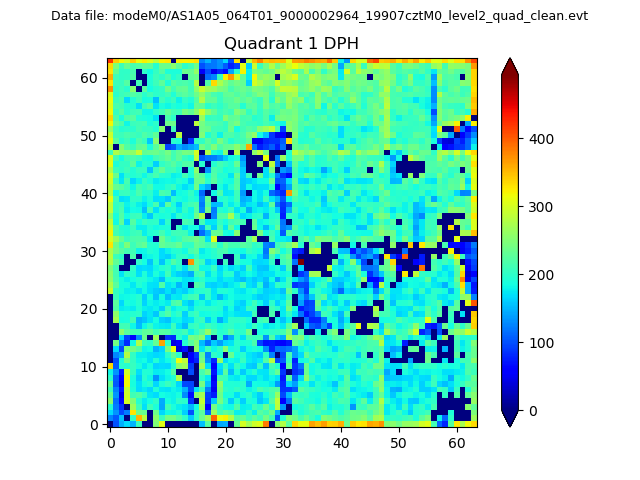 |
Quadrant B |
|---|---|---|---|
| Quadrant D | 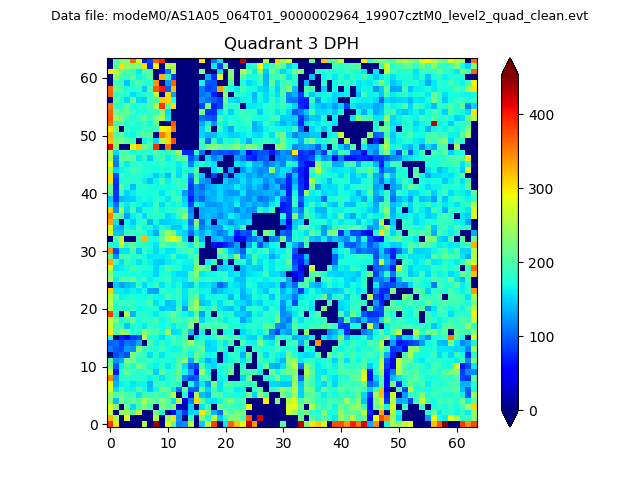 |
 |
Quadrant C |
| Plot type | Count rate plots | Images |
|---|---|---|
| Comparison with Poisson distribution Blue bars denote a histogram of data divided into 1 sec bins. Red curve is a Poisson curve with rate = median count rate of data. |
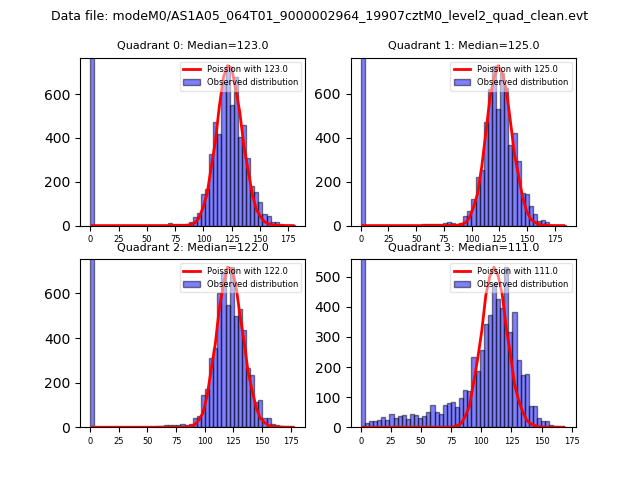 |
 |
| Quadrant-wise count rates Data is divided into 100 sec bins |
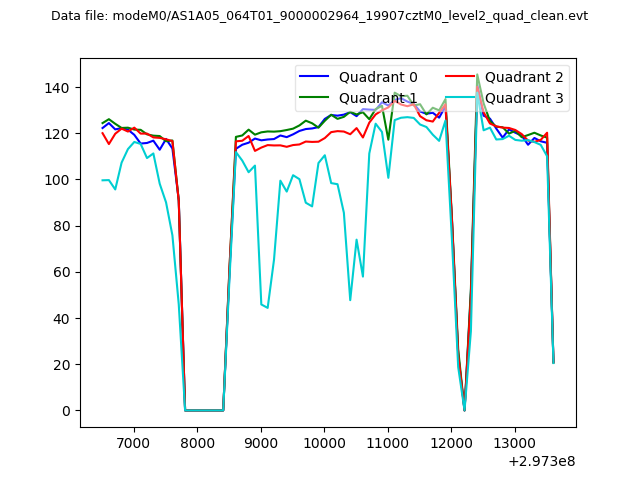 |
|
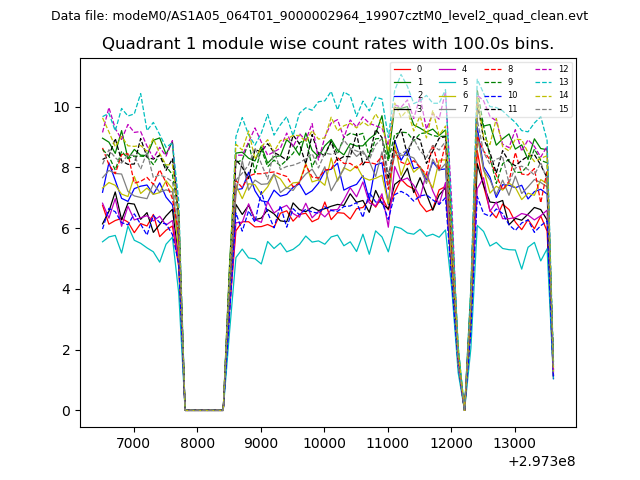
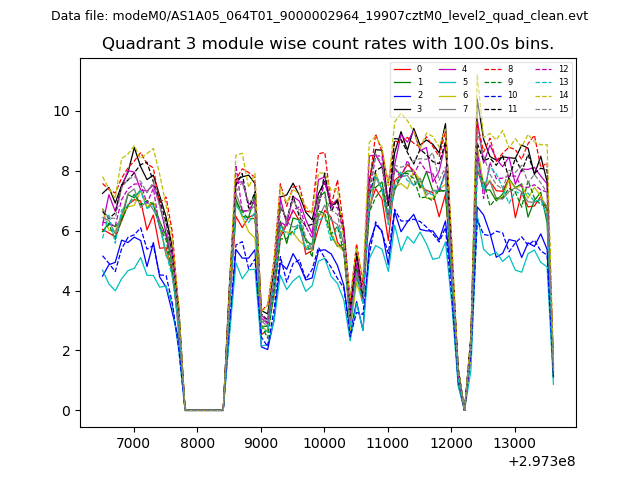
| Module-wise count rates for Quadrant A Data is divided into 100 sec bins |
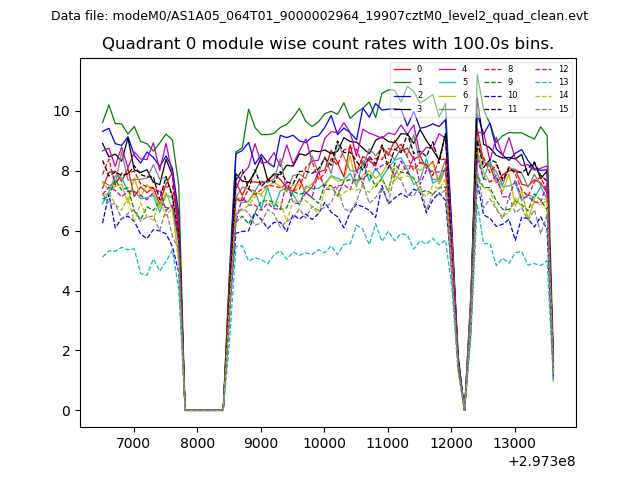 |
 |
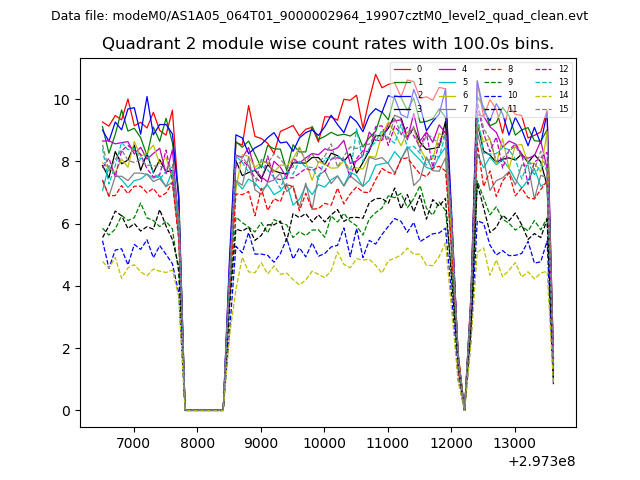
| Module-wise count rates for Quadrant B Data is divided into 100 sec bins |
 |
 |
| Module-wise count rates for Quadrant C Data is divided into 100 sec bins |
 |
 |
| Module-wise count rates for Quadrant D Data is divided into 100 sec bins |
 |
 |
| Parameter | Plot |
|---|---|
| CZT HV Monitor | 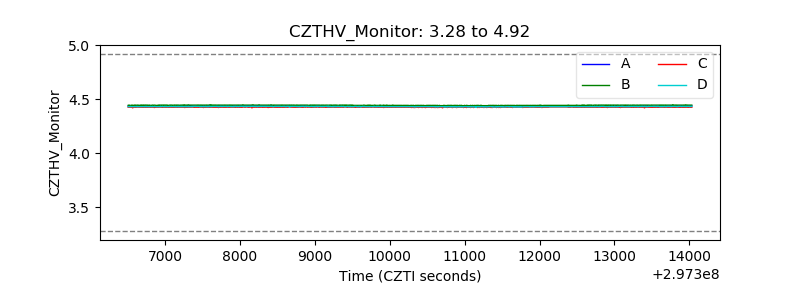 |
| D_VDD | 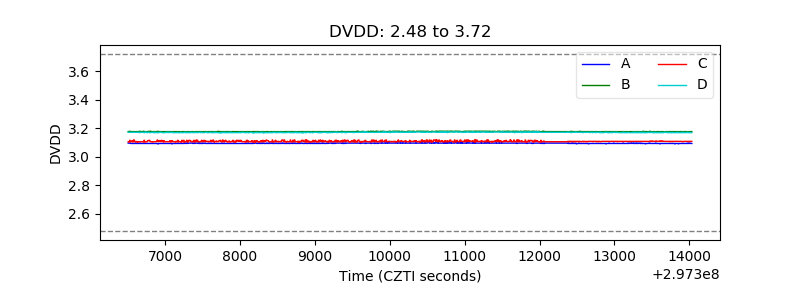 |
| Temperature 1 | 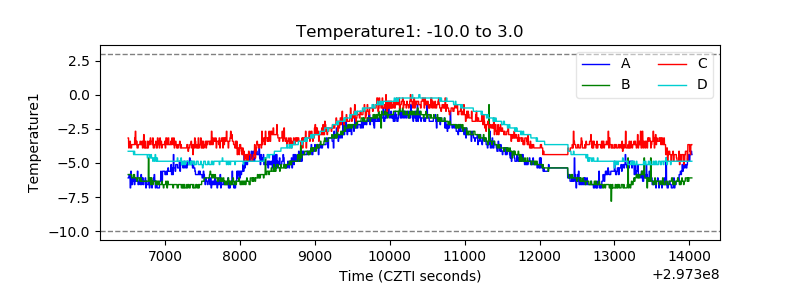 |
| Veto HV Monitor | 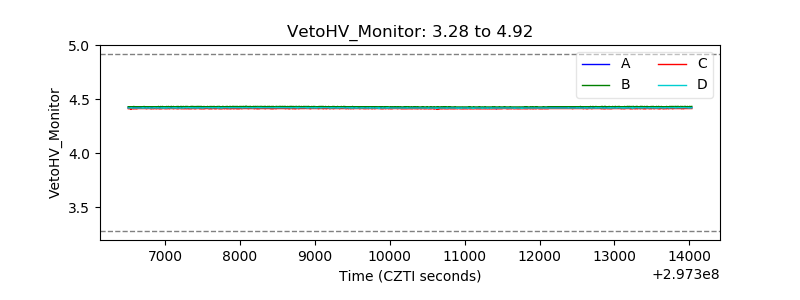 |
| Veto LLD | 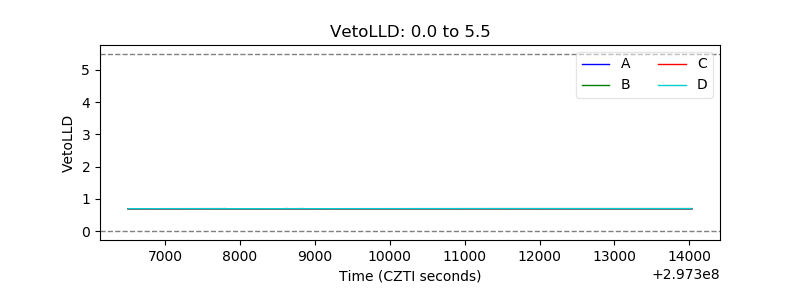 |
| Alpha Counter | 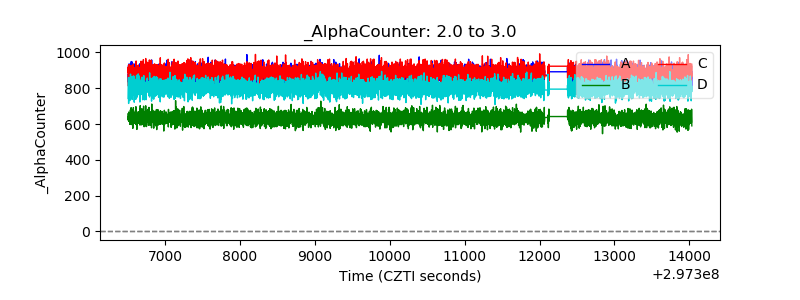 |
| _CPM_Rate | 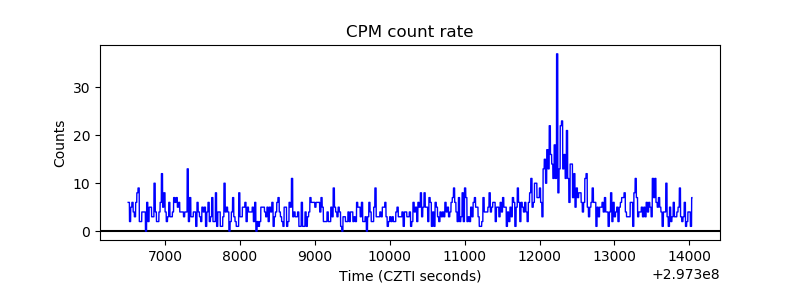 |
| CZT Counter | 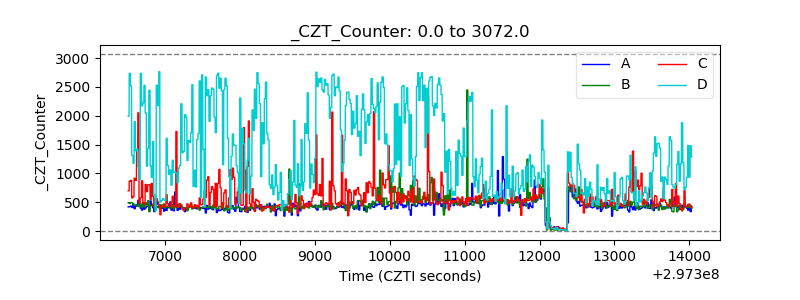 |
| +2.5 Volts monitor |  |
| +5 Volts monitor | 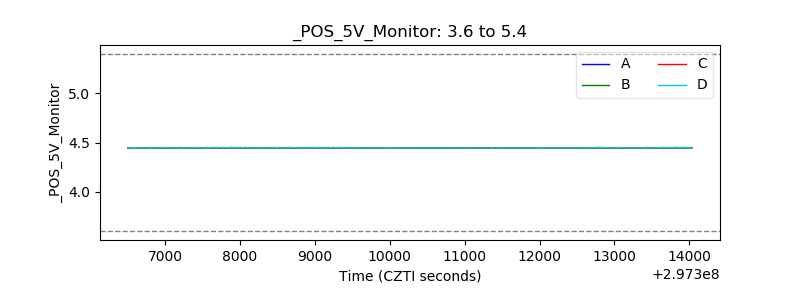 |
| _ROLL_ROT | 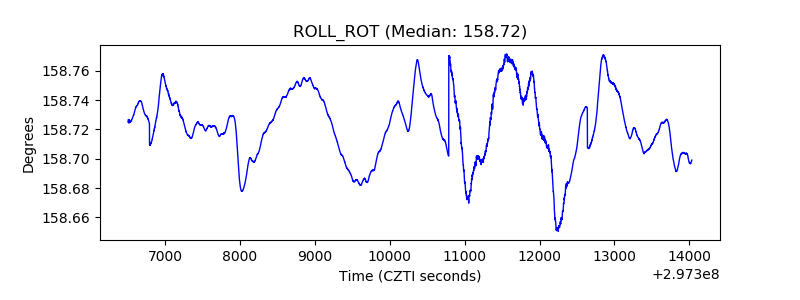 |
| _Roll_DEC | 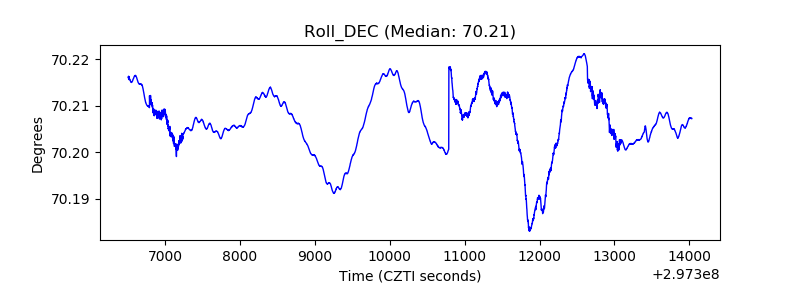 |
| _Roll_RA | 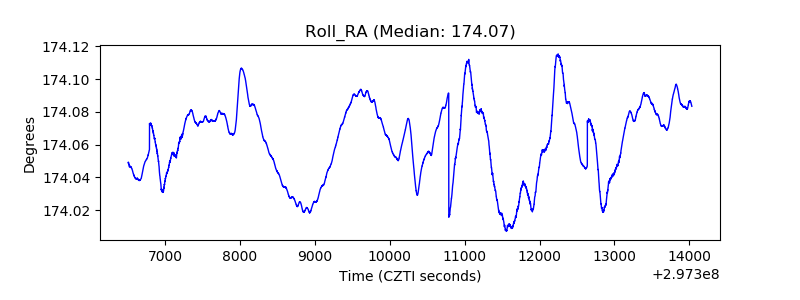 |
| Veto Counter | 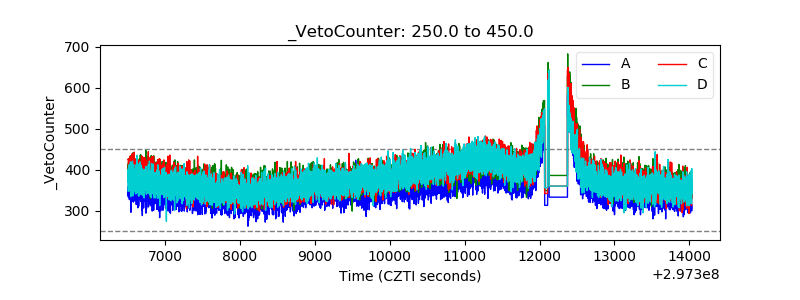 |