| Param | Original file | Final file |
|---|---|---|
| Filename | modeM0/AS1A05_064T01_9000002964_19908cztM0_level2.evt | modeM0/AS1A05_064T01_9000002964_19908cztM0_level2_quad_clean.evt |
| Size (bytes) | 563,895,360 | 105,220,800 |
| Size | 537.8 MB | 100.3 MB |
| Events in quadrant A | 3,180,846 | 683,283 |
| Events in quadrant B | 3,506,434 | 693,582 |
| Events in quadrant C | 3,802,381 | 675,152 |
| Events in quadrant D | 6,102,850 | 636,074 |
| Mode M0 | |||
|---|---|---|---|
| Quadrant | BADHDUFLAG | Total packets | Discarded packets |
| A | 0 | 14500 | 1 |
| B | 0 | 15225 | 1 |
| C | 0 | 15991 | 1 |
| D | 0 | 22972 | 1 |
| Mode SS | |||
|---|---|---|---|
| Quadrant | BADHDUFLAG | Total packets | Discarded packets |
| A | 0 | 144 | 0 |
| B | 0 | 144 | 0 |
| C | 0 | 144 | 0 |
| D | 0 | 144 | 0 |
| Mode M9 | |||
|---|---|---|---|
| Quadrant | BADHDUFLAG | Total packets | Discarded packets |
| A | 0 | 3 | 0 |
| B | 0 | 3 | 0 |
| C | 0 | 3 | 0 |
| D | 0 | 3 | 0 |
| Quadrant | Total seconds | Saturated seconds | Saturation percentage |
|---|---|---|---|
| A | 7155 | 126 | 1.761006% |
| B | 7155 | 165 | 2.306080% |
| C | 7155 | 198 | 2.767296% |
| D | 7156 | 609 | 8.510341% |
Noise dominated data is calculated using 1-second bins in cleaned event files. If a bin has >2000 counts, and if more than 50% of those come from <1% of pixels, then it is considered to be noise-dominated and hence unusable.
| Quadrant | # 1 sec bins | Bins with >0 counts | Bins with >2000 counts | High rate bins dominated by noise | Noise dominated (total time) | Noise dominated (detector-on time) | Marked lightcurve |
|---|---|---|---|---|---|---|---|
| A | 7460 | 7155 | 0 | 0 | 0.00% | 0.00% |  |
| B | 7460 | 7155 | 15 | 15 | 0.20% | 0.21% |  |
| C | 7460 | 7155 | 31 | 31 | 0.42% | 0.43% |  |
| D | 7461 | 7156 | 471 | 471 | 6.31% | 6.58% |  |
Top three noisy pixels from each quadrant. If the there are fewer than three noisy pixels in the level2.evt file, extra rows are filled as -1
| Pixel properties | Quadrant properties | ||||||
|---|---|---|---|---|---|---|---|
| Quadrant | DetID | PixID | Counts | Sigma | Mean | Median | Sigma |
| A | 14 | 238 | 7629 | 41.06 | 824 | 804 | 166.2 |
| A | 0 | 226 | 7079 | 37.75 | 824 | 804 | 166.2 |
| A | 3 | 137 | 6644 | 35.13 | 824 | 804 | 166.2 |
| B | 7 | 220 | 109222 | 688.47 | 823 | 802 | 157.5 |
| B | 0 | 189 | 56492 | 353.63 | 823 | 802 | 157.5 |
| B | 0 | 197 | 34384 | 213.25 | 823 | 802 | 157.5 |
| C | 9 | 221 | 455954 | 2419.56 | 795 | 800 | 188.1 |
| C | 14 | 238 | 123870 | 654.23 | 795 | 800 | 188.1 |
| C | 0 | 207 | 112882 | 595.82 | 795 | 800 | 188.1 |
| D | 2 | 184 | 2434380 | 12606.03 | 784 | 759 | 193.1 |
| D | 7 | 238 | 279776 | 1445.29 | 784 | 759 | 193.1 |
| D | 7 | 96 | 148330 | 764.41 | 784 | 759 | 193.1 |
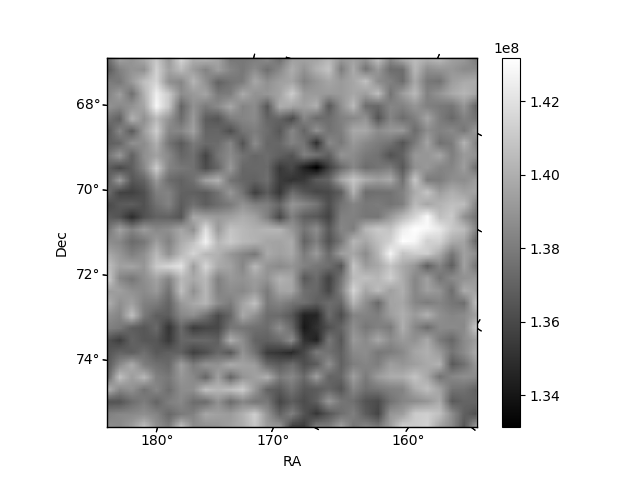
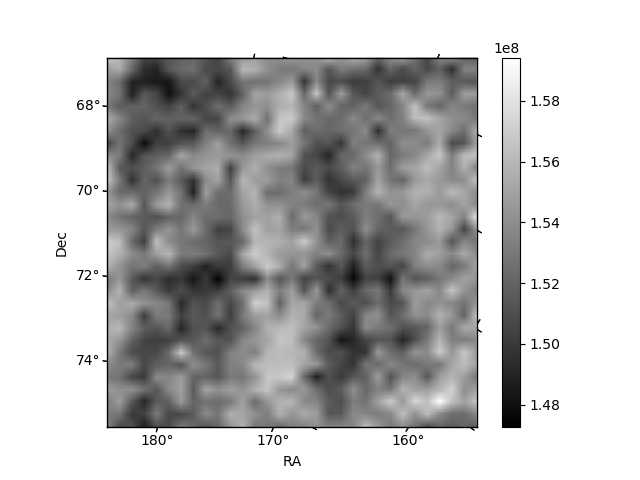
Histogram calculated using DETX and DETY for each event in the final _common_clean file
| Quadrant A | 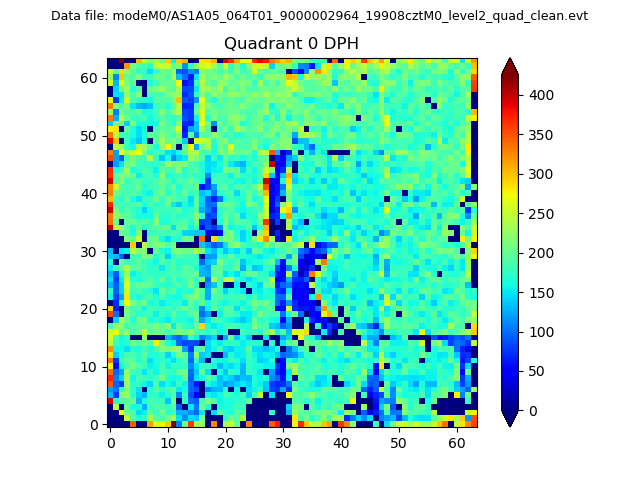 |
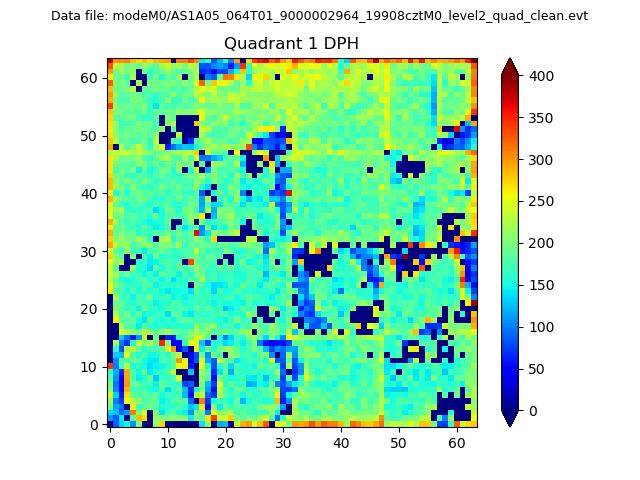 |
Quadrant B |
|---|---|---|---|
| Quadrant D | 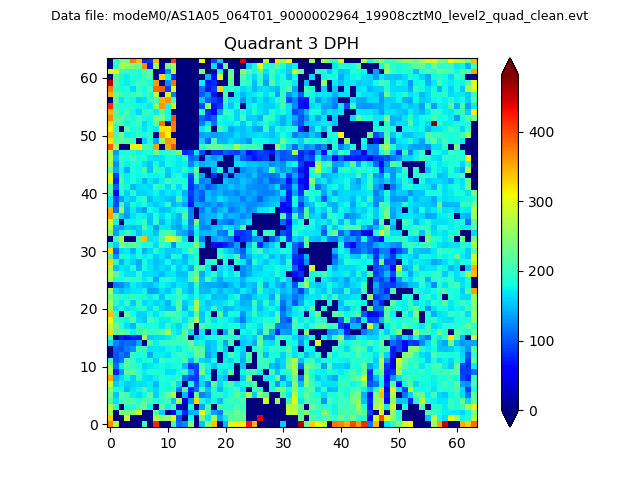 |
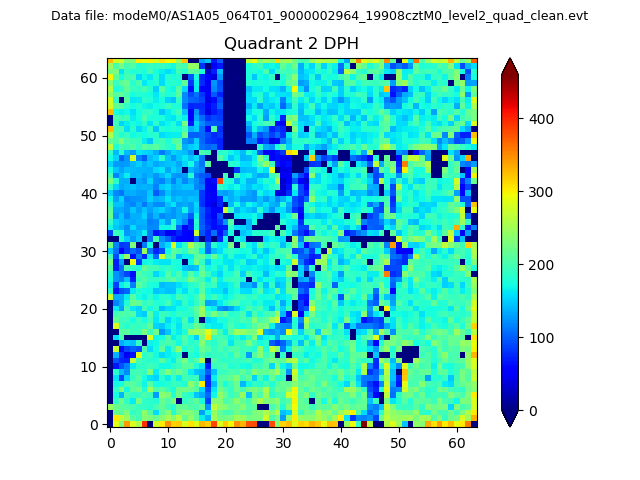 |
Quadrant C |
| Plot type | Count rate plots | Images |
|---|---|---|
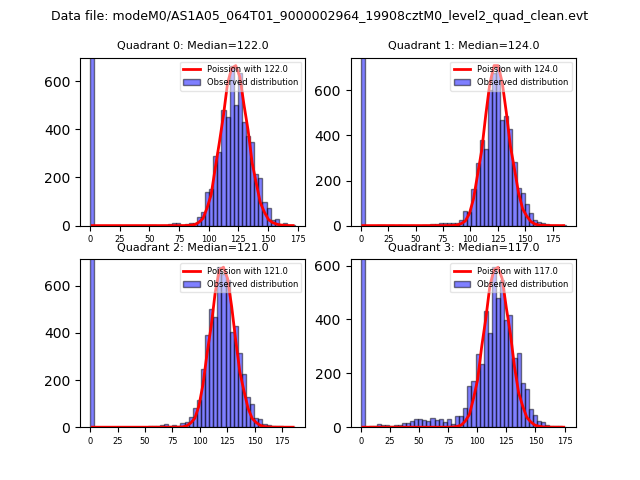
| Comparison with Poisson distribution Blue bars denote a histogram of data divided into 1 sec bins. Red curve is a Poisson curve with rate = median count rate of data. |
 |
 |
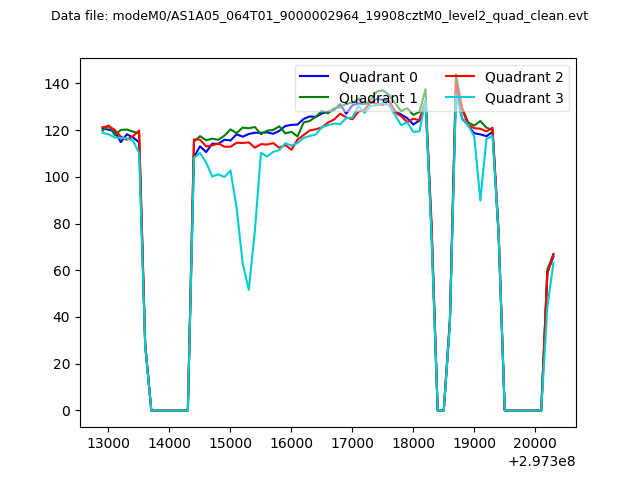
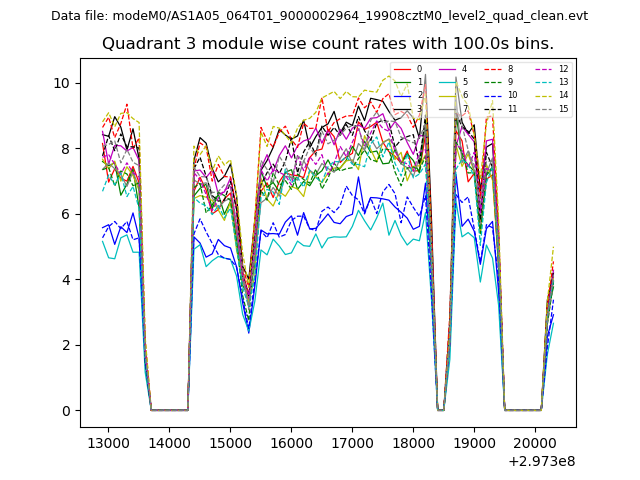
| Quadrant-wise count rates Data is divided into 100 sec bins |
 |
|
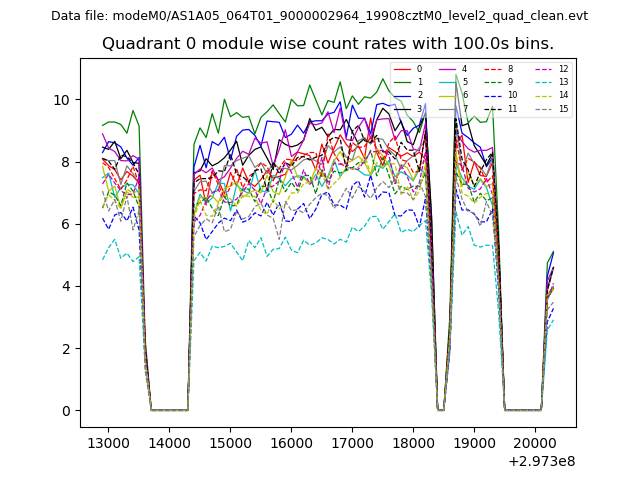
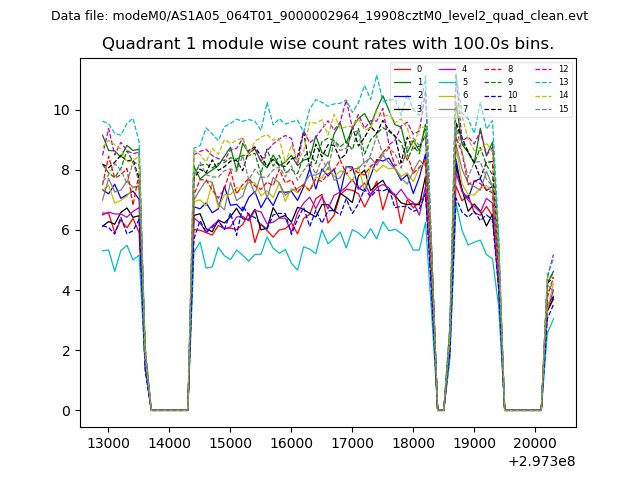
| Module-wise count rates for Quadrant A Data is divided into 100 sec bins |
 |
 |
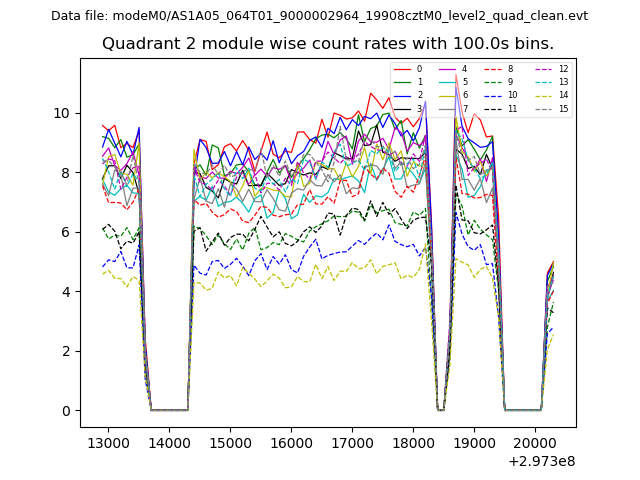
| Module-wise count rates for Quadrant B Data is divided into 100 sec bins |
 |
 |
| Module-wise count rates for Quadrant C Data is divided into 100 sec bins |
 |
 |
| Module-wise count rates for Quadrant D Data is divided into 100 sec bins |
 |
 |
| Parameter | Plot |
|---|---|
| CZT HV Monitor | 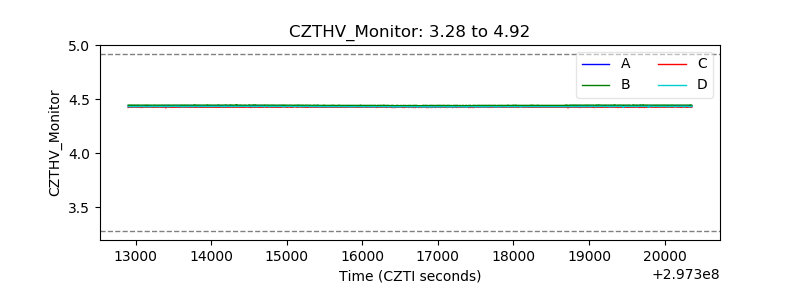 |
| D_VDD | 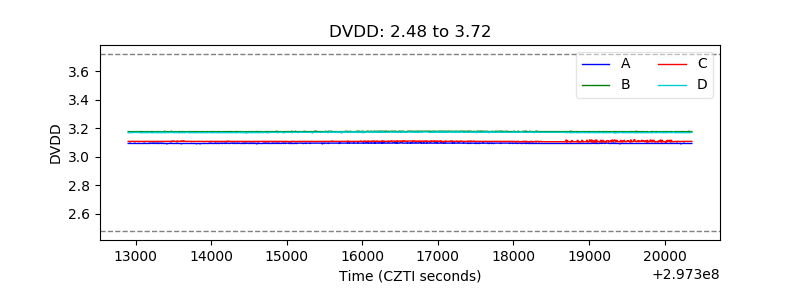 |
| Temperature 1 | 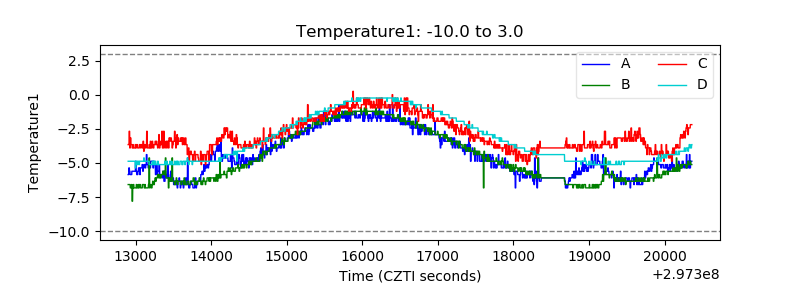 |
| Veto HV Monitor | 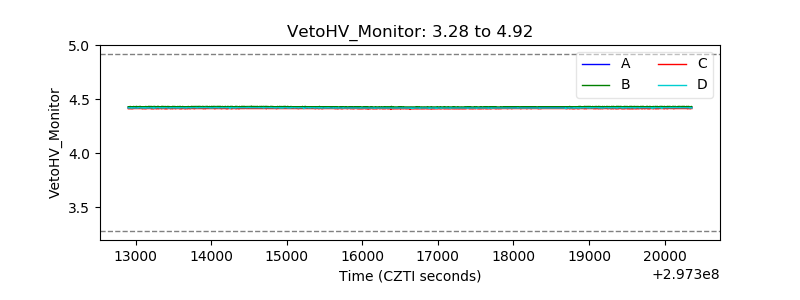 |
| Veto LLD | 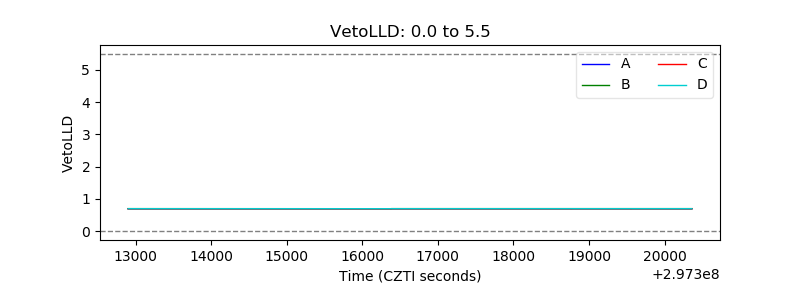 |
| Alpha Counter | 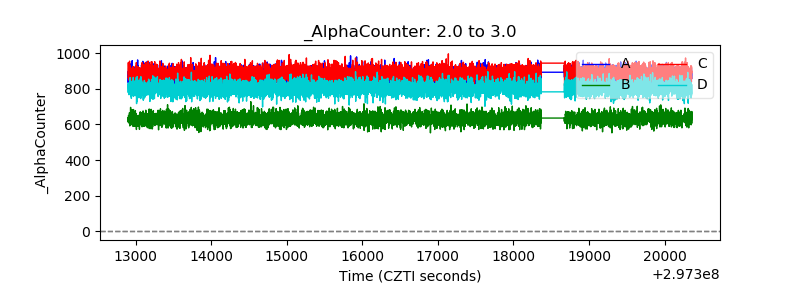 |
| _CPM_Rate | 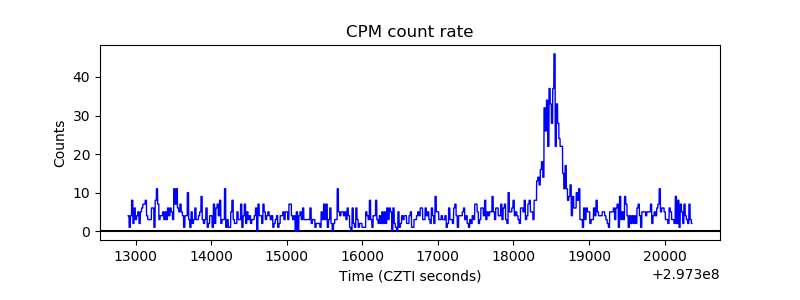 |
| CZT Counter | 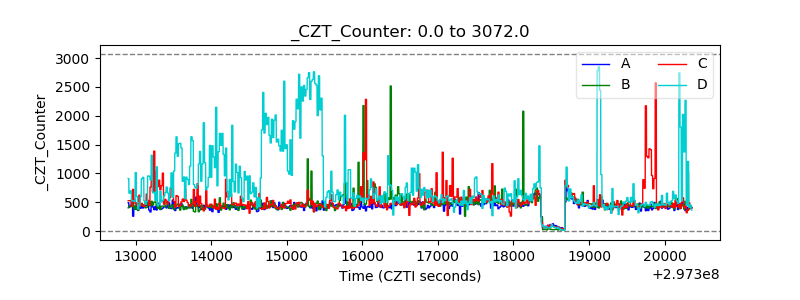 |
| +2.5 Volts monitor |  |
| +5 Volts monitor |  |
| _ROLL_ROT | 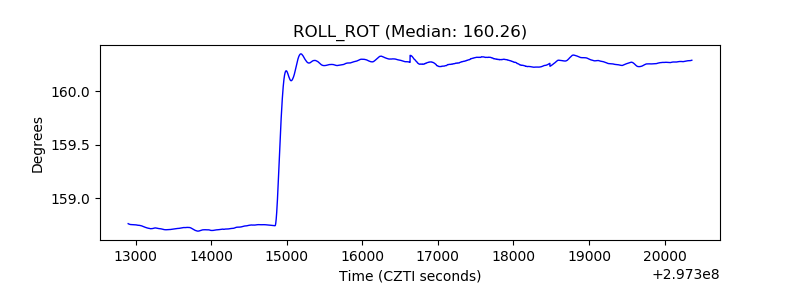 |
| _Roll_DEC | 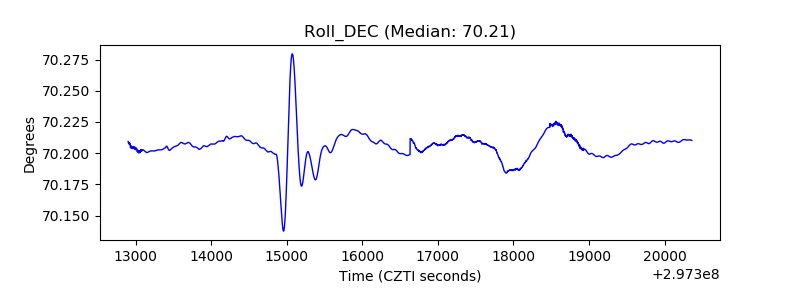 |
| _Roll_RA | 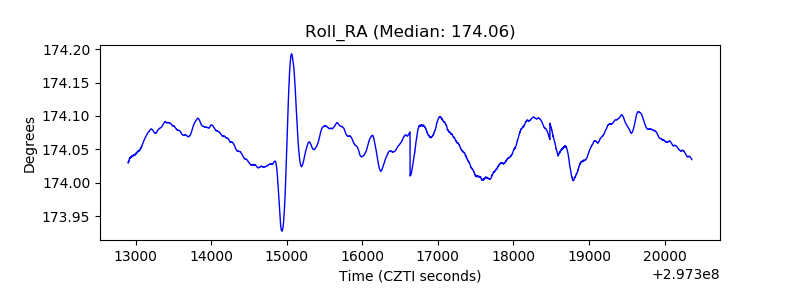 |
| Veto Counter | 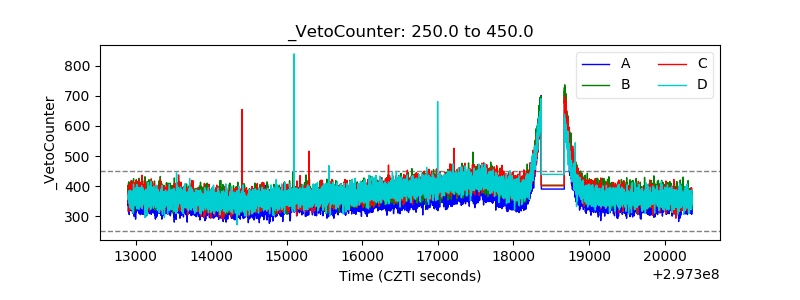 |