| Param | Original file | Final file |
|---|---|---|
| Filename | modeM0/AS1A05_064T01_9000002964_19910cztM0_level2.evt | modeM0/AS1A05_064T01_9000002964_19910cztM0_level2_quad_clean.evt |
| Size (bytes) | 234,383,040 | 27,161,280 |
| Size | 223.5 MB | 25.9 MB |
| Events in quadrant A | 1,012,225 | 185,431 |
| Events in quadrant B | 1,114,577 | 191,078 |
| Events in quadrant C | 1,177,621 | 183,273 |
| Events in quadrant D | 3,628,675 | 89,024 |
| Mode M0 | |||
|---|---|---|---|
| Quadrant | BADHDUFLAG | Total packets | Discarded packets |
| A | 0 | 4793 | 0 |
| B | 0 | 4992 | 0 |
| C | 0 | 5231 | 0 |
| D | 0 | 12380 | 0 |
| Mode SS | |||
|---|---|---|---|
| Quadrant | BADHDUFLAG | Total packets | Discarded packets |
| A | 0 | 48 | 0 |
| B | 0 | 48 | 0 |
| C | 0 | 48 | 0 |
| D | 0 | 48 | 0 |
| Quadrant | Total seconds | Saturated seconds | Saturation percentage |
|---|---|---|---|
| A | 2396 | 1 | 0.041736% |
| B | 2397 | 4 | 0.166875% |
| C | 2397 | 22 | 0.917814% |
| D | 2397 | 1237 | 51.606174% |
Noise dominated data is calculated using 1-second bins in cleaned event files. If a bin has >2000 counts, and if more than 50% of those come from <1% of pixels, then it is considered to be noise-dominated and hence unusable.
| Quadrant | # 1 sec bins | Bins with >0 counts | Bins with >2000 counts | High rate bins dominated by noise | Noise dominated (total time) | Noise dominated (detector-on time) | Marked lightcurve |
|---|---|---|---|---|---|---|---|
| A | 2396 | 2396 | 0 | 0 | 0.00% | 0.00% | 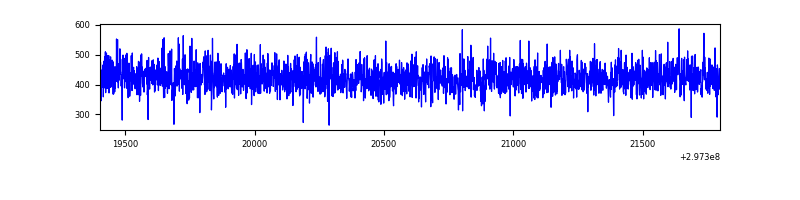 |
| B | 2397 | 2397 | 2 | 2 | 0.08% | 0.08% | 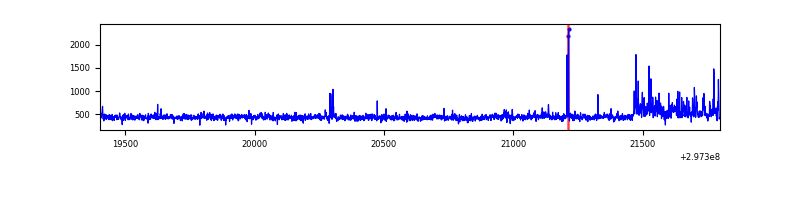 |
| C | 2397 | 2397 | 17 | 17 | 0.71% | 0.71% | 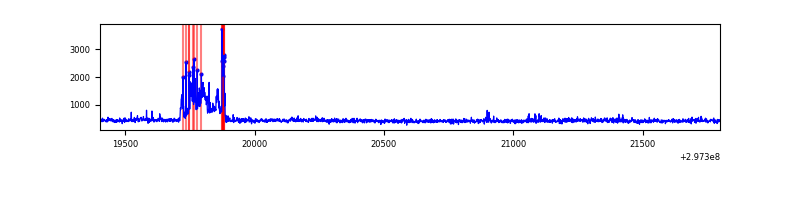 |
| D | 2396 | 2396 | 1051 | 1051 | 43.86% | 43.86% | 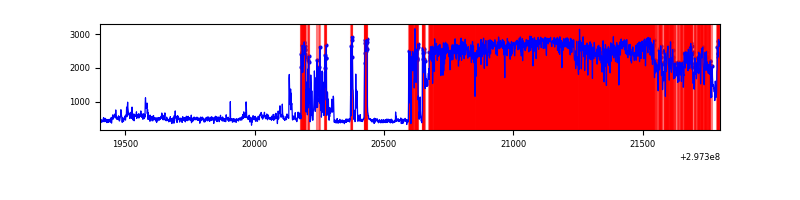 |
Top three noisy pixels from each quadrant. If the there are fewer than three noisy pixels in the level2.evt file, extra rows are filled as -1
| Pixel properties | Quadrant properties | ||||||
|---|---|---|---|---|---|---|---|
| Quadrant | DetID | PixID | Counts | Sigma | Mean | Median | Sigma |
| A | 0 | 226 | 2227 | 35.41 | 263 | 257 | 55.6 |
| A | 3 | 137 | 2203 | 34.97 | 263 | 257 | 55.6 |
| A | 12 | 194 | 1929 | 30.05 | 263 | 257 | 55.6 |
| B | 7 | 220 | 61687 | 1179.12 | 262 | 256 | 52.1 |
| B | 12 | 111 | 6165 | 113.42 | 262 | 256 | 52.1 |
| B | 11 | 111 | 5503 | 100.71 | 262 | 256 | 52.1 |
| C | 9 | 221 | 171482 | 2891.66 | 247 | 248 | 59.2 |
| C | 14 | 238 | 39387 | 660.95 | 247 | 248 | 59.2 |
| C | 13 | 61 | 1831 | 26.73 | 247 | 248 | 59.2 |
| D | 2 | 184 | 2615379 | 58798.95 | 174 | 168 | 44.5 |
| D | 7 | 96 | 284217 | 6386.4 | 174 | 168 | 44.5 |
| D | 12 | 1 | 28311 | 632.75 | 174 | 168 | 44.5 |
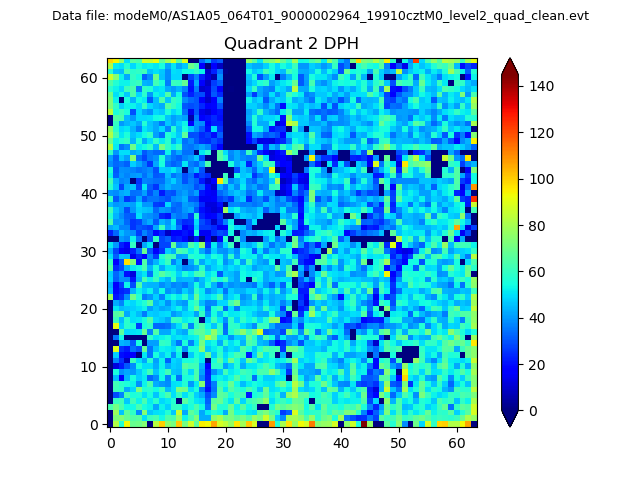
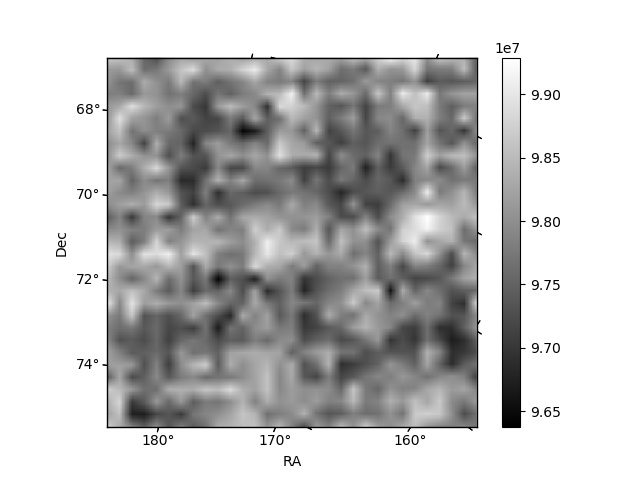
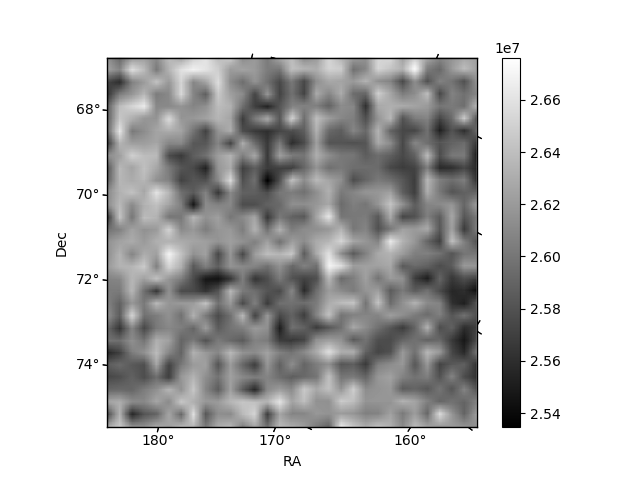
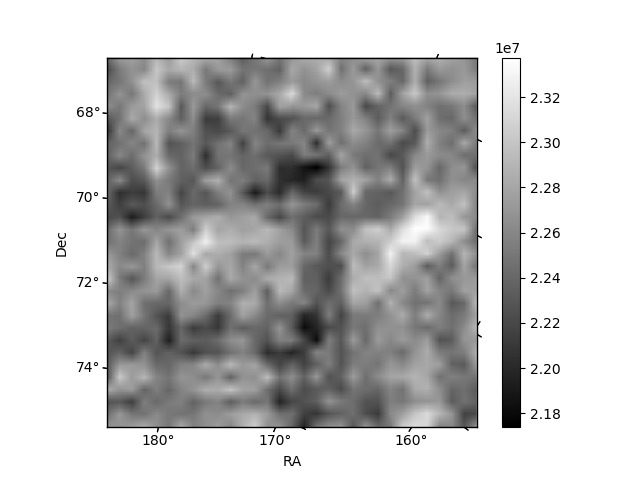
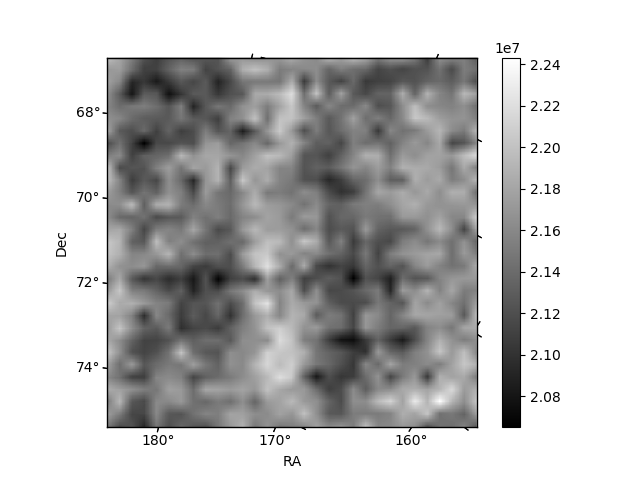
Histogram calculated using DETX and DETY for each event in the final _common_clean file
| Quadrant A | 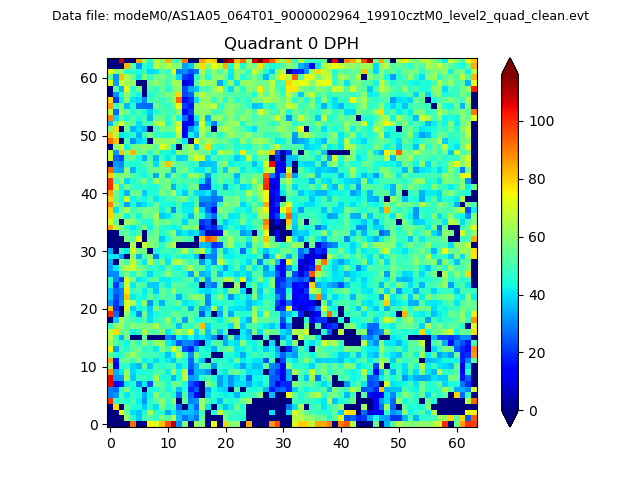 |
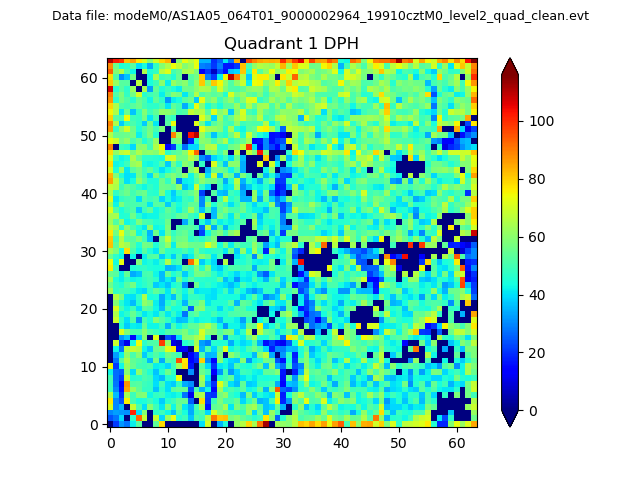 |
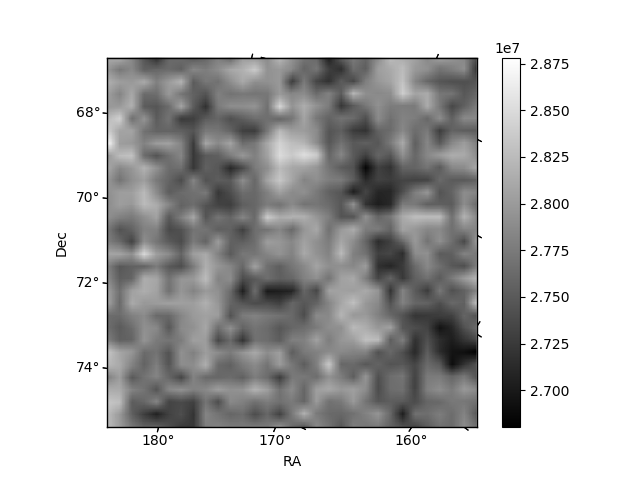
Quadrant B |
|---|---|---|---|
| Quadrant D | 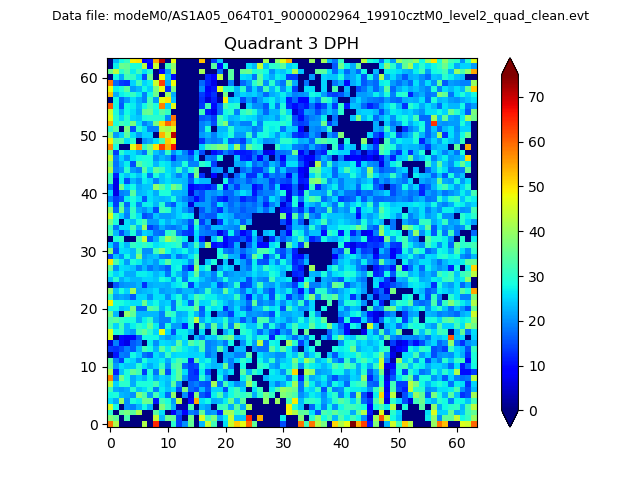 |
 |
Quadrant C |
| Plot type | Count rate plots | Images |
|---|---|---|
| Comparison with Poisson distribution Blue bars denote a histogram of data divided into 1 sec bins. Red curve is a Poisson curve with rate = median count rate of data. |
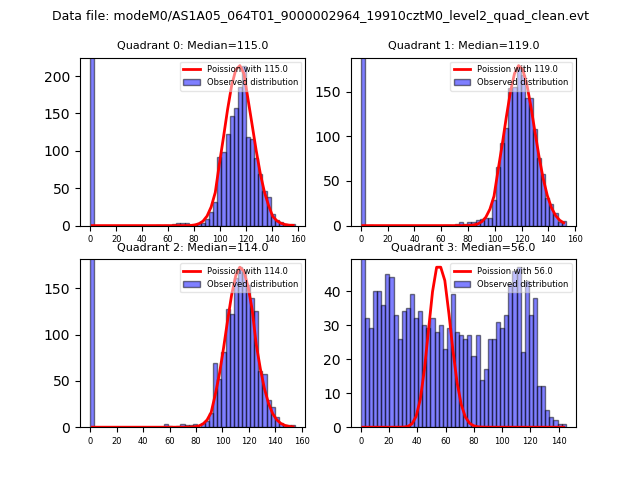 |
 |
| Quadrant-wise count rates Data is divided into 100 sec bins |
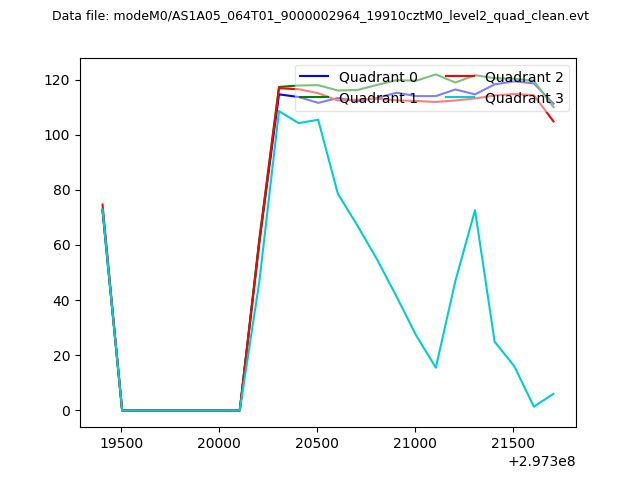 |
|
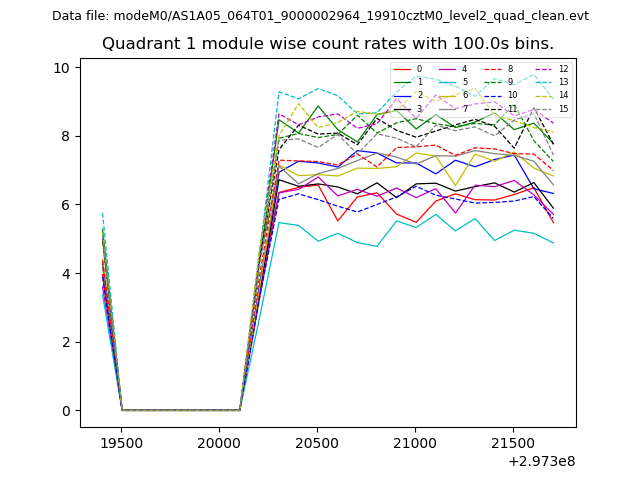
| Module-wise count rates for Quadrant A Data is divided into 100 sec bins |
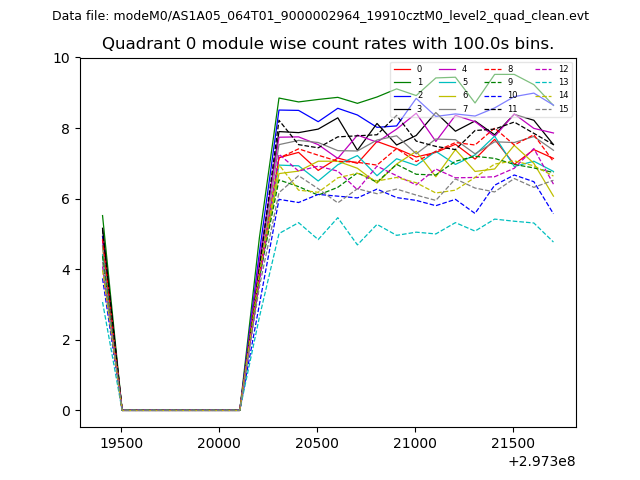 |
 |
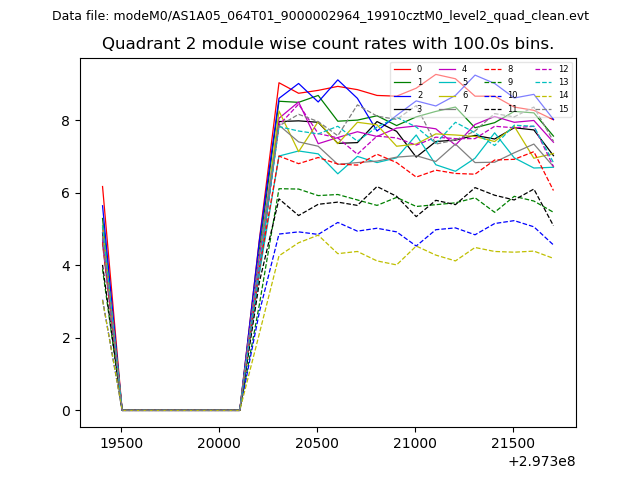
| Module-wise count rates for Quadrant B Data is divided into 100 sec bins |
 |
 |
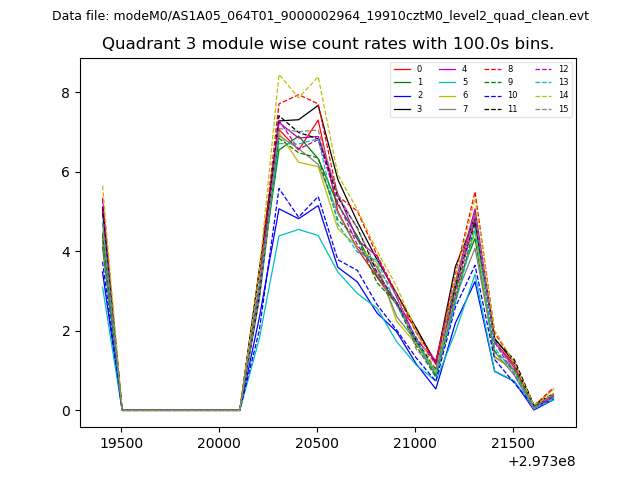
| Module-wise count rates for Quadrant C Data is divided into 100 sec bins |
 |
 |
| Module-wise count rates for Quadrant D Data is divided into 100 sec bins |
 |
 |
| Parameter | Plot |
|---|---|
| CZT HV Monitor | 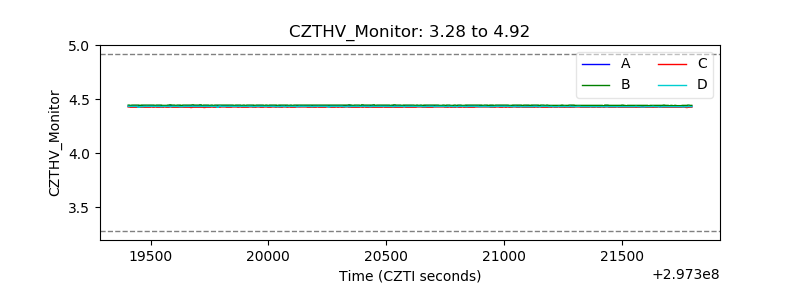 |
| D_VDD | 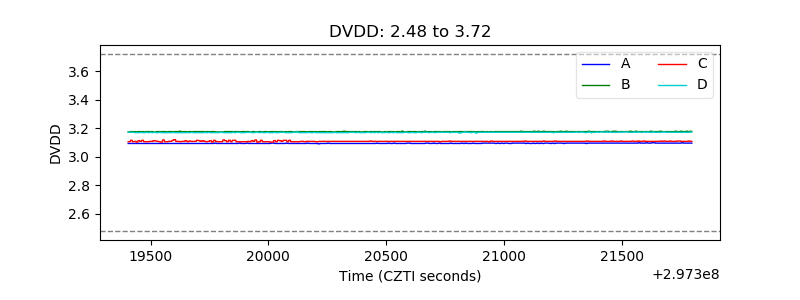 |
| Temperature 1 | 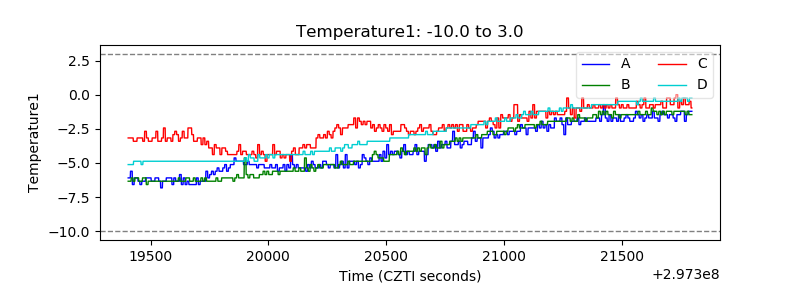 |
| Veto HV Monitor | 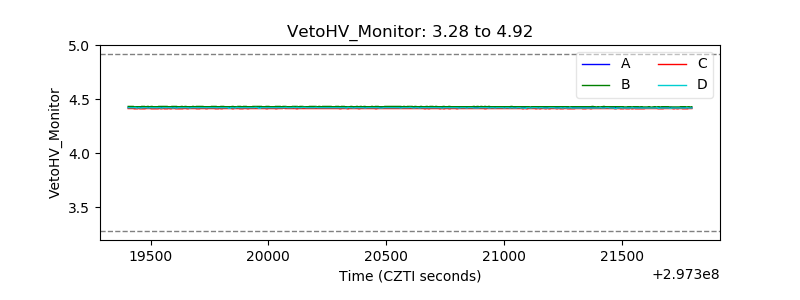 |
| Veto LLD | 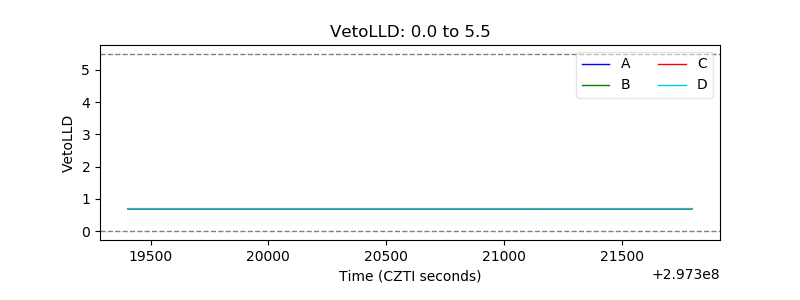 |
| Alpha Counter | 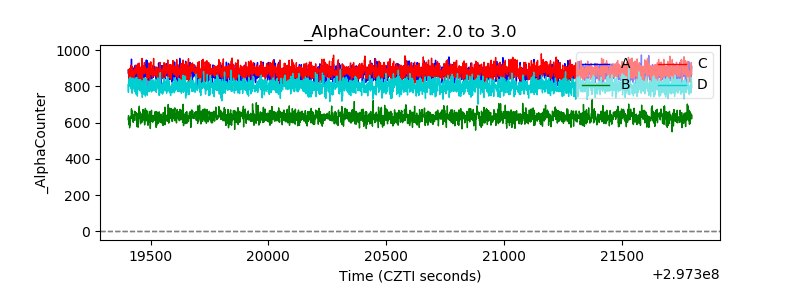 |
| _CPM_Rate | 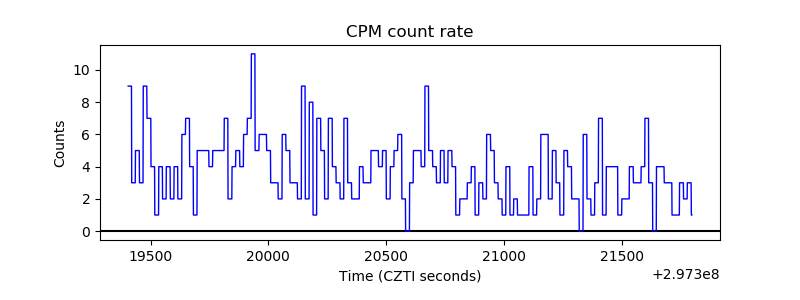 |
| CZT Counter | 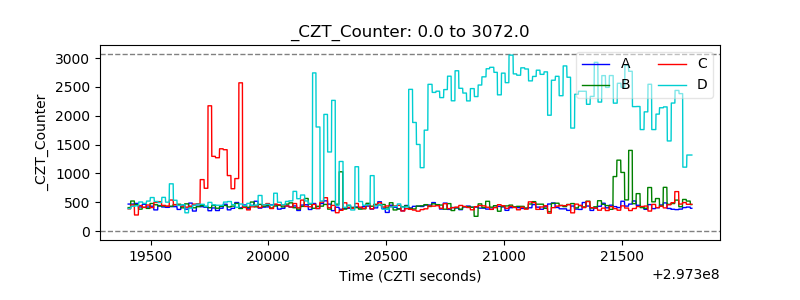 |
| +2.5 Volts monitor |  |
| +5 Volts monitor |  |
| _ROLL_ROT | 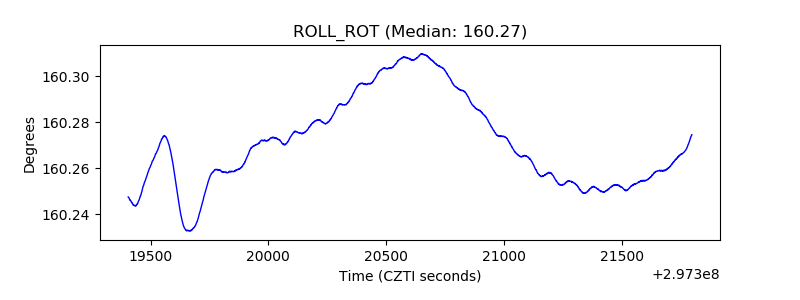 |
| _Roll_DEC | 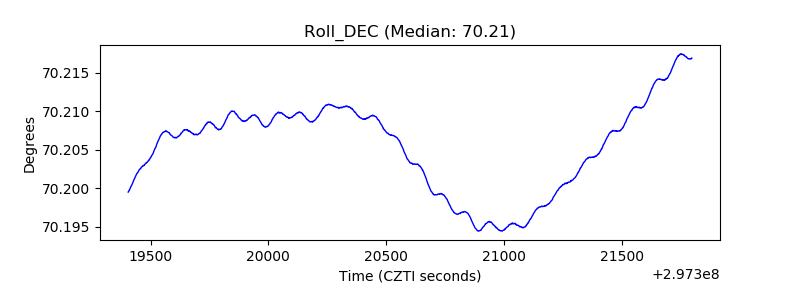 |
| _Roll_RA | 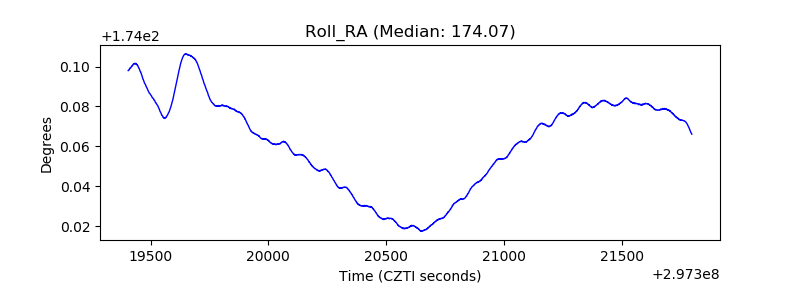 |
| Veto Counter | 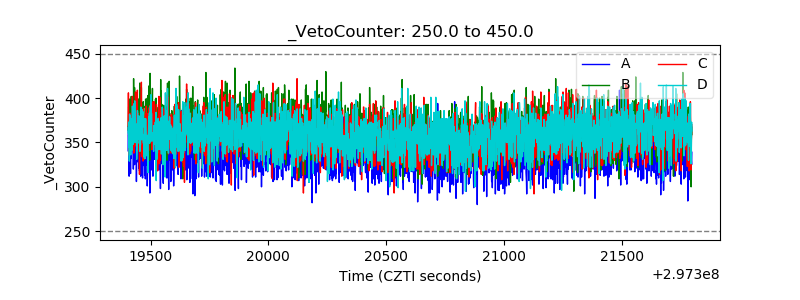 |