| Param | Original file | Final file |
|---|---|---|
| Filename | modeM0/AS1A05_064T01_9000002964_19911cztM0_level2.evt | modeM0/AS1A05_064T01_9000002964_19911cztM0_level2_quad_clean.evt |
| Size (bytes) | 1,586,257,920 | 244,258,560 |
| Size | 1.5 GB | 232.9 MB |
| Events in quadrant A | 7,045,225 | 1,714,115 |
| Events in quadrant B | 8,049,792 | 1,726,065 |
| Events in quadrant C | 7,770,806 | 1,670,666 |
| Events in quadrant D | 24,131,209 | 1,217,956 |
| Mode M0 | |||
|---|---|---|---|
| Quadrant | BADHDUFLAG | Total packets | Discarded packets |
| A | 0 | 31319 | 3 |
| B | 0 | 33611 | 3 |
| C | 0 | 32957 | 3 |
| D | 0 | 82294 | 3 |
| Mode SS | |||
|---|---|---|---|
| Quadrant | BADHDUFLAG | Total packets | Discarded packets |
| A | 0 | 316 | 0 |
| B | 0 | 316 | 0 |
| C | 0 | 316 | 0 |
| D | 0 | 316 | 0 |
| Mode M9 | |||
|---|---|---|---|
| Quadrant | BADHDUFLAG | Total packets | Discarded packets |
| A | 0 | 21 | 0 |
| B | 0 | 21 | 0 |
| C | 0 | 21 | 0 |
| D | 0 | 21 | 0 |
| Quadrant | Total seconds | Saturated seconds | Saturation percentage |
|---|---|---|---|
| A | 15459 | 142 | 0.918559% |
| B | 15459 | 239 | 1.546025% |
| C | 15460 | 234 | 1.513583% |
| D | 15460 | 6634 | 42.910737% |
Noise dominated data is calculated using 1-second bins in cleaned event files. If a bin has >2000 counts, and if more than 50% of those come from <1% of pixels, then it is considered to be noise-dominated and hence unusable.
| Quadrant | # 1 sec bins | Bins with >0 counts | Bins with >2000 counts | High rate bins dominated by noise | Noise dominated (total time) | Noise dominated (detector-on time) | Marked lightcurve |
|---|---|---|---|---|---|---|---|
| A | 17544 | 15459 | 5 | 5 | 0.03% | 0.03% | 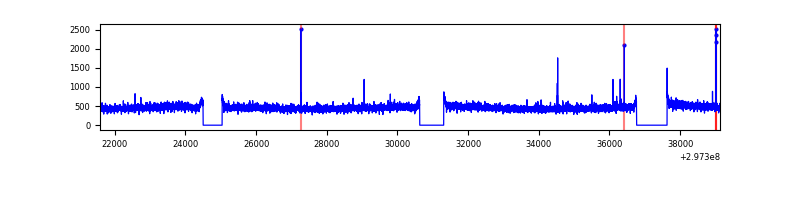 |
| B | 17544 | 15459 | 66 | 66 | 0.38% | 0.43% | 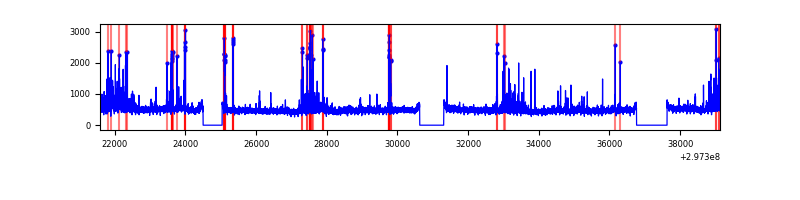 |
| C | 17545 | 15460 | 30 | 30 | 0.17% | 0.19% | 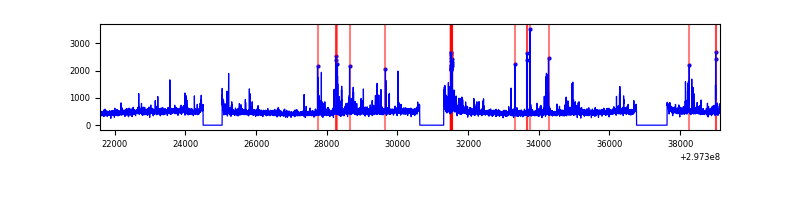 |
| D | 17545 | 15460 | 6054 | 6054 | 34.51% | 39.16% | 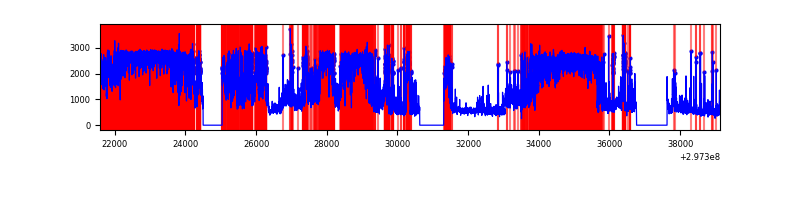 |
Top three noisy pixels from each quadrant. If the there are fewer than three noisy pixels in the level2.evt file, extra rows are filled as -1
| Pixel properties | Quadrant properties | ||||||
|---|---|---|---|---|---|---|---|
| Quadrant | DetID | PixID | Counts | Sigma | Mean | Median | Sigma |
| A | 0 | 226 | 15890 | 38.8 | 1818 | 1779 | 363.7 |
| A | 5 | 16 | 15086 | 36.59 | 1818 | 1779 | 363.7 |
| A | 3 | 137 | 14184 | 34.11 | 1818 | 1779 | 363.7 |
| B | 7 | 220 | 483667 | 1422.96 | 1812 | 1767 | 338.7 |
| B | 0 | 230 | 89811 | 259.98 | 1812 | 1767 | 338.7 |
| B | 0 | 197 | 78471 | 226.49 | 1812 | 1767 | 338.7 |
| C | 9 | 221 | 595642 | 1455.85 | 1750 | 1758 | 407.9 |
| C | 14 | 238 | 272944 | 664.79 | 1750 | 1758 | 407.9 |
| C | 0 | 207 | 58392 | 138.83 | 1750 | 1758 | 407.9 |
| D | 2 | 184 | 9463162 | 27521.96 | 1426 | 1384 | 343.8 |
| D | 7 | 38 | 6605827 | 19210.68 | 1426 | 1384 | 343.8 |
| D | 1 | 52 | 1622401 | 4715.14 | 1426 | 1384 | 343.8 |
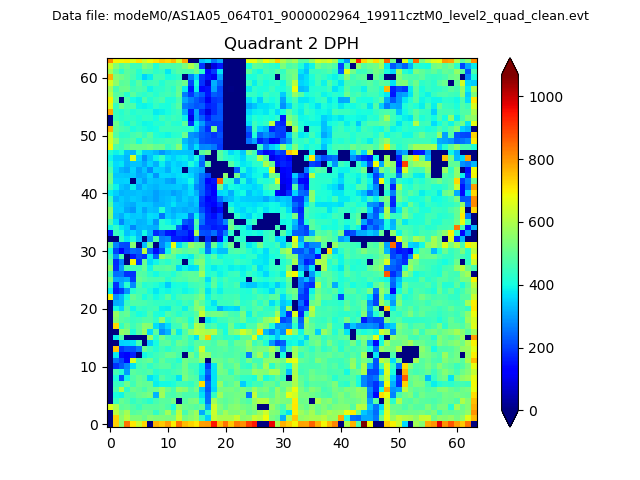
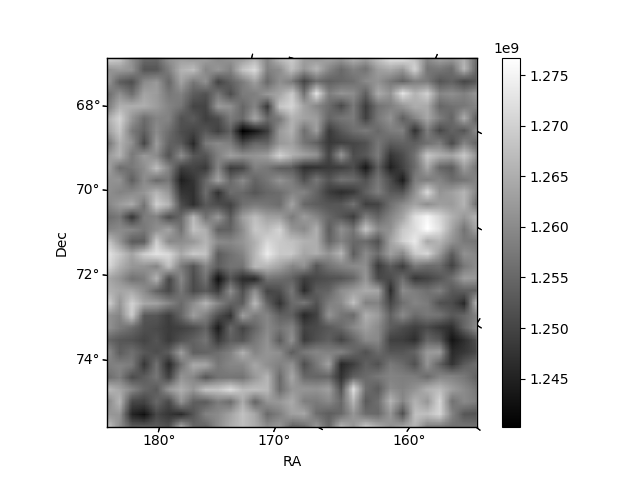
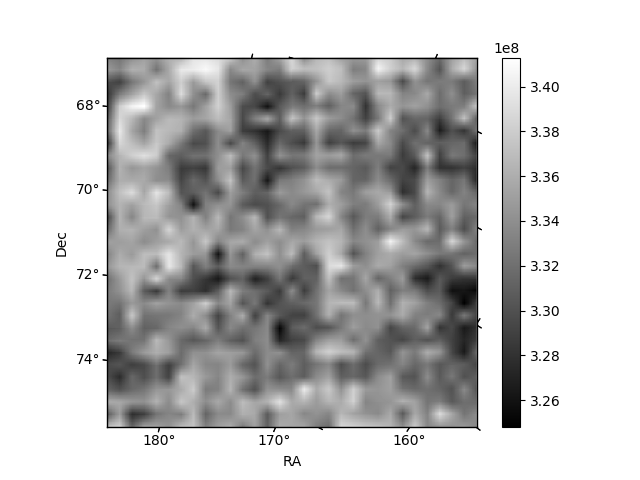
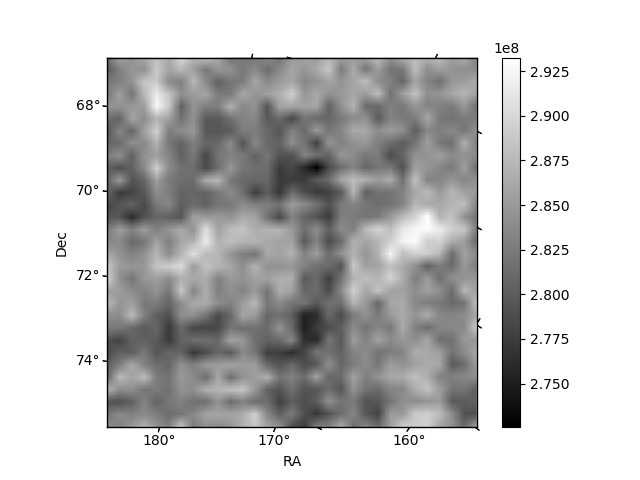
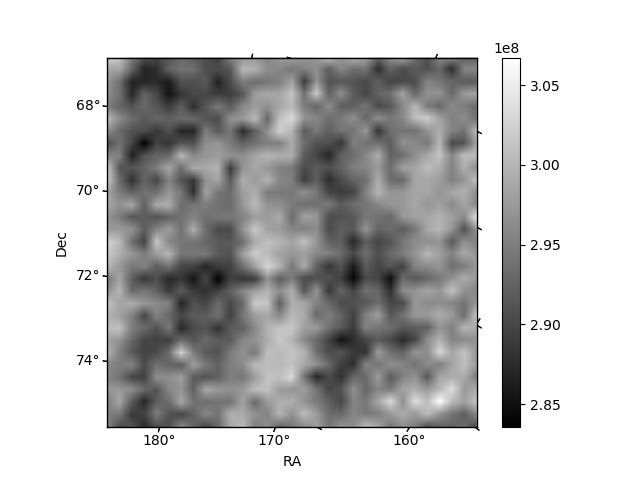
Histogram calculated using DETX and DETY for each event in the final _common_clean file
| Quadrant A | 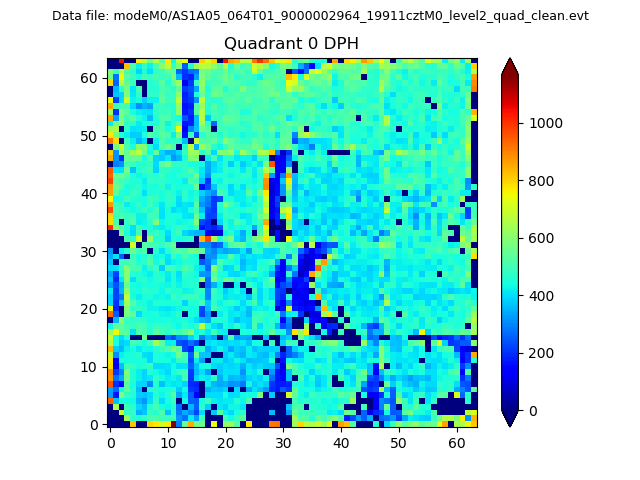 |
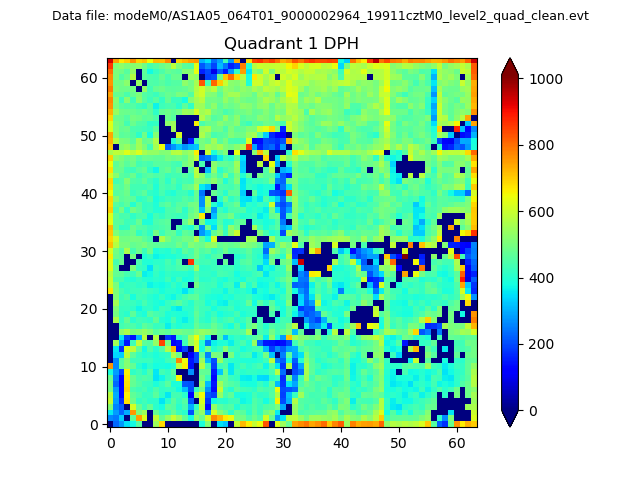 |
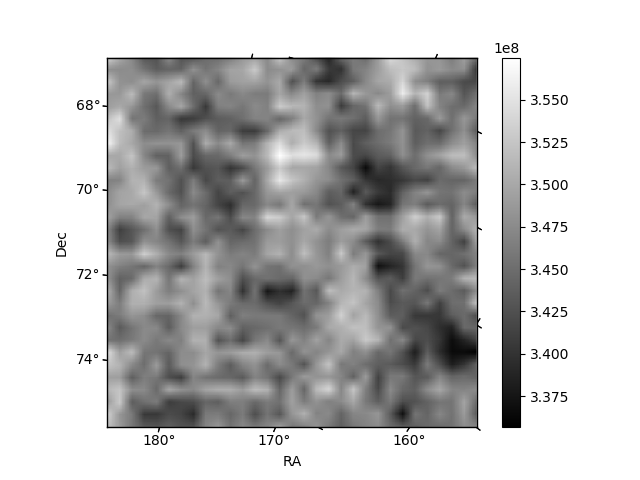
Quadrant B |
|---|---|---|---|
| Quadrant D | 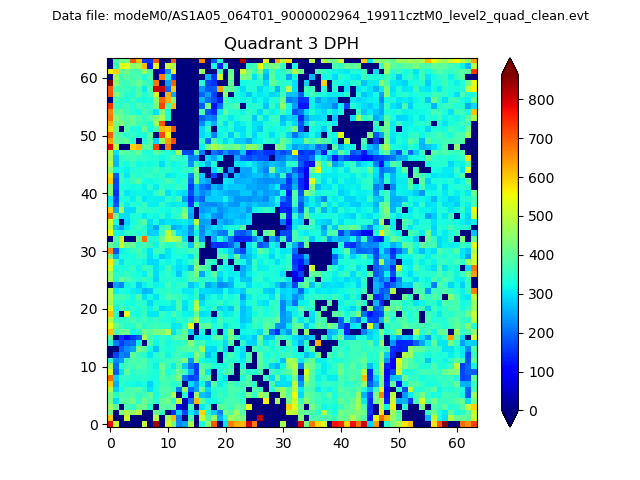 |
 |
Quadrant C |
| Plot type | Count rate plots | Images |
|---|---|---|
| Comparison with Poisson distribution Blue bars denote a histogram of data divided into 1 sec bins. Red curve is a Poisson curve with rate = median count rate of data. |
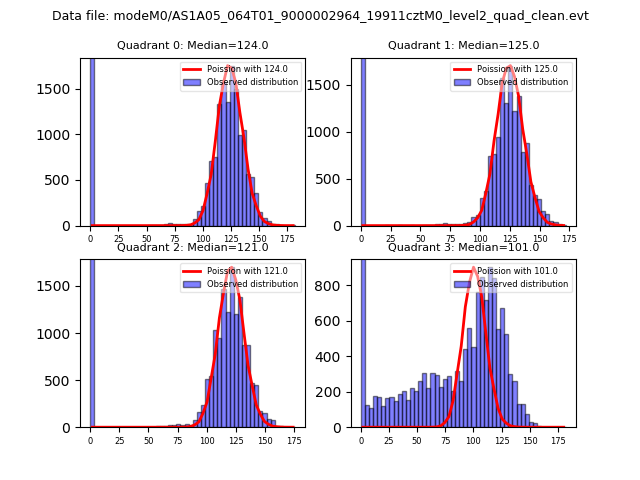 |
 |
| Quadrant-wise count rates Data is divided into 100 sec bins |
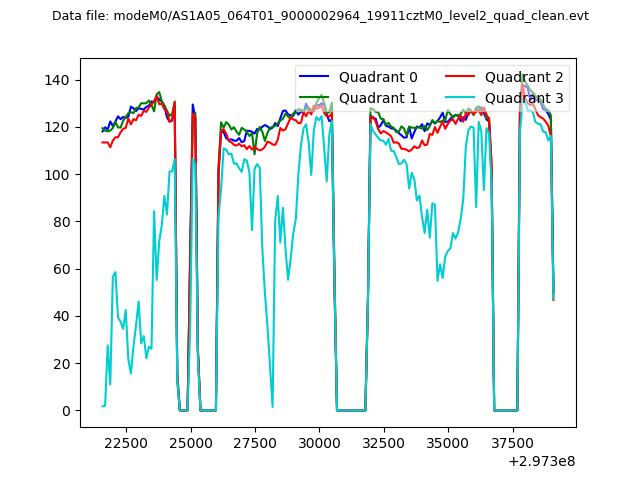 |
|
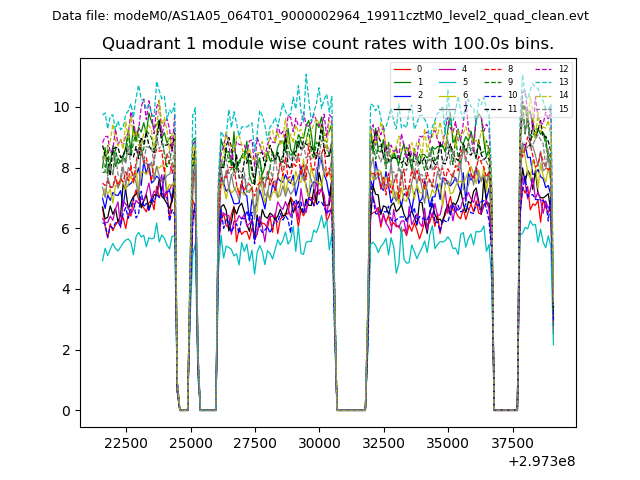
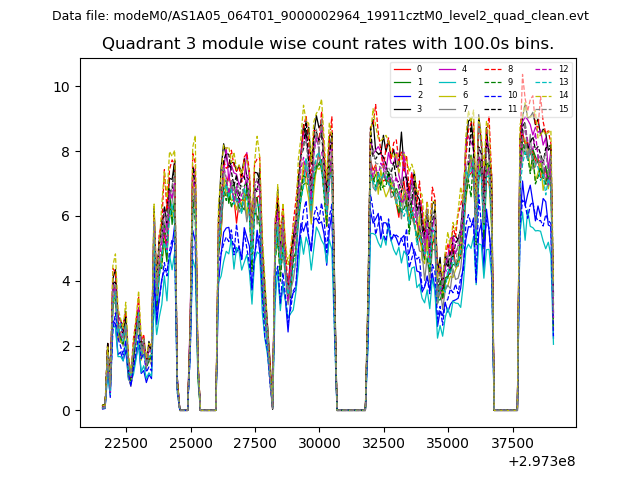
| Module-wise count rates for Quadrant A Data is divided into 100 sec bins |
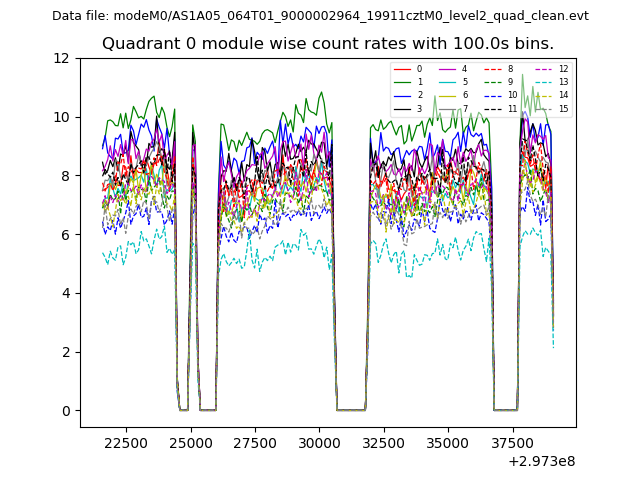 |
 |
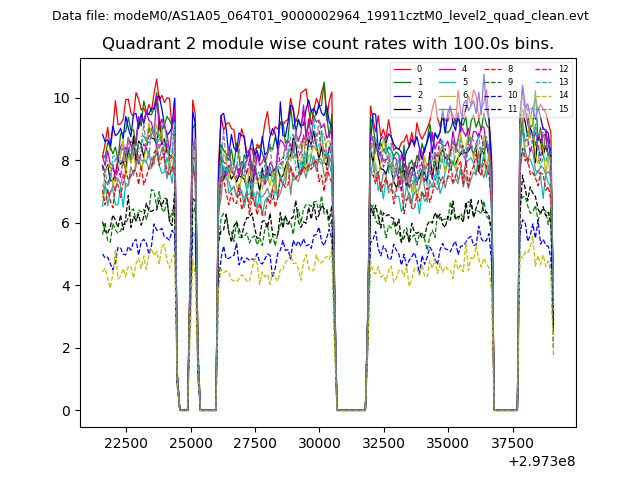
| Module-wise count rates for Quadrant B Data is divided into 100 sec bins |
 |
 |
| Module-wise count rates for Quadrant C Data is divided into 100 sec bins |
 |
 |
| Module-wise count rates for Quadrant D Data is divided into 100 sec bins |
 |
 |
| Parameter | Plot |
|---|---|
| CZT HV Monitor | 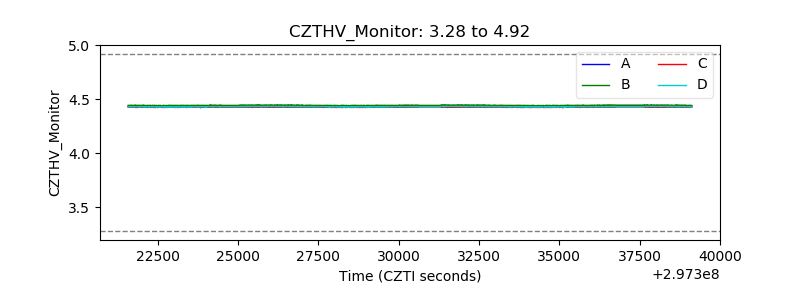 |
| D_VDD | 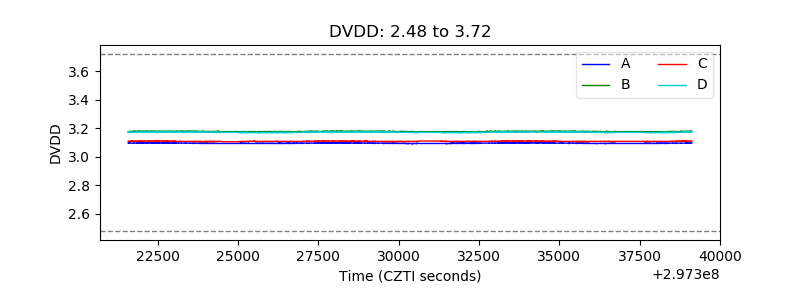 |
| Temperature 1 | 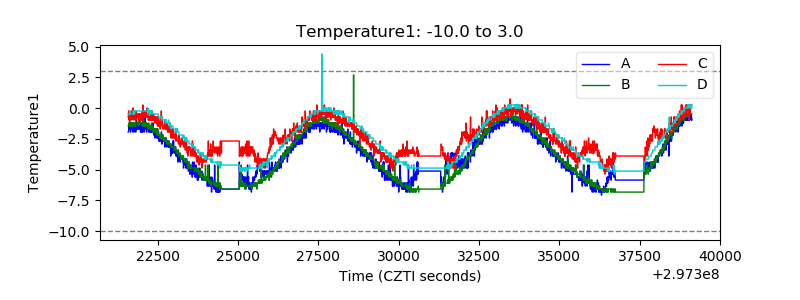 |
| Veto HV Monitor | 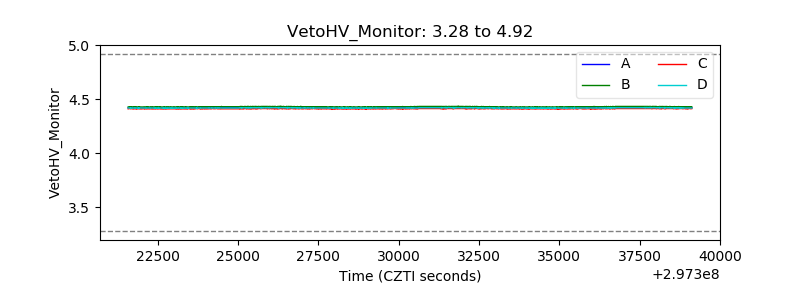 |
| Veto LLD | 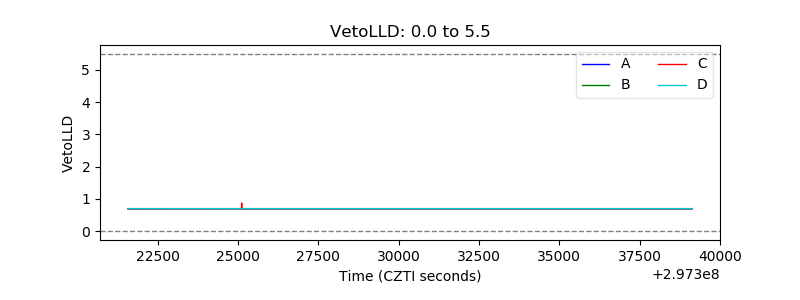 |
| Alpha Counter | 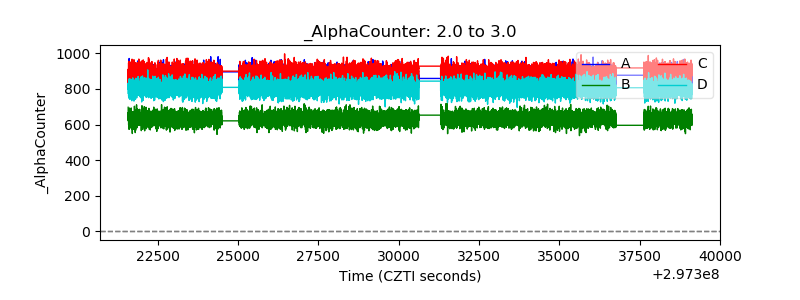 |
| _CPM_Rate | 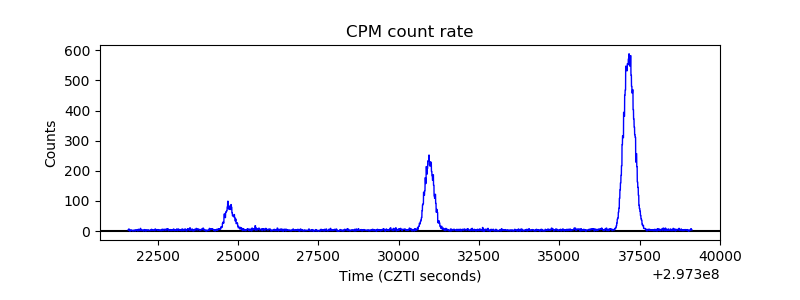 |
| CZT Counter | 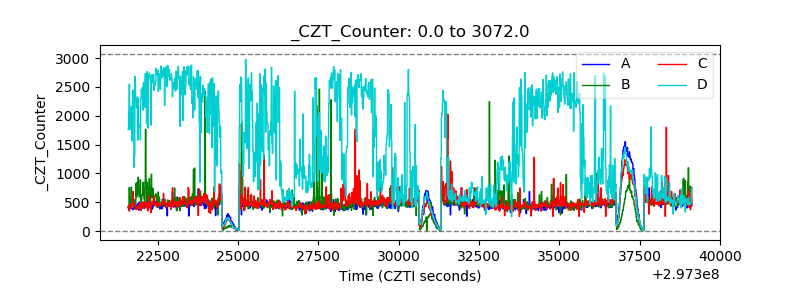 |
| +2.5 Volts monitor | 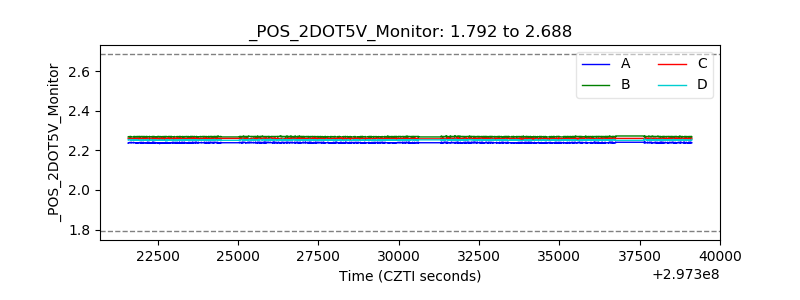 |
| +5 Volts monitor |  |
| _ROLL_ROT | 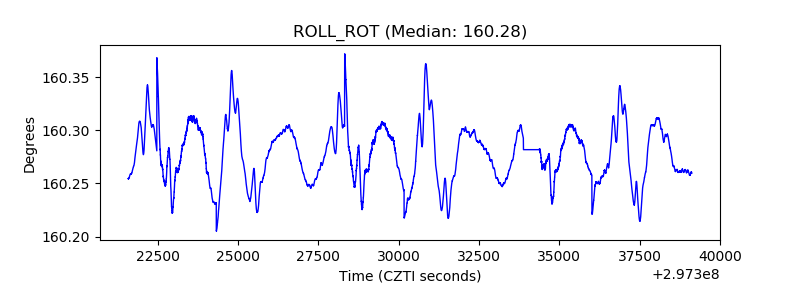 |
| _Roll_DEC | 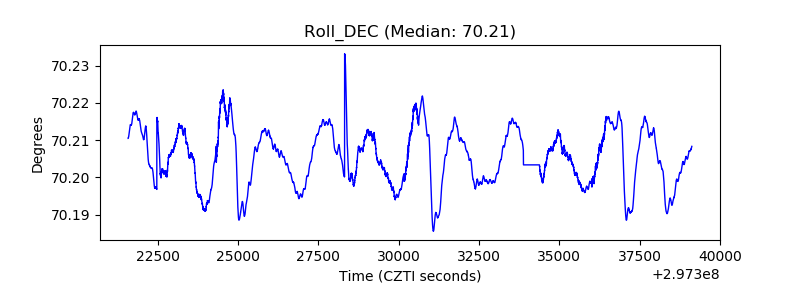 |
| _Roll_RA | 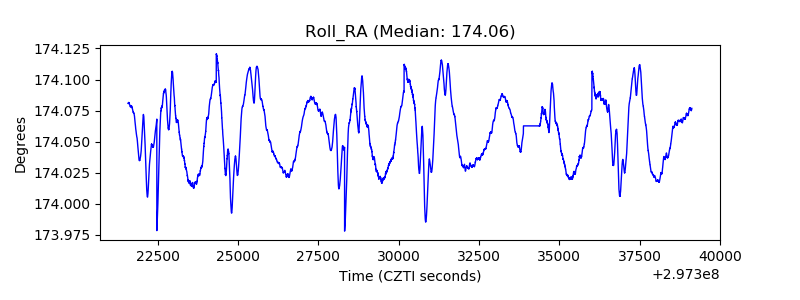 |
| Veto Counter | 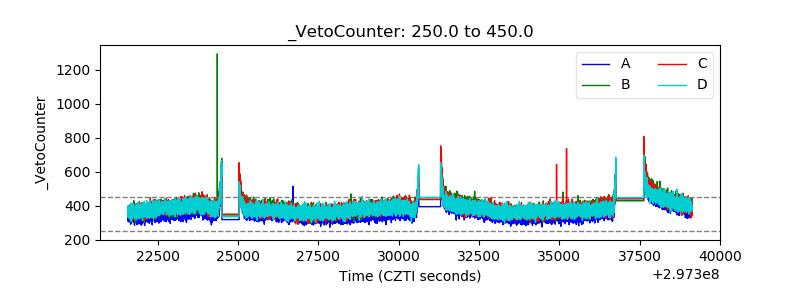 |