| Param | Original file | Final file |
|---|---|---|
| Filename | modeM0/AS1A05_064T01_9000002964_19912cztM0_level2.evt | modeM0/AS1A05_064T01_9000002964_19912cztM0_level2_quad_clean.evt |
| Size (bytes) | 533,908,800 | 119,707,200 |
| Size | 509.2 MB | 114.2 MB |
| Events in quadrant A | 3,063,143 | 823,654 |
| Events in quadrant B | 4,067,917 | 817,829 |
| Events in quadrant C | 3,483,001 | 791,721 |
| Events in quadrant D | 5,122,004 | 746,321 |
| Mode M0 | |||
|---|---|---|---|
| Quadrant | BADHDUFLAG | Total packets | Discarded packets |
| A | 0 | 13351 | 1 |
| B | 0 | 16311 | 1 |
| C | 0 | 14350 | 1 |
| D | 0 | 19561 | 5 |
| Mode SS | |||
|---|---|---|---|
| Quadrant | BADHDUFLAG | Total packets | Discarded packets |
| A | 0 | 130 | 0 |
| B | 0 | 130 | 0 |
| C | 0 | 130 | 0 |
| D | 0 | 130 | 0 |
| Mode M9 | |||
|---|---|---|---|
| Quadrant | BADHDUFLAG | Total packets | Discarded packets |
| A | 0 | 10 | 0 |
| B | 0 | 10 | 0 |
| C | 0 | 10 | 0 |
| D | 0 | 10 | 0 |
| Quadrant | Total seconds | Saturated seconds | Saturation percentage |
|---|---|---|---|
| A | 6392 | 62 | 0.969962% |
| B | 6393 | 115 | 1.798842% |
| C | 6393 | 109 | 1.704990% |
| D | 6392 | 520 | 8.135169% |
Noise dominated data is calculated using 1-second bins in cleaned event files. If a bin has >2000 counts, and if more than 50% of those come from <1% of pixels, then it is considered to be noise-dominated and hence unusable.
| Quadrant | # 1 sec bins | Bins with >0 counts | Bins with >2000 counts | High rate bins dominated by noise | Noise dominated (total time) | Noise dominated (detector-on time) | Marked lightcurve |
|---|---|---|---|---|---|---|---|
| A | 7392 | 6392 | 9 | 9 | 0.12% | 0.14% | 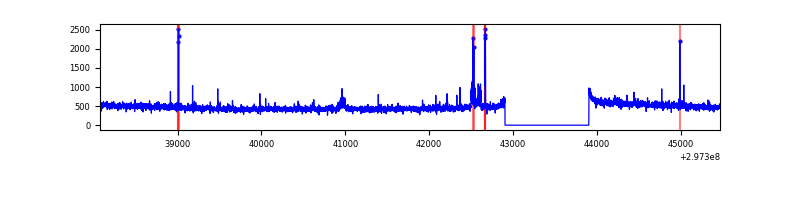 |
| B | 7393 | 6393 | 43 | 43 | 0.58% | 0.67% | 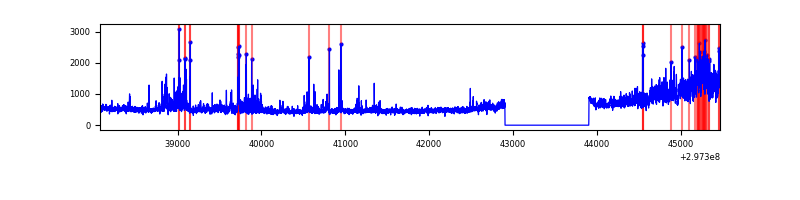 |
| C | 7393 | 6393 | 34 | 34 | 0.46% | 0.53% | 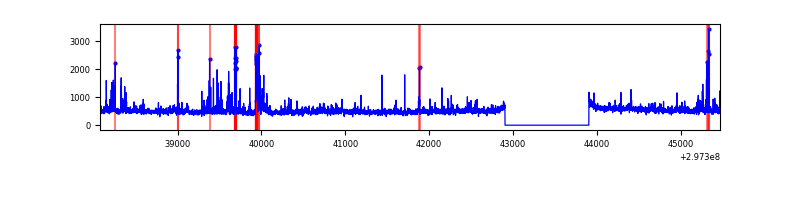 |
| D | 7391 | 6391 | 459 | 459 | 6.21% | 7.18% | 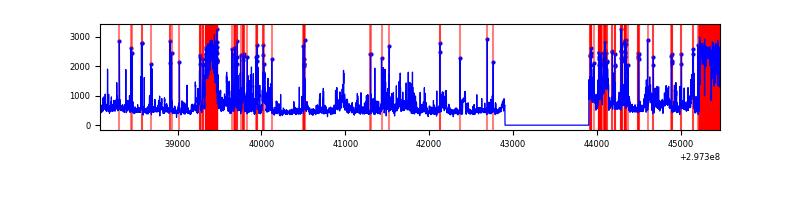 |
Top three noisy pixels from each quadrant. If the there are fewer than three noisy pixels in the level2.evt file, extra rows are filled as -1
| Pixel properties | Quadrant properties | ||||||
|---|---|---|---|---|---|---|---|
| Quadrant | DetID | PixID | Counts | Sigma | Mean | Median | Sigma |
| A | 5 | 16 | 58046 | 369.12 | 771 | 755 | 155.2 |
| A | 9 | 143 | 15686 | 96.2 | 771 | 755 | 155.2 |
| A | 14 | 238 | 11788 | 71.09 | 771 | 755 | 155.2 |
| B | 3 | 112 | 700076 | 4919.24 | 761 | 744 | 142.2 |
| B | 7 | 220 | 103236 | 720.95 | 761 | 744 | 142.2 |
| B | 0 | 190 | 74098 | 515.99 | 761 | 744 | 142.2 |
| C | 9 | 221 | 468171 | 2744.22 | 734 | 737 | 170.3 |
| C | 14 | 238 | 113056 | 659.4 | 734 | 737 | 170.3 |
| C | 0 | 207 | 17376 | 97.68 | 734 | 737 | 170.3 |
| D | 7 | 38 | 1079194 | 6107.27 | 724 | 702 | 176.6 |
| D | 12 | 225 | 408102 | 2307.02 | 724 | 702 | 176.6 |
| D | 12 | 218 | 299175 | 1690.19 | 724 | 702 | 176.6 |
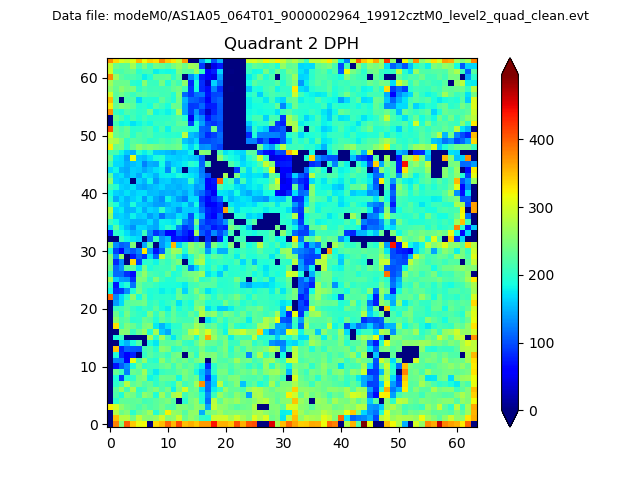
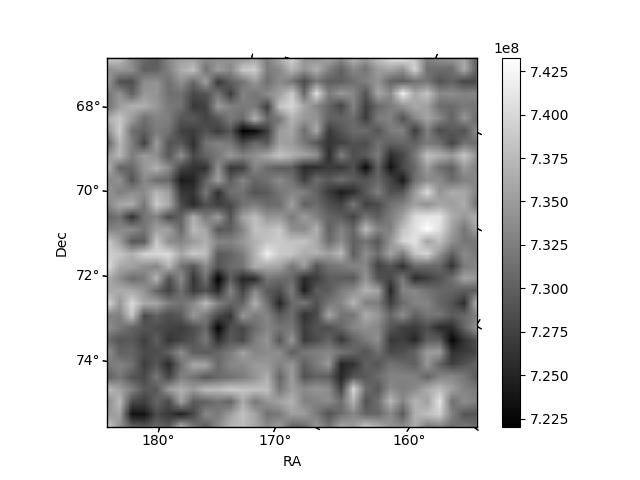
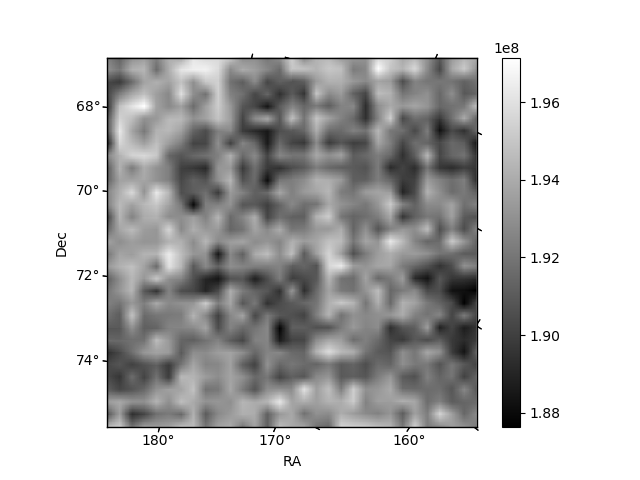
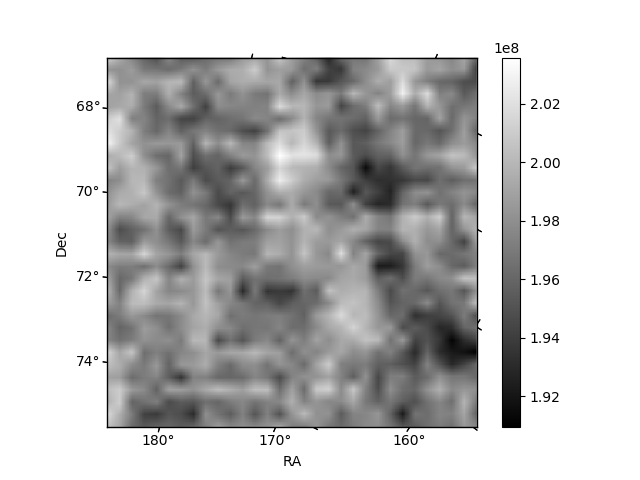
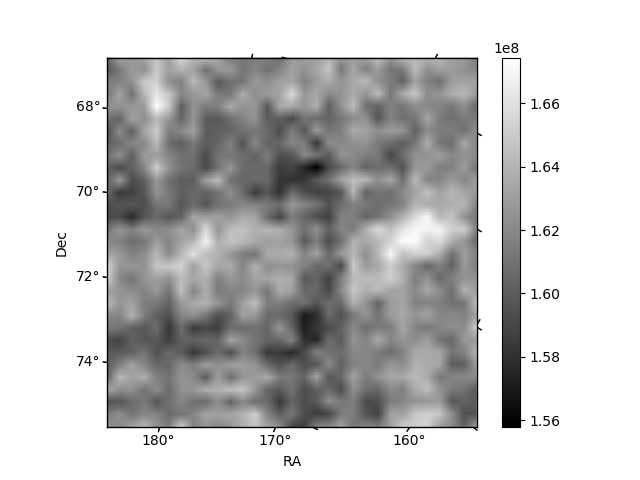
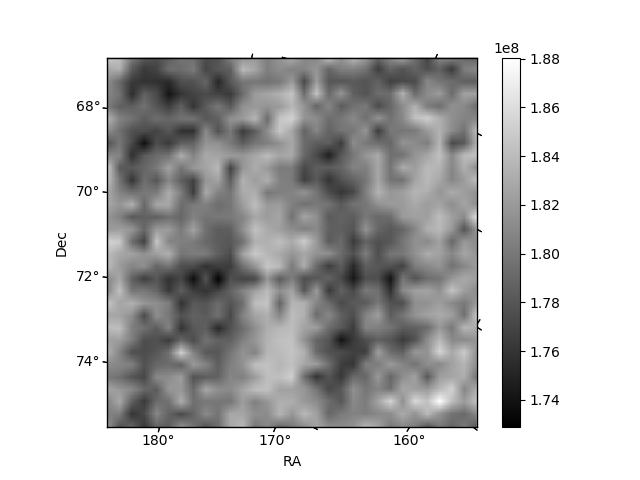
Histogram calculated using DETX and DETY for each event in the final _common_clean file
| Quadrant A | 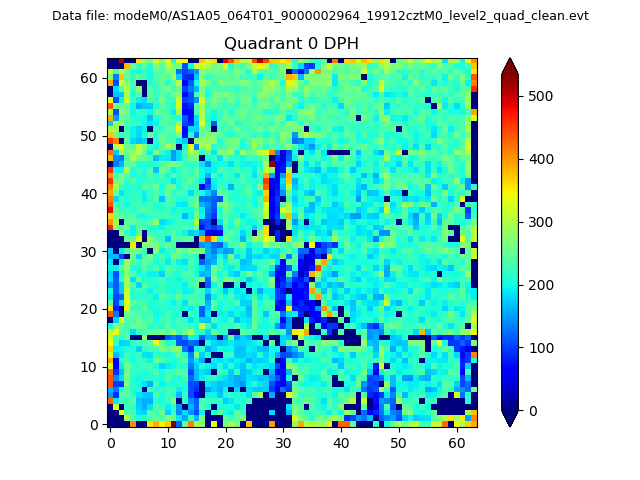 |
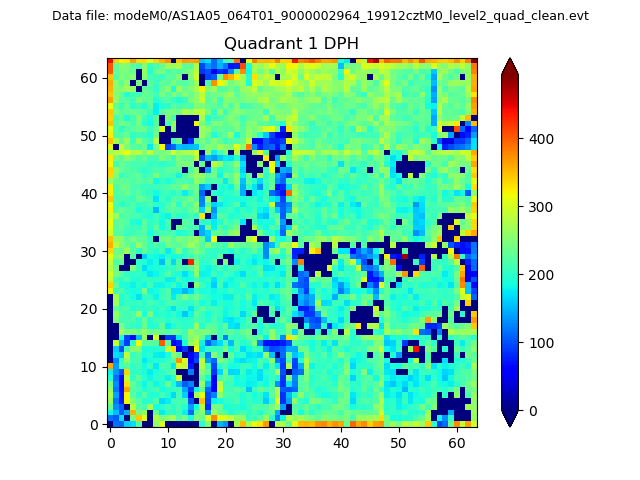 |
Quadrant B |
|---|---|---|---|
| Quadrant D | 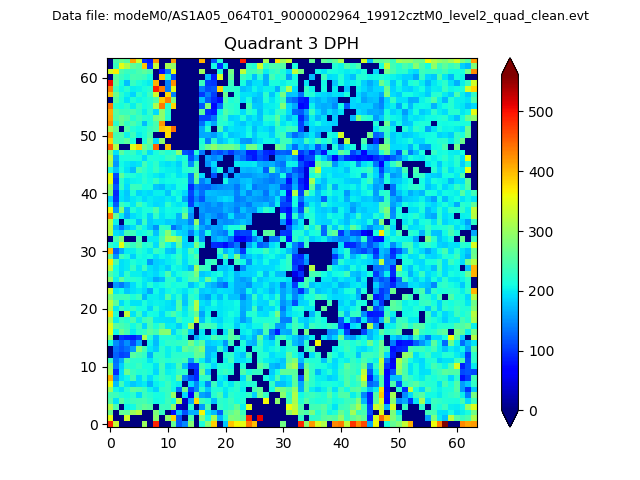 |
 |
Quadrant C |
| Plot type | Count rate plots | Images |
|---|---|---|
| Comparison with Poisson distribution Blue bars denote a histogram of data divided into 1 sec bins. Red curve is a Poisson curve with rate = median count rate of data. |
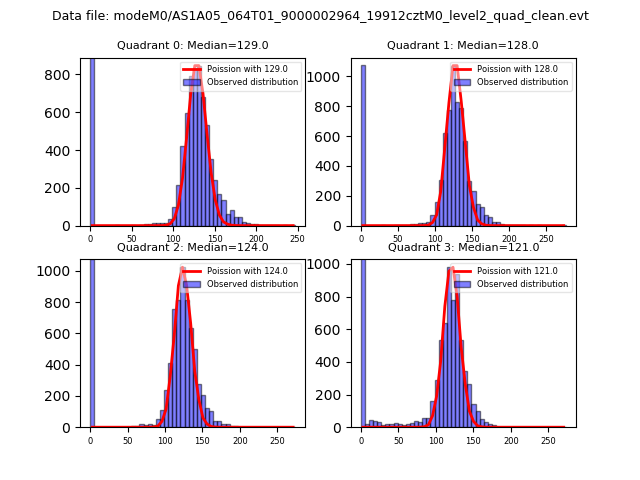 |
 |
| Quadrant-wise count rates Data is divided into 100 sec bins |
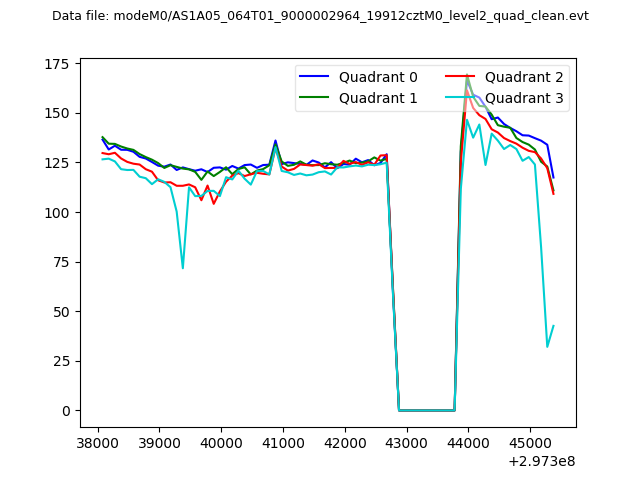 |
|
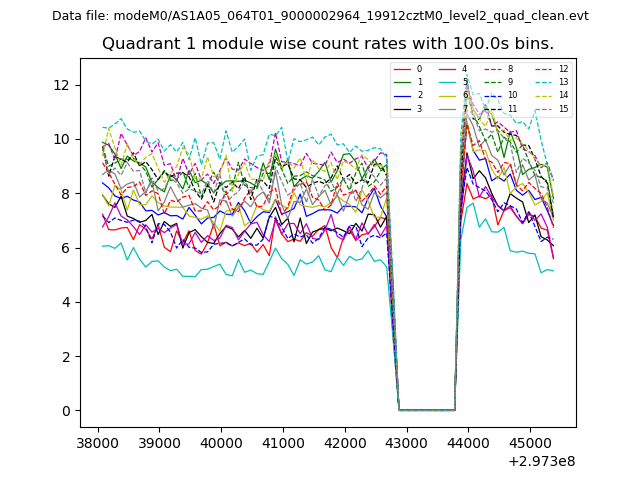
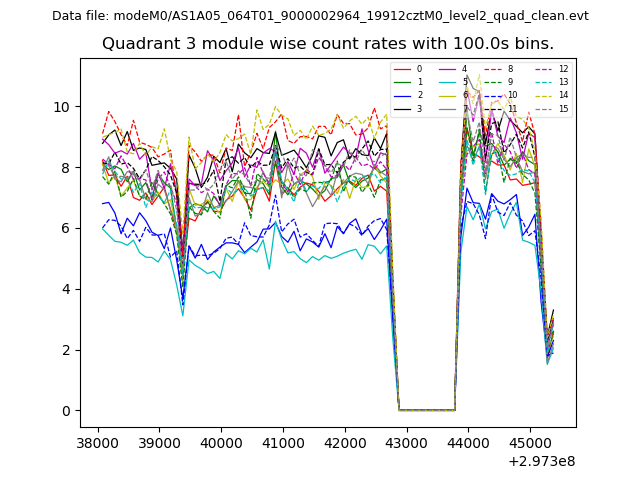
| Module-wise count rates for Quadrant A Data is divided into 100 sec bins |
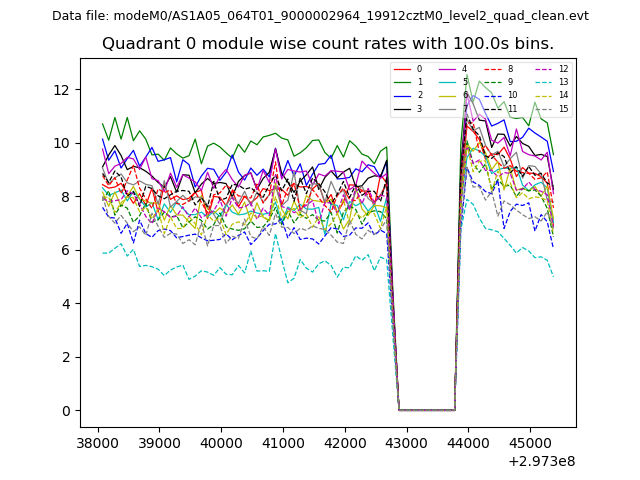 |
 |
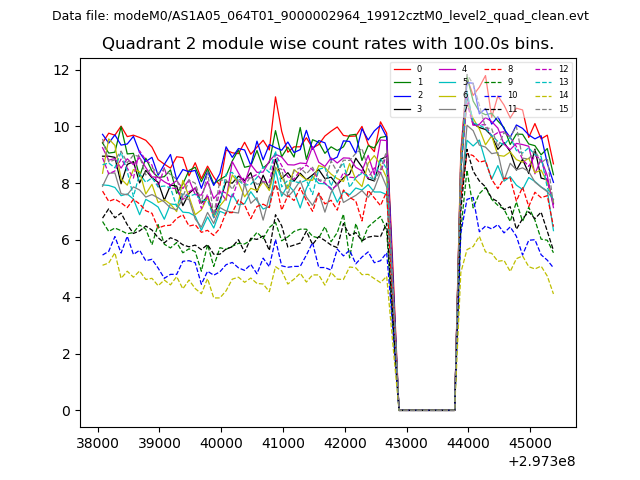
| Module-wise count rates for Quadrant B Data is divided into 100 sec bins |
 |
 |
| Module-wise count rates for Quadrant C Data is divided into 100 sec bins |
 |
 |
| Module-wise count rates for Quadrant D Data is divided into 100 sec bins |
 |
 |
| Parameter | Plot |
|---|---|
| CZT HV Monitor | 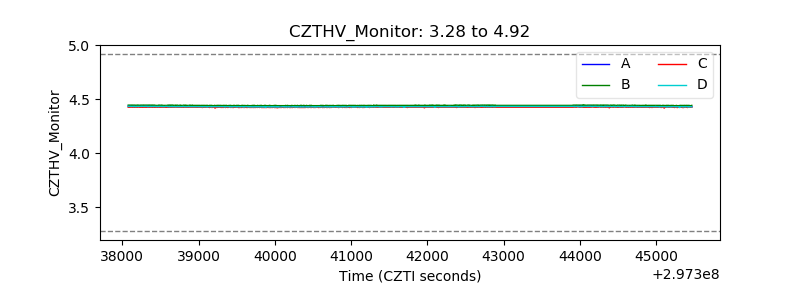 |
| D_VDD | 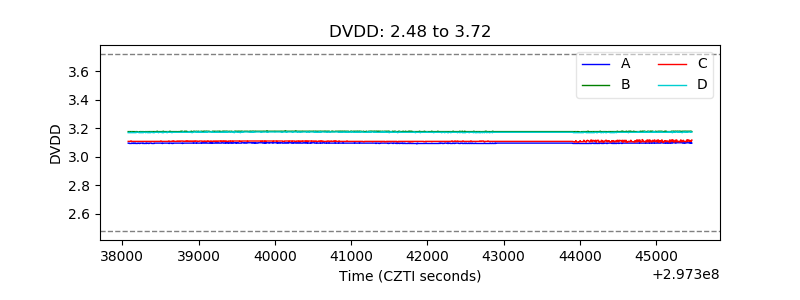 |
| Temperature 1 |  |
| Veto HV Monitor | 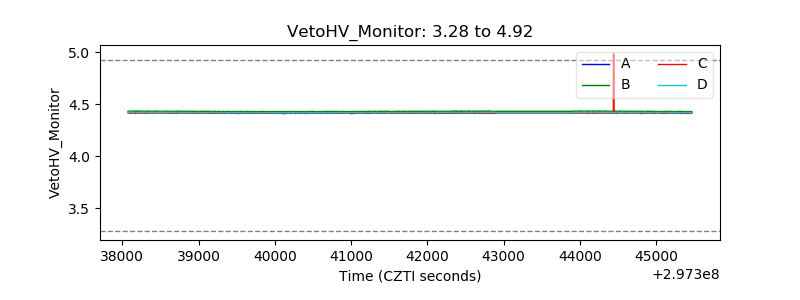 |
| Veto LLD | 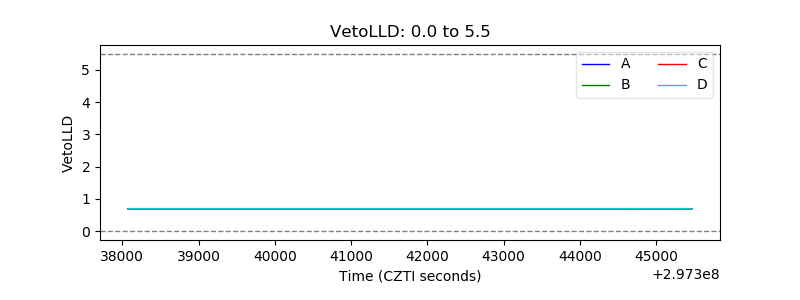 |
| Alpha Counter | 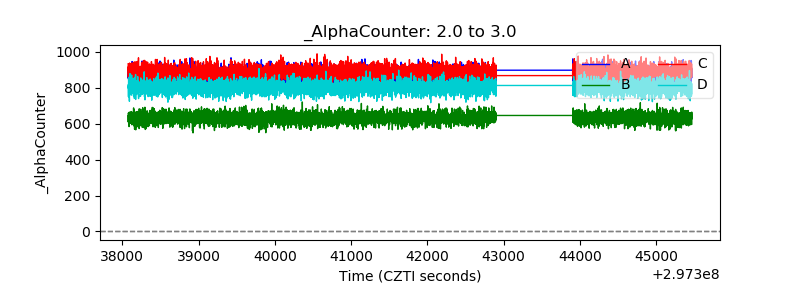 |
| _CPM_Rate | 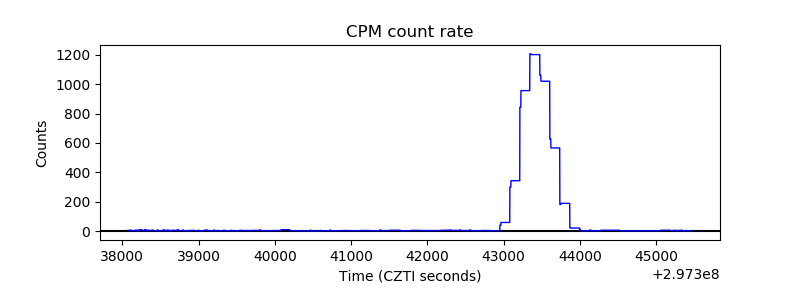 |
| CZT Counter | 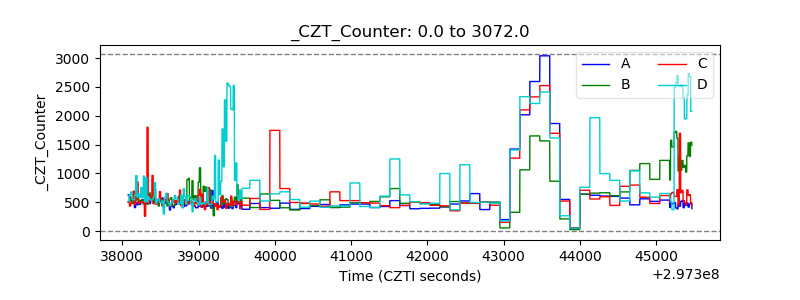 |
| +2.5 Volts monitor |  |
| +5 Volts monitor | 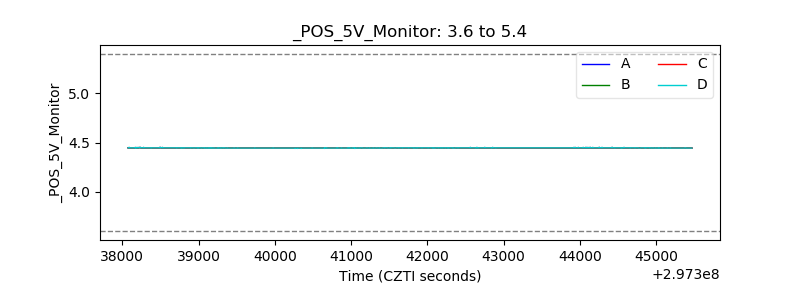 |
| _ROLL_ROT | 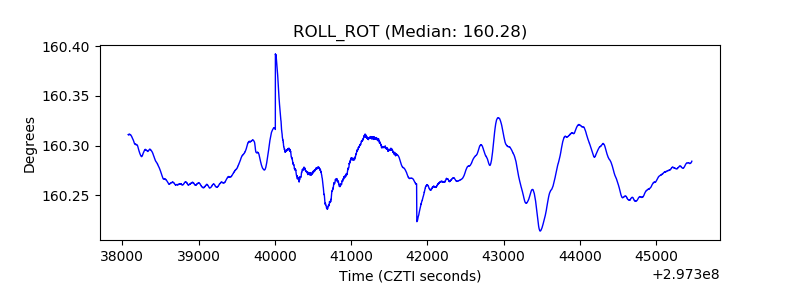 |
| _Roll_DEC | 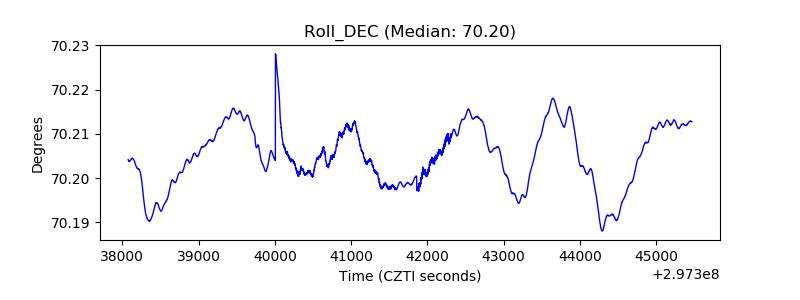 |
| _Roll_RA | 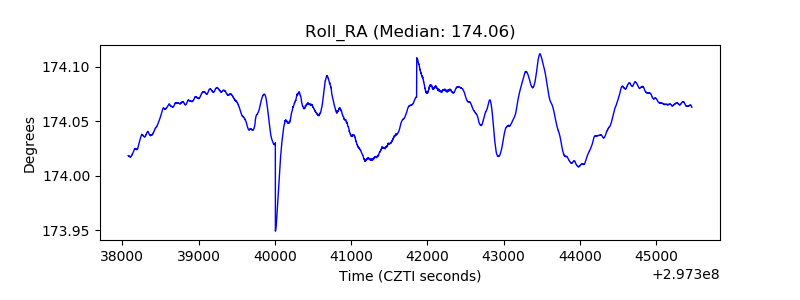 |
| Veto Counter | 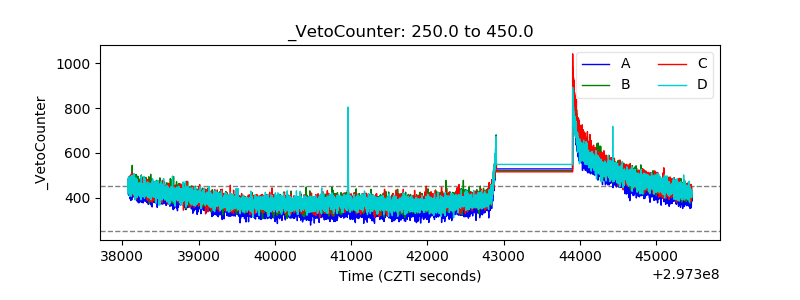 |