| Param | Original file | Final file |
|---|---|---|
| Filename | modeM0/AS1A05_064T01_9000002964_19914cztM0_level2.evt | modeM0/AS1A05_064T01_9000002964_19914cztM0_level2_quad_clean.evt |
| Size (bytes) | 698,463,360 | 106,885,440 |
| Size | 666.1 MB | 101.9 MB |
| Events in quadrant A | 2,834,590 | 762,162 |
| Events in quadrant B | 5,319,094 | 741,950 |
| Events in quadrant C | 3,790,565 | 725,160 |
| Events in quadrant D | 8,810,002 | 593,804 |
| Mode M0 | |||
|---|---|---|---|
| Quadrant | BADHDUFLAG | Total packets | Discarded packets |
| A | 0 | 12398 | 0 |
| B | 0 | 20043 | 0 |
| C | 0 | 15142 | 0 |
| D | 0 | 30355 | 0 |
| Mode SS | |||
|---|---|---|---|
| Quadrant | BADHDUFLAG | Total packets | Discarded packets |
| A | 0 | 120 | 0 |
| B | 0 | 120 | 0 |
| C | 0 | 120 | 0 |
| D | 0 | 120 | 0 |
| Mode M9 | |||
|---|---|---|---|
| Quadrant | BADHDUFLAG | Total packets | Discarded packets |
| A | 0 | 12 | 0 |
| B | 0 | 12 | 0 |
| C | 0 | 12 | 0 |
| D | 0 | 12 | 0 |
| Quadrant | Total seconds | Saturated seconds | Saturation percentage |
|---|---|---|---|
| A | 5912 | 36 | 0.608931% |
| B | 5913 | 189 | 3.196347% |
| C | 5913 | 266 | 4.498562% |
| D | 5913 | 1788 | 30.238458% |
Noise dominated data is calculated using 1-second bins in cleaned event files. If a bin has >2000 counts, and if more than 50% of those come from <1% of pixels, then it is considered to be noise-dominated and hence unusable.
| Quadrant | # 1 sec bins | Bins with >0 counts | Bins with >2000 counts | High rate bins dominated by noise | Noise dominated (total time) | Noise dominated (detector-on time) | Marked lightcurve |
|---|---|---|---|---|---|---|---|
| A | 7052 | 5913 | 3 | 3 | 0.04% | 0.05% | 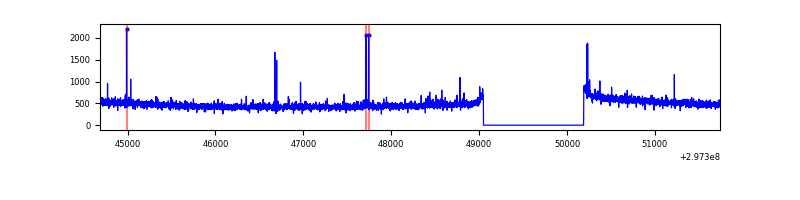 |
| B | 7053 | 5914 | 94 | 94 | 1.33% | 1.59% | 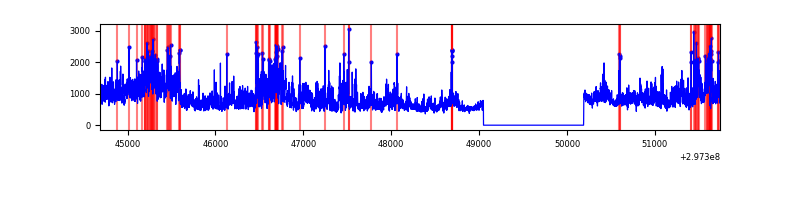 |
| C | 7053 | 5913 | 122 | 122 | 1.73% | 2.06% | 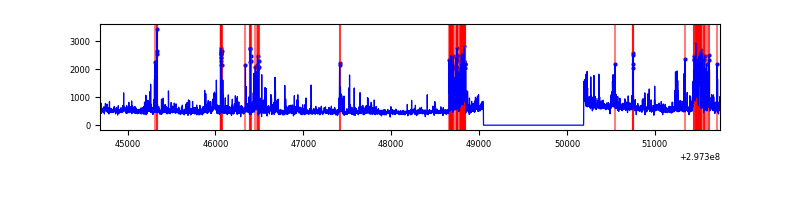 |
| D | 7052 | 5912 | 1810 | 1810 | 25.67% | 30.62% | 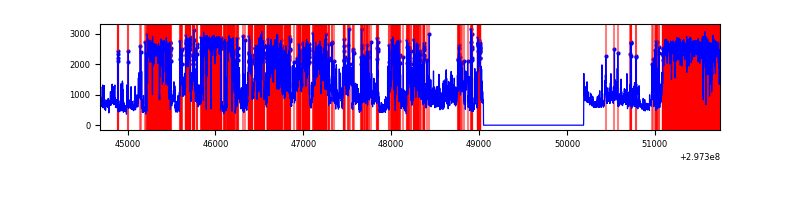 |
Top three noisy pixels from each quadrant. If the there are fewer than three noisy pixels in the level2.evt file, extra rows are filled as -1
| Pixel properties | Quadrant properties | ||||||
|---|---|---|---|---|---|---|---|
| Quadrant | DetID | PixID | Counts | Sigma | Mean | Median | Sigma |
| A | 5 | 16 | 28242 | 190.21 | 722 | 708 | 144.8 |
| A | 9 | 143 | 22502 | 150.56 | 722 | 708 | 144.8 |
| A | 0 | 226 | 6445 | 39.63 | 722 | 708 | 144.8 |
| B | 3 | 112 | 2232224 | 16765.2 | 712 | 694 | 133.1 |
| B | 0 | 190 | 129848 | 970.32 | 712 | 694 | 133.1 |
| B | 0 | 197 | 28771 | 210.94 | 712 | 694 | 133.1 |
| C | 9 | 221 | 844718 | 5321.44 | 686 | 692 | 158.6 |
| C | 4 | 254 | 121926 | 764.36 | 686 | 692 | 158.6 |
| C | 14 | 238 | 107486 | 673.32 | 686 | 692 | 158.6 |
| D | 7 | 38 | 3867488 | 26212.09 | 610 | 591 | 147.5 |
| D | 2 | 184 | 1289487 | 8736.89 | 610 | 591 | 147.5 |
| D | 12 | 225 | 557725 | 3776.58 | 610 | 591 | 147.5 |
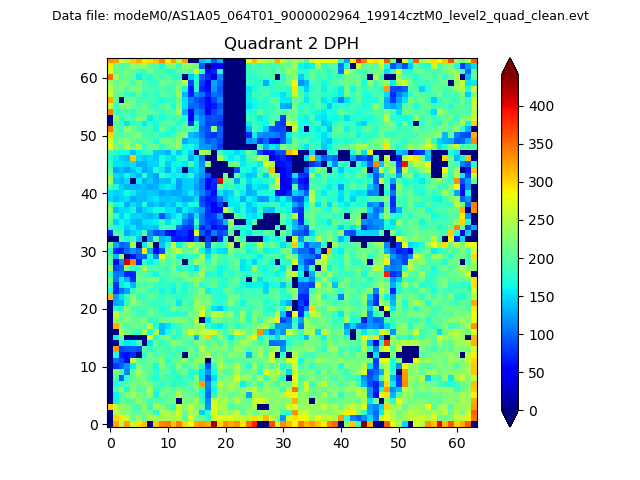
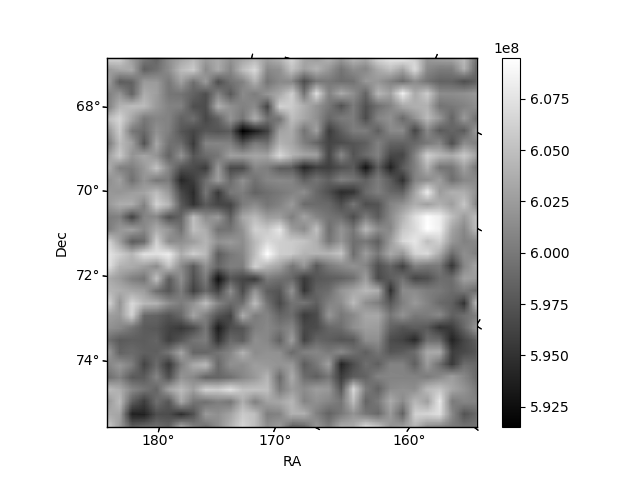
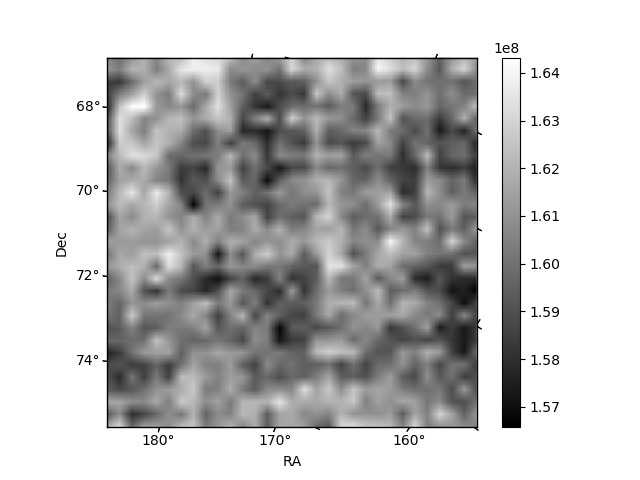
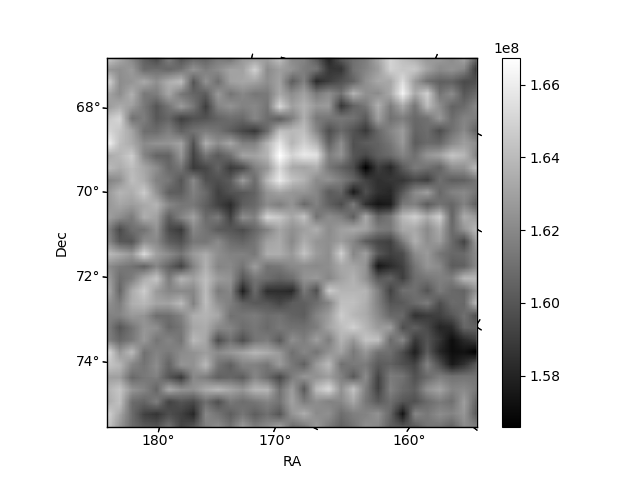
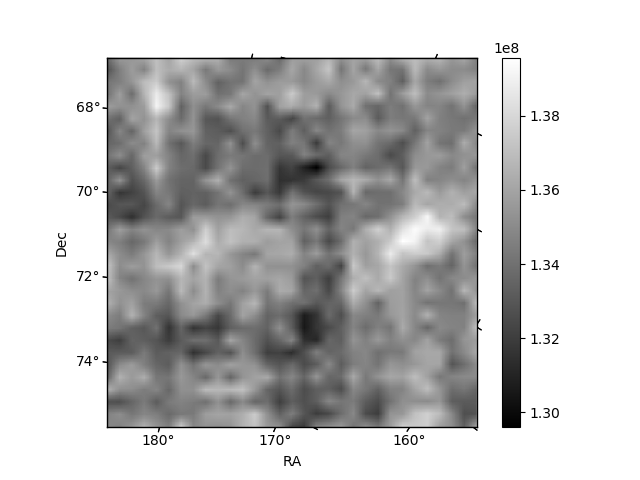
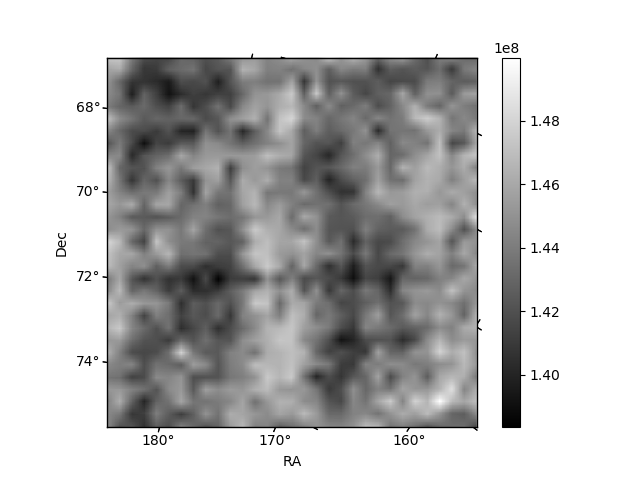
Histogram calculated using DETX and DETY for each event in the final _common_clean file
| Quadrant A | 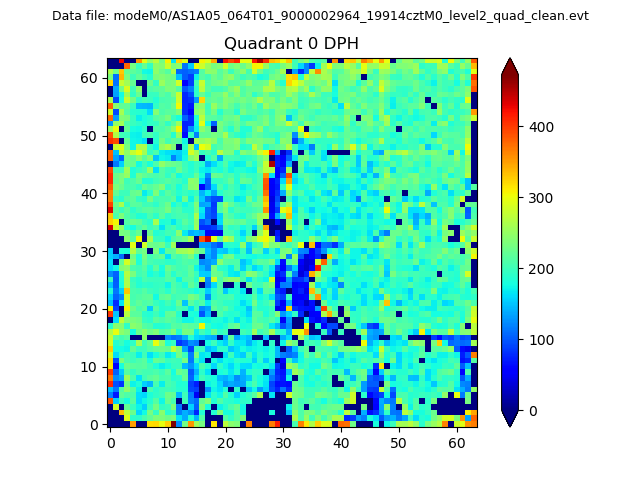 |
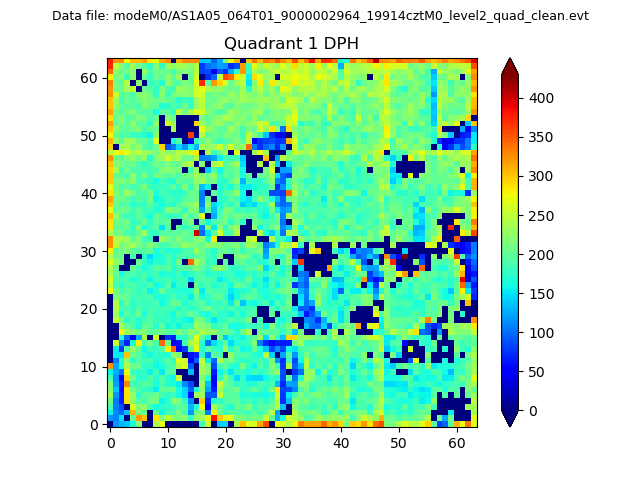 |
Quadrant B |
|---|---|---|---|
| Quadrant D | 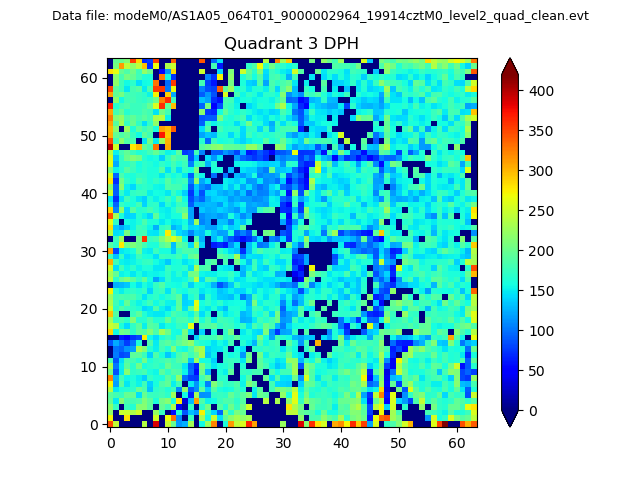 |
 |
Quadrant C |
| Plot type | Count rate plots | Images |
|---|---|---|
| Comparison with Poisson distribution Blue bars denote a histogram of data divided into 1 sec bins. Red curve is a Poisson curve with rate = median count rate of data. |
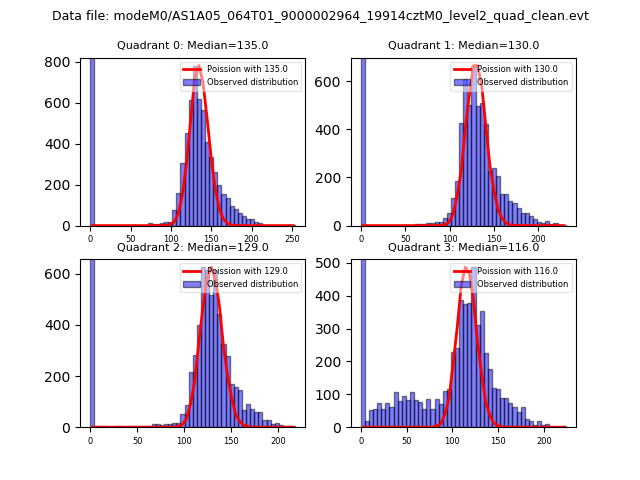 |
 |
| Quadrant-wise count rates Data is divided into 100 sec bins |
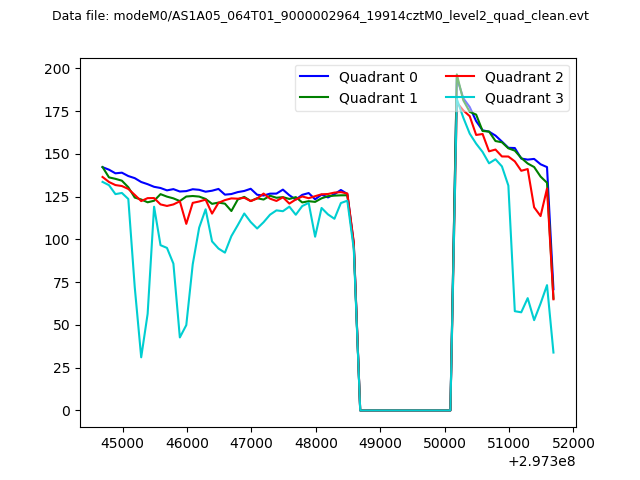 |
|
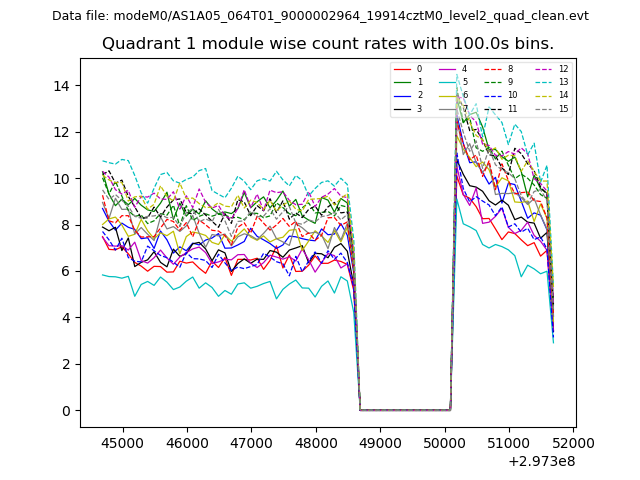
| Module-wise count rates for Quadrant A Data is divided into 100 sec bins |
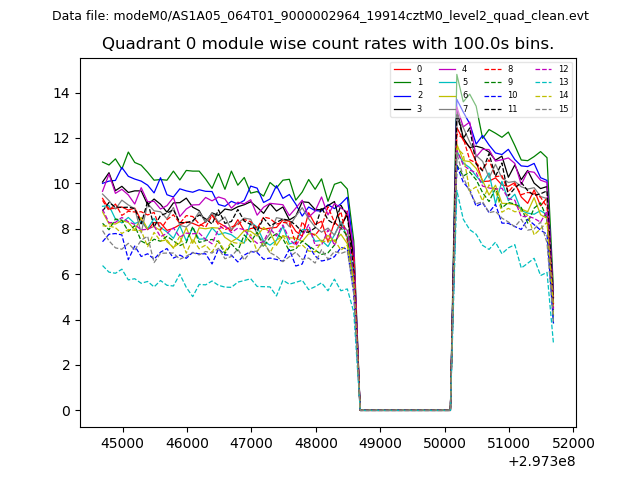 |
 |
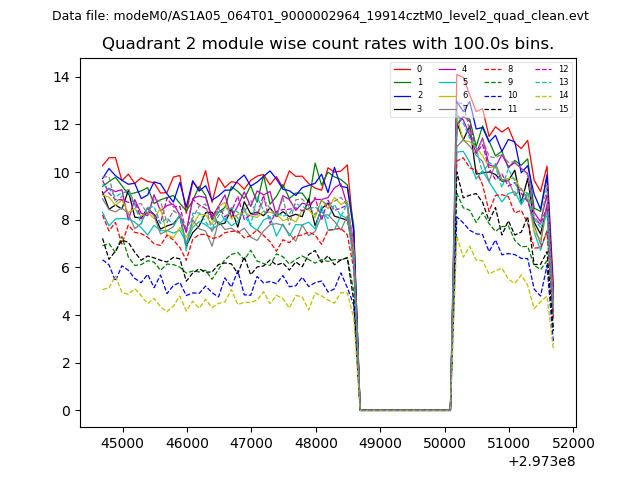
| Module-wise count rates for Quadrant B Data is divided into 100 sec bins |
 |
 |
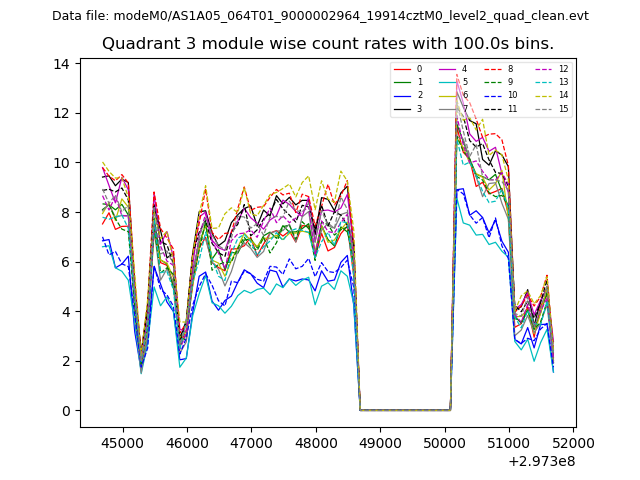
| Module-wise count rates for Quadrant C Data is divided into 100 sec bins |
 |
 |
| Module-wise count rates for Quadrant D Data is divided into 100 sec bins |
 |
 |
| Parameter | Plot |
|---|---|
| CZT HV Monitor | 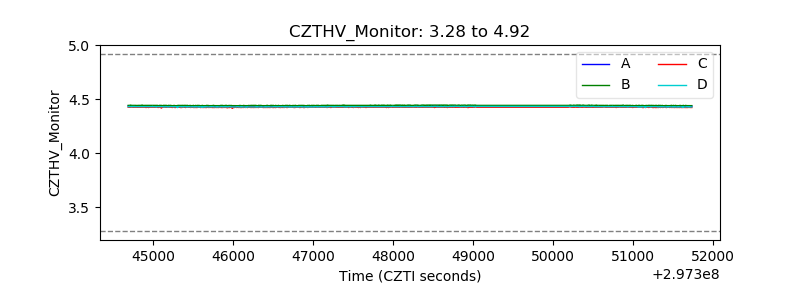 |
| D_VDD | 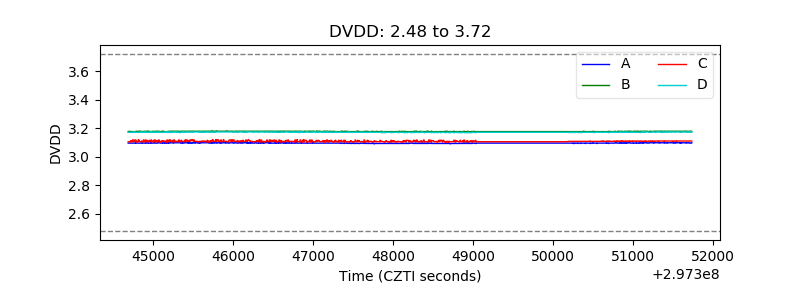 |
| Temperature 1 | 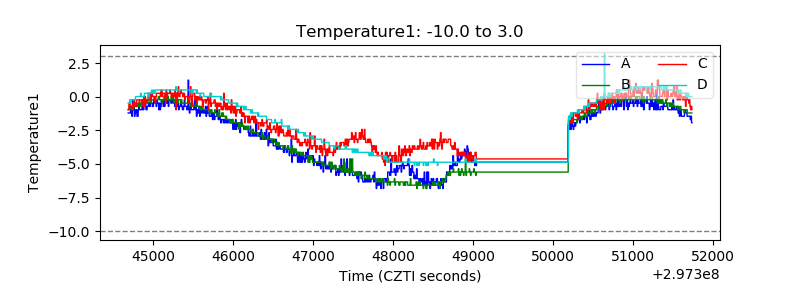 |
| Veto HV Monitor | 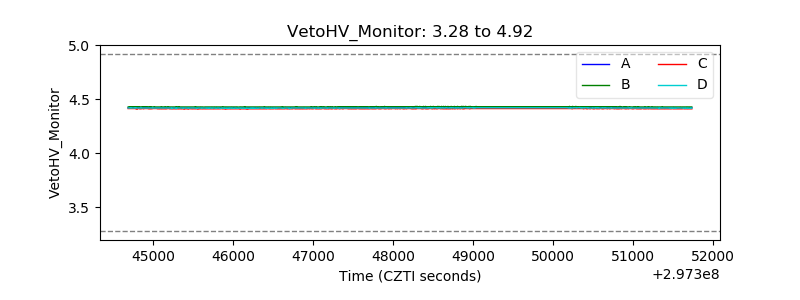 |
| Veto LLD | 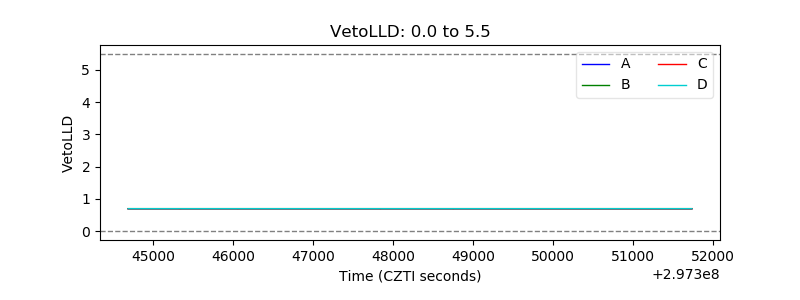 |
| Alpha Counter | 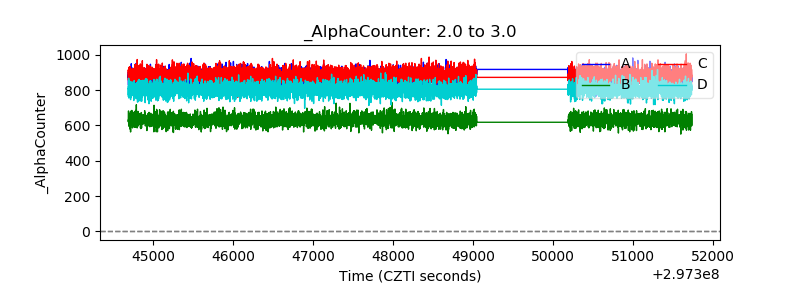 |
| _CPM_Rate | 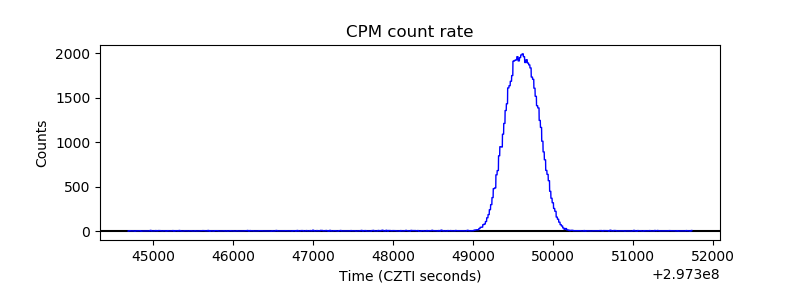 |
| CZT Counter | 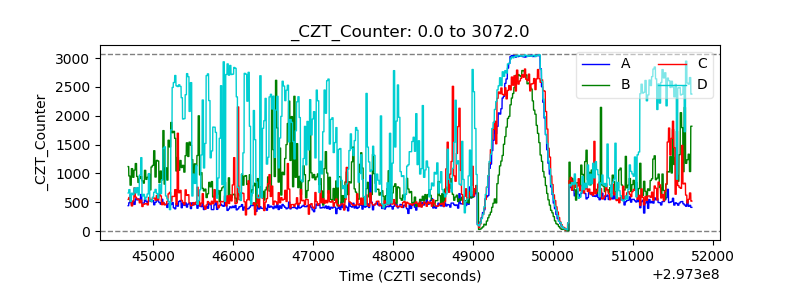 |
| +2.5 Volts monitor | 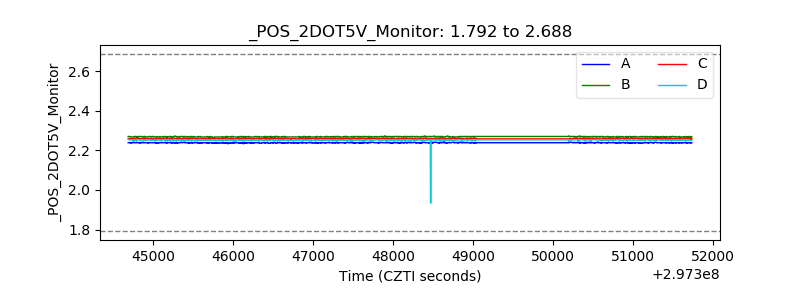 |
| +5 Volts monitor |  |
| _ROLL_ROT | 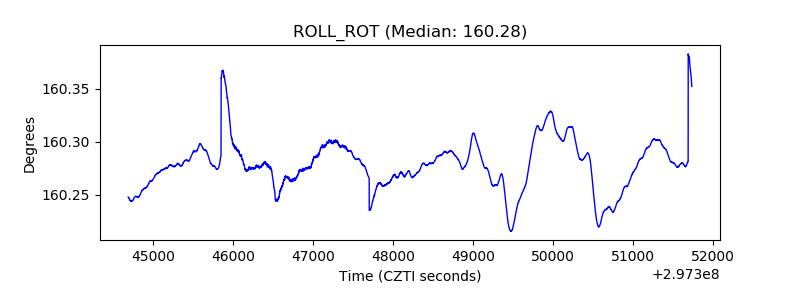 |
| _Roll_DEC | 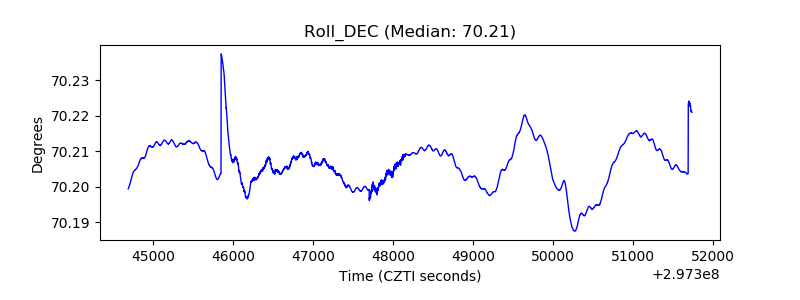 |
| _Roll_RA | 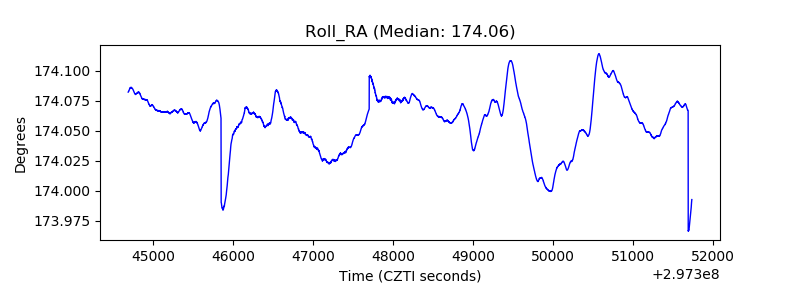 |
| Veto Counter | 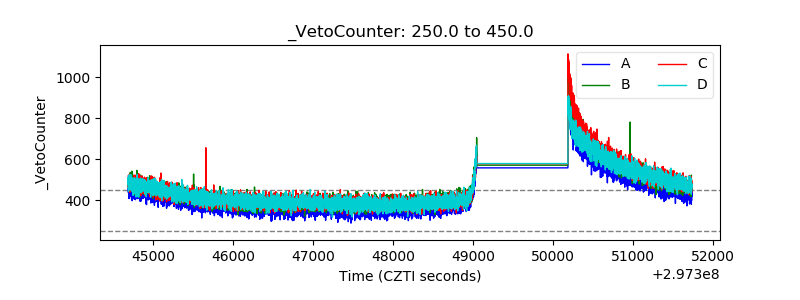 |