| Param | Original file | Final file |
|---|---|---|
| Filename | modeM0/AS1A05_064T01_9000002964_19915cztM0_level2.evt | modeM0/AS1A05_064T01_9000002964_19915cztM0_level2_quad_clean.evt |
| Size (bytes) | 790,338,240 | 99,250,560 |
| Size | 753.7 MB | 94.7 MB |
| Events in quadrant A | 2,750,738 | 723,447 |
| Events in quadrant B | 5,548,218 | 698,789 |
| Events in quadrant C | 4,639,441 | 682,814 |
| Events in quadrant D | 10,613,060 | 500,545 |
| Mode M0 | |||
|---|---|---|---|
| Quadrant | BADHDUFLAG | Total packets | Discarded packets |
| A | 0 | 11955 | 1 |
| B | 0 | 20537 | 1 |
| C | 0 | 17773 | 1 |
| D | 0 | 35463 | 1 |
| Mode SS | |||
|---|---|---|---|
| Quadrant | BADHDUFLAG | Total packets | Discarded packets |
| A | 0 | 116 | 0 |
| B | 0 | 116 | 0 |
| C | 0 | 116 | 0 |
| D | 0 | 116 | 0 |
| Mode M9 | |||
|---|---|---|---|
| Quadrant | BADHDUFLAG | Total packets | Discarded packets |
| A | 0 | 12 | 0 |
| B | 0 | 12 | 0 |
| C | 0 | 12 | 0 |
| D | 0 | 12 | 0 |
| Quadrant | Total seconds | Saturated seconds | Saturation percentage |
|---|---|---|---|
| A | 5704 | 46 | 0.806452% |
| B | 5705 | 269 | 4.715162% |
| C | 5705 | 450 | 7.887818% |
| D | 5704 | 2738 | 48.001403% |
Noise dominated data is calculated using 1-second bins in cleaned event files. If a bin has >2000 counts, and if more than 50% of those come from <1% of pixels, then it is considered to be noise-dominated and hence unusable.
| Quadrant | # 1 sec bins | Bins with >0 counts | Bins with >2000 counts | High rate bins dominated by noise | Noise dominated (total time) | Noise dominated (detector-on time) | Marked lightcurve |
|---|---|---|---|---|---|---|---|
| A | 6944 | 5704 | 0 | 0 | 0.00% | 0.00% | 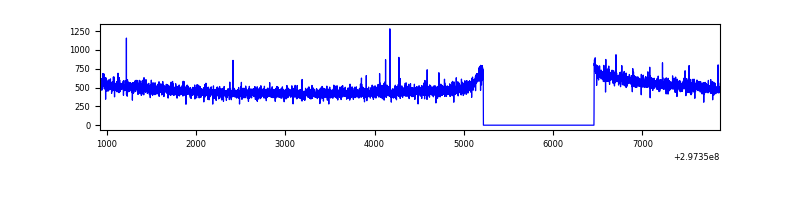 |
| B | 6945 | 5705 | 117 | 117 | 1.68% | 2.05% | 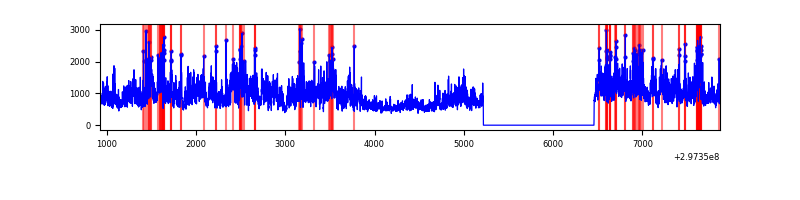 |
| C | 6945 | 5705 | 211 | 211 | 3.04% | 3.70% | 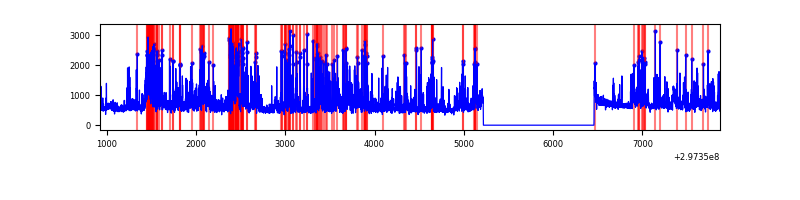 |
| D | 6943 | 5703 | 2790 | 2790 | 40.18% | 48.92% | 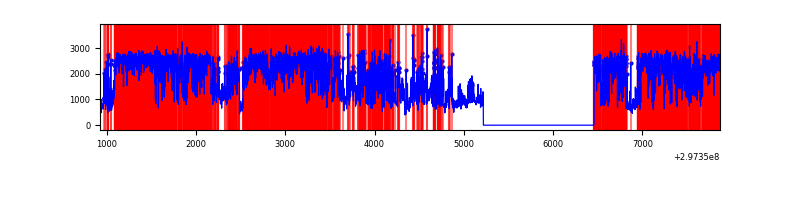 |
Top three noisy pixels from each quadrant. If the there are fewer than three noisy pixels in the level2.evt file, extra rows are filled as -1
| Pixel properties | Quadrant properties | ||||||
|---|---|---|---|---|---|---|---|
| Quadrant | DetID | PixID | Counts | Sigma | Mean | Median | Sigma |
| A | 5 | 16 | 9850 | 64.79 | 712 | 698 | 141.3 |
| A | 0 | 226 | 6545 | 41.39 | 712 | 698 | 141.3 |
| A | 12 | 194 | 5345 | 32.9 | 712 | 698 | 141.3 |
| B | 3 | 112 | 2303460 | 17812.08 | 700 | 684 | 129.3 |
| B | 7 | 220 | 308116 | 2378.0 | 700 | 684 | 129.3 |
| B | 0 | 190 | 67050 | 513.34 | 700 | 684 | 129.3 |
| C | 9 | 221 | 965395 | 6169.04 | 677 | 682 | 156.4 |
| C | 4 | 254 | 802884 | 5129.84 | 677 | 682 | 156.4 |
| C | 14 | 238 | 105926 | 673.0 | 677 | 682 | 156.4 |
| D | 7 | 38 | 3072614 | 22341.56 | 567 | 550 | 137.5 |
| D | 2 | 184 | 2537456 | 18449.63 | 567 | 550 | 137.5 |
| D | 1 | 52 | 1393220 | 10128.18 | 567 | 550 | 137.5 |
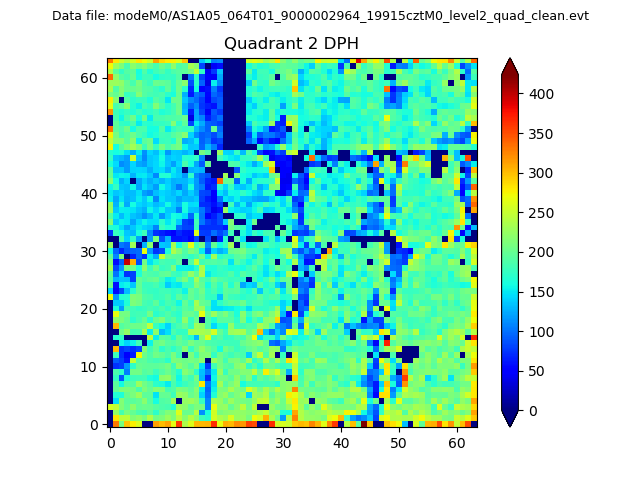
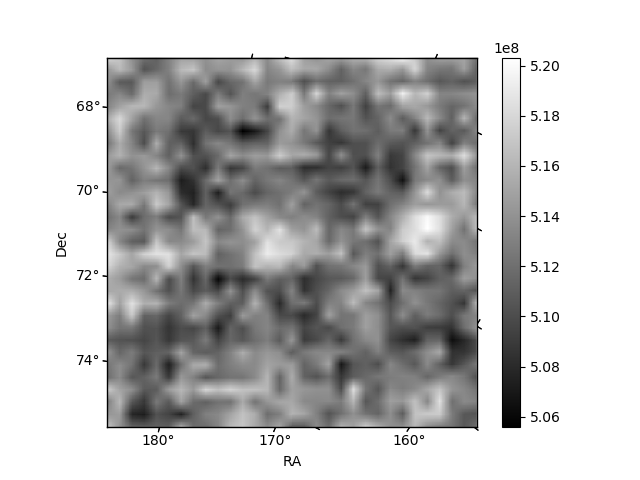
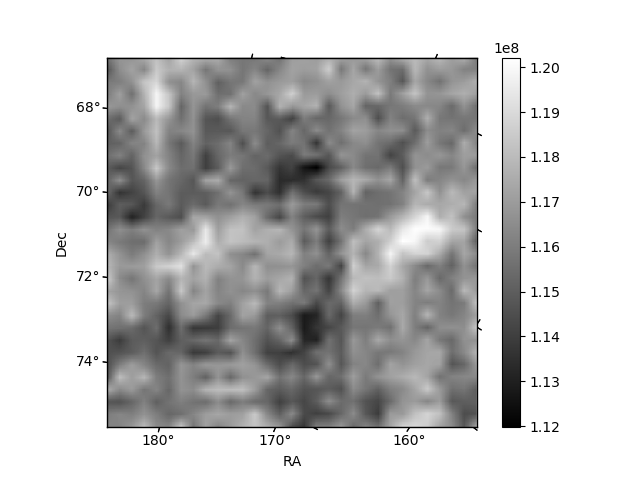
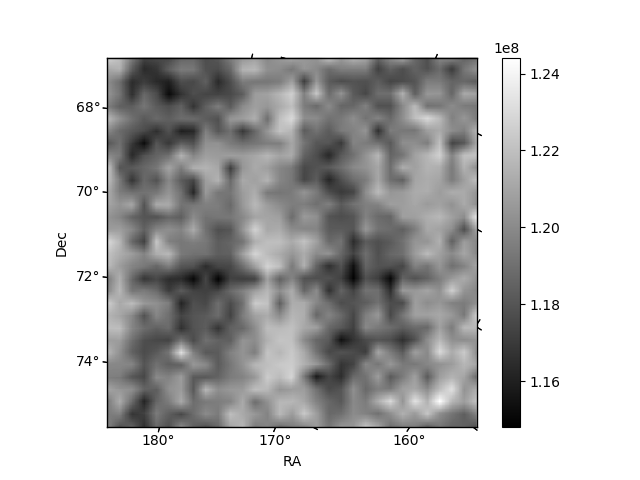
Histogram calculated using DETX and DETY for each event in the final _common_clean file
| Quadrant A | 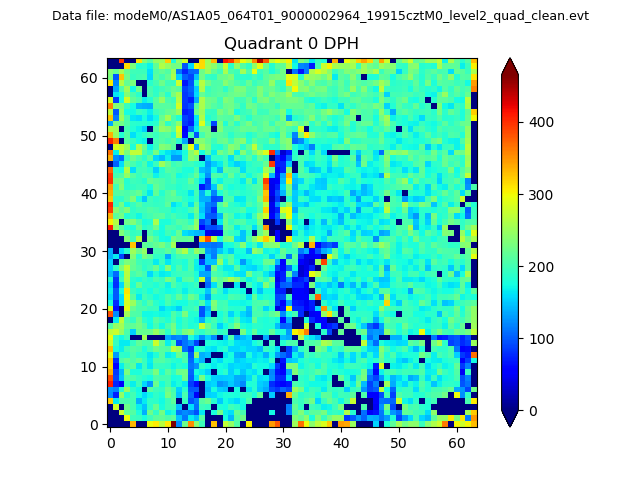 |
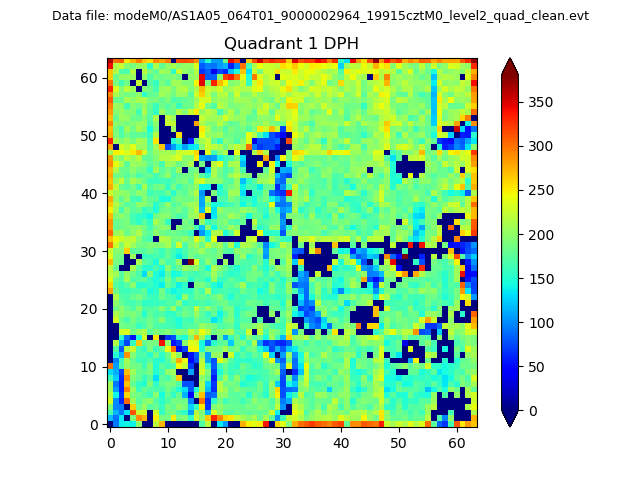 |
Quadrant B |
|---|---|---|---|
| Quadrant D | 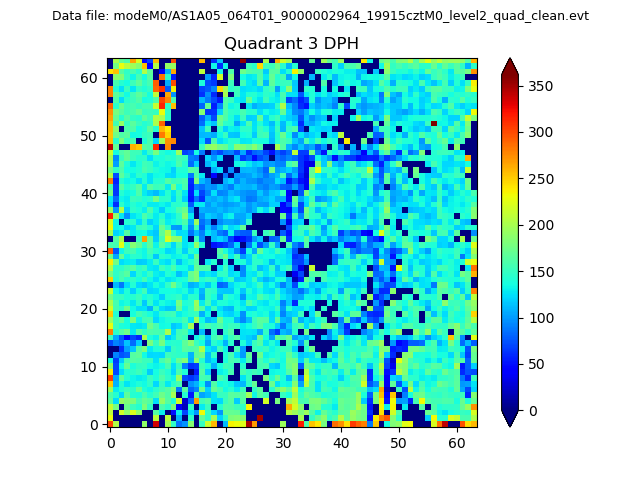 |
 |
Quadrant C |
| Plot type | Count rate plots | Images |
|---|---|---|
| Comparison with Poisson distribution Blue bars denote a histogram of data divided into 1 sec bins. Red curve is a Poisson curve with rate = median count rate of data. |
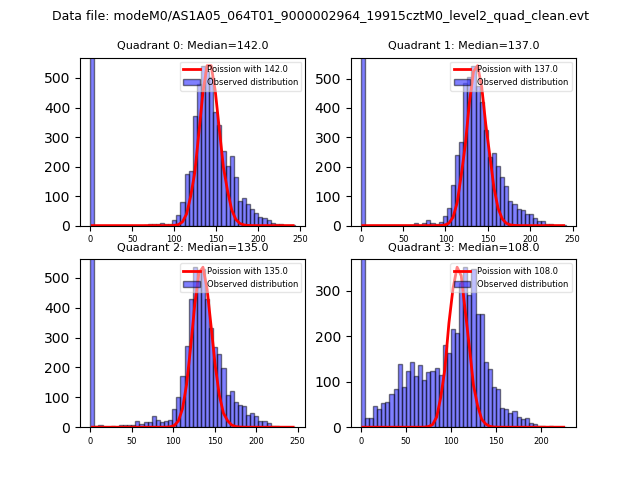 |
 |
| Quadrant-wise count rates Data is divided into 100 sec bins |
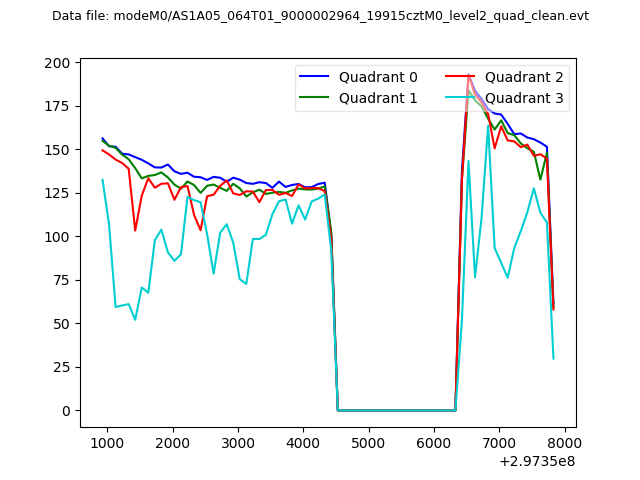 |
|
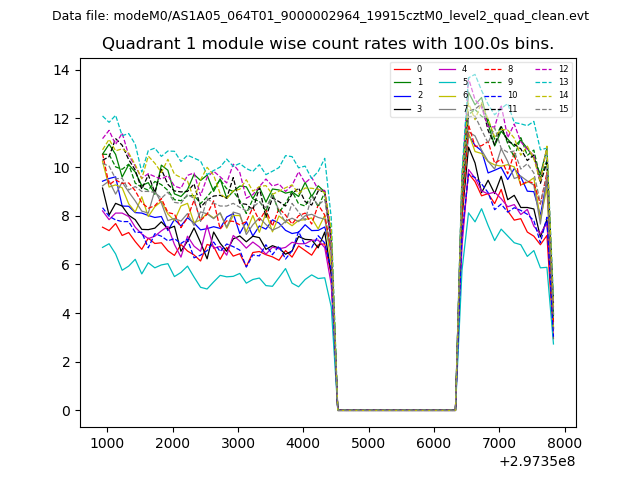
| Module-wise count rates for Quadrant A Data is divided into 100 sec bins |
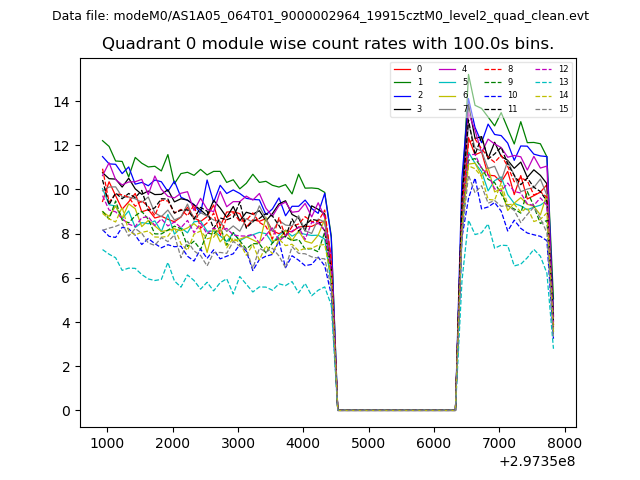 |
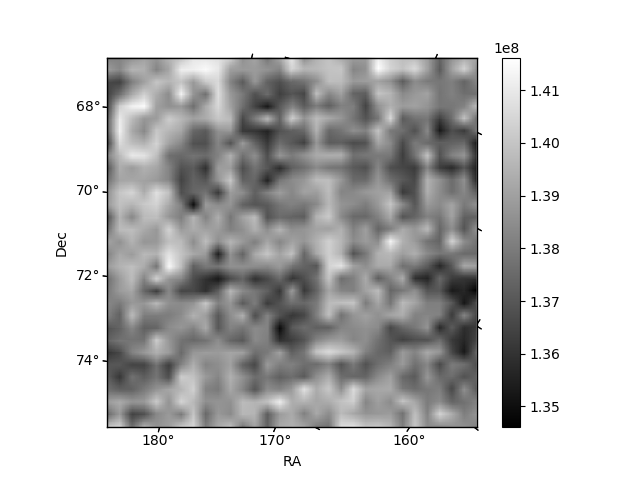 |
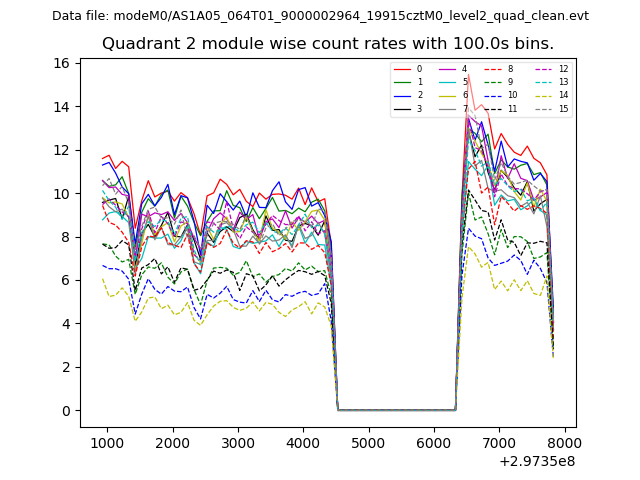
| Module-wise count rates for Quadrant B Data is divided into 100 sec bins |
 |
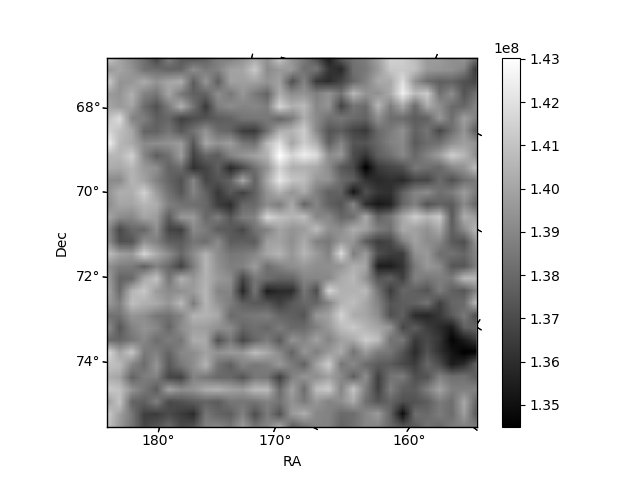 |
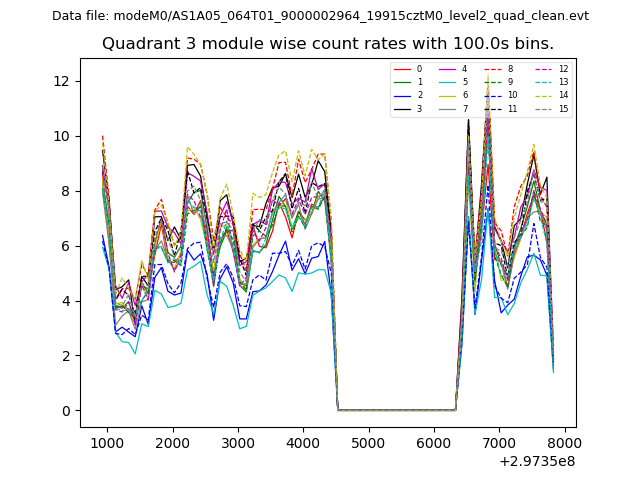
| Module-wise count rates for Quadrant C Data is divided into 100 sec bins |
 |
 |
| Module-wise count rates for Quadrant D Data is divided into 100 sec bins |
 |
 |
| Parameter | Plot |
|---|---|
| CZT HV Monitor | 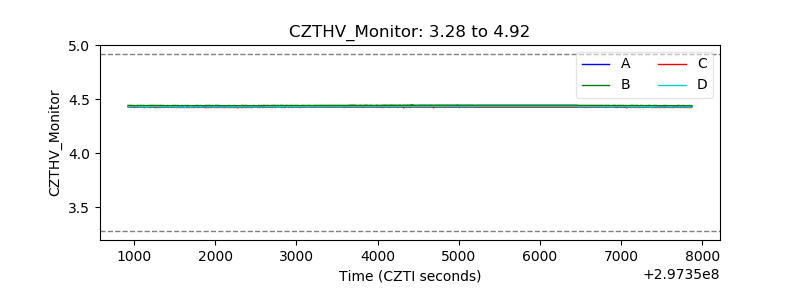 |
| D_VDD | 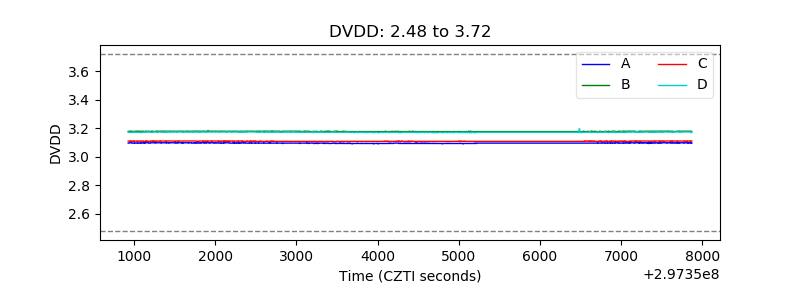 |
| Temperature 1 | 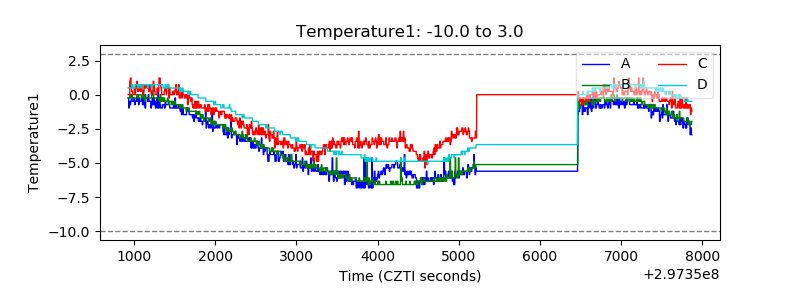 |
| Veto HV Monitor | 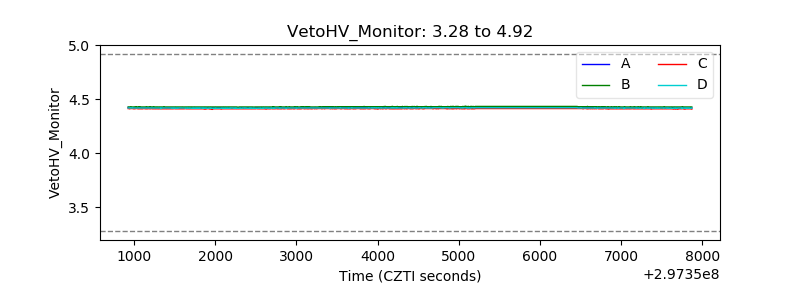 |
| Veto LLD | 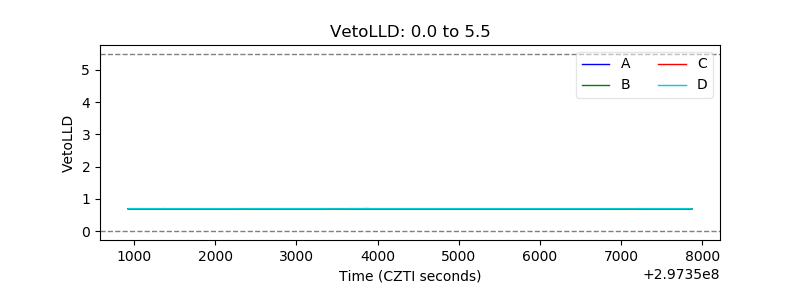 |
| Alpha Counter | 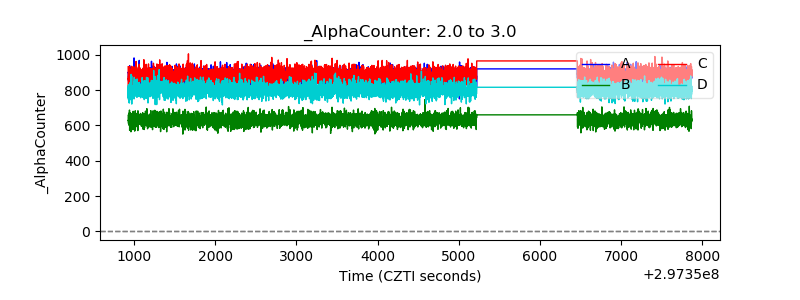 |
| _CPM_Rate | 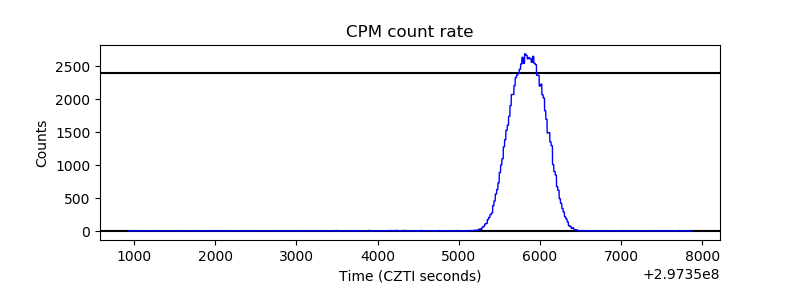 |
| CZT Counter | 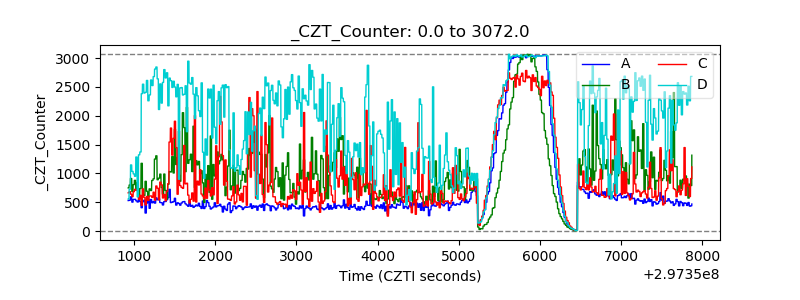 |
| +2.5 Volts monitor |  |
| +5 Volts monitor |  |
| _ROLL_ROT | 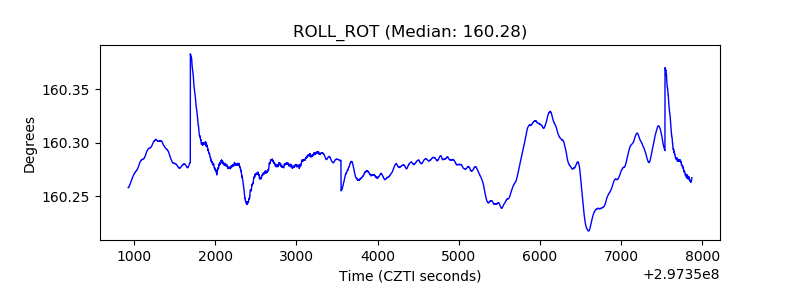 |
| _Roll_DEC | 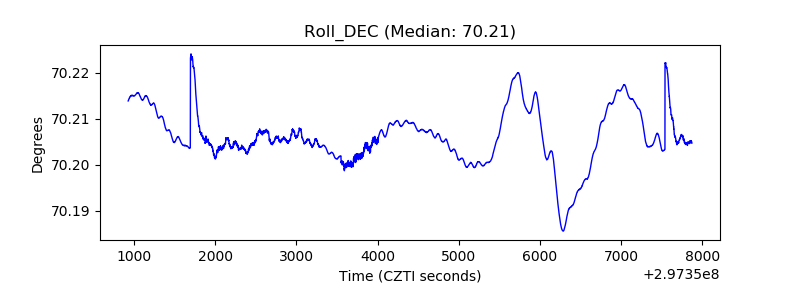 |
| _Roll_RA | 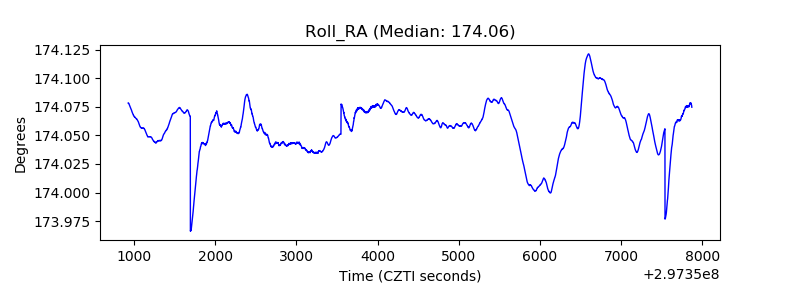 |
| Veto Counter | 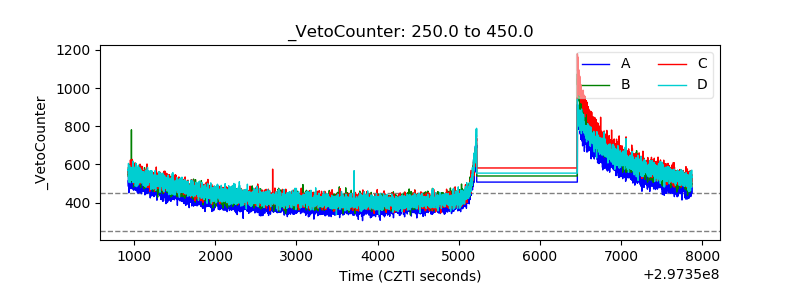 |