| Param | Original file | Final file |
|---|---|---|
| Filename | modeM0/AS1A05_064T01_9000002964_19916cztM0_level2.evt | modeM0/AS1A05_064T01_9000002964_19916cztM0_level2_quad_clean.evt |
| Size (bytes) | 731,442,240 | 100,817,280 |
| Size | 697.6 MB | 96.1 MB |
| Events in quadrant A | 2,846,649 | 733,907 |
| Events in quadrant B | 4,898,632 | 721,839 |
| Events in quadrant C | 4,055,033 | 715,528 |
| Events in quadrant D | 9,961,211 | 476,481 |
| Mode M0 | |||
|---|---|---|---|
| Quadrant | BADHDUFLAG | Total packets | Discarded packets |
| A | 0 | 12164 | 0 |
| B | 0 | 18705 | 0 |
| C | 0 | 16003 | 0 |
| D | 0 | 33517 | 1 |
| Mode SS | |||
|---|---|---|---|
| Quadrant | BADHDUFLAG | Total packets | Discarded packets |
| A | 0 | 118 | 0 |
| B | 0 | 118 | 0 |
| C | 0 | 118 | 0 |
| D | 0 | 118 | 0 |
| Mode M9 | |||
|---|---|---|---|
| Quadrant | BADHDUFLAG | Total packets | Discarded packets |
| A | 0 | 13 | 0 |
| B | 0 | 13 | 0 |
| C | 0 | 13 | 0 |
| D | 0 | 13 | 0 |
| Quadrant | Total seconds | Saturated seconds | Saturation percentage |
|---|---|---|---|
| A | 5776 | 43 | 0.744460% |
| B | 5777 | 152 | 2.631123% |
| C | 5777 | 287 | 4.967976% |
| D | 5776 | 3150 | 54.536011% |
Noise dominated data is calculated using 1-second bins in cleaned event files. If a bin has >2000 counts, and if more than 50% of those come from <1% of pixels, then it is considered to be noise-dominated and hence unusable.
| Quadrant | # 1 sec bins | Bins with >0 counts | Bins with >2000 counts | High rate bins dominated by noise | Noise dominated (total time) | Noise dominated (detector-on time) | Marked lightcurve |
|---|---|---|---|---|---|---|---|
| A | 7071 | 5776 | 0 | 0 | 0.00% | 0.00% | 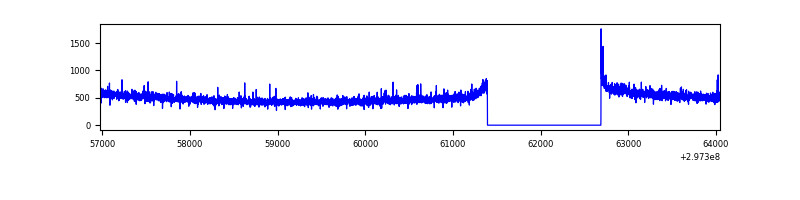 |
| B | 7072 | 5778 | 55 | 55 | 0.78% | 0.95% | 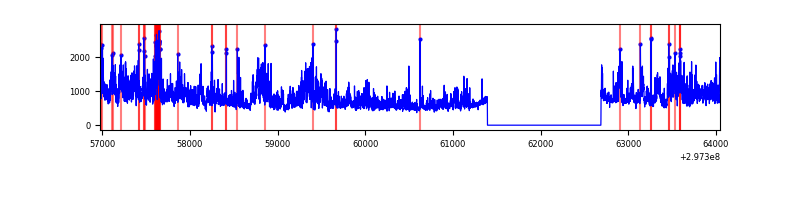 |
| C | 7072 | 5777 | 125 | 125 | 1.77% | 2.16% | 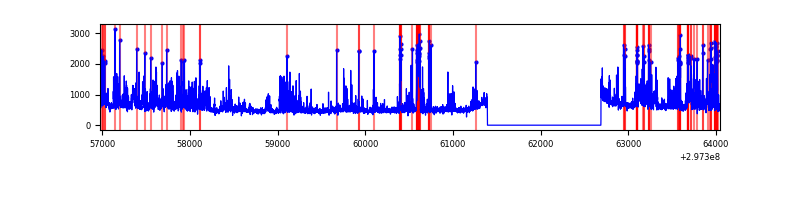 |
| D | 7070 | 5775 | 3056 | 3056 | 43.22% | 52.92% | 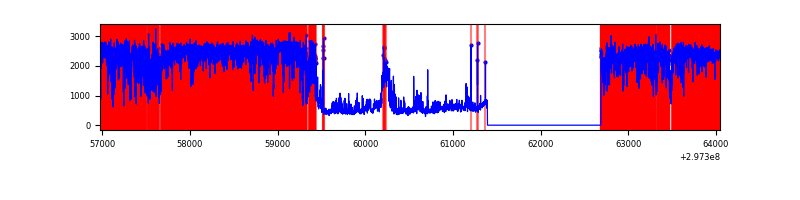 |
Top three noisy pixels from each quadrant. If the there are fewer than three noisy pixels in the level2.evt file, extra rows are filled as -1
| Pixel properties | Quadrant properties | ||||||
|---|---|---|---|---|---|---|---|
| Quadrant | DetID | PixID | Counts | Sigma | Mean | Median | Sigma |
| A | 3 | 1 | 10702 | 68.47 | 732 | 716 | 145.9 |
| A | 14 | 238 | 10320 | 65.85 | 732 | 716 | 145.9 |
| A | 5 | 16 | 8243 | 51.61 | 732 | 716 | 145.9 |
| B | 3 | 112 | 1604785 | 12134.95 | 726 | 710 | 132.2 |
| B | 7 | 220 | 166913 | 1257.34 | 726 | 710 | 132.2 |
| B | 0 | 197 | 70070 | 524.71 | 726 | 710 | 132.2 |
| C | 9 | 221 | 817185 | 5005.87 | 711 | 717 | 163.1 |
| C | 4 | 254 | 257967 | 1577.23 | 711 | 717 | 163.1 |
| C | 14 | 238 | 112107 | 682.95 | 711 | 717 | 163.1 |
| D | 7 | 38 | 5062358 | 37555.39 | 555 | 539 | 134.8 |
| D | 2 | 184 | 1304654 | 9675.68 | 555 | 539 | 134.8 |
| D | 12 | 218 | 897198 | 6652.62 | 555 | 539 | 134.8 |
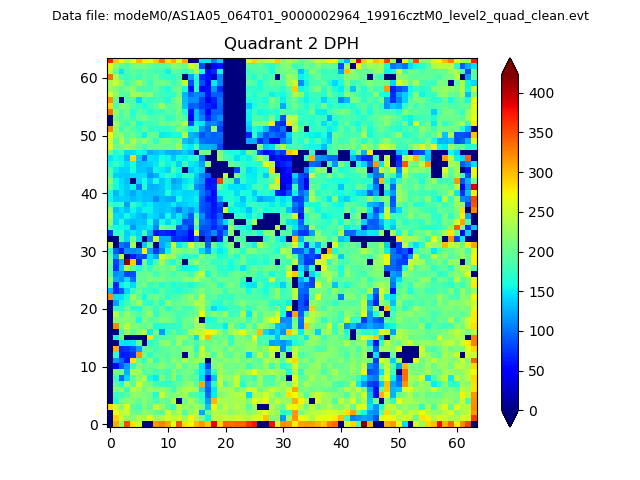
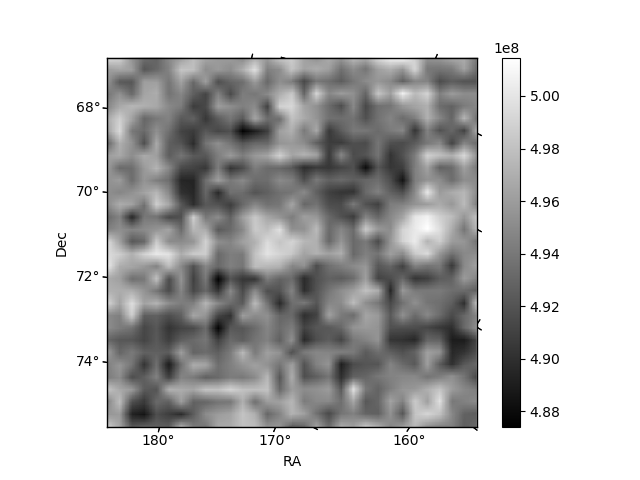
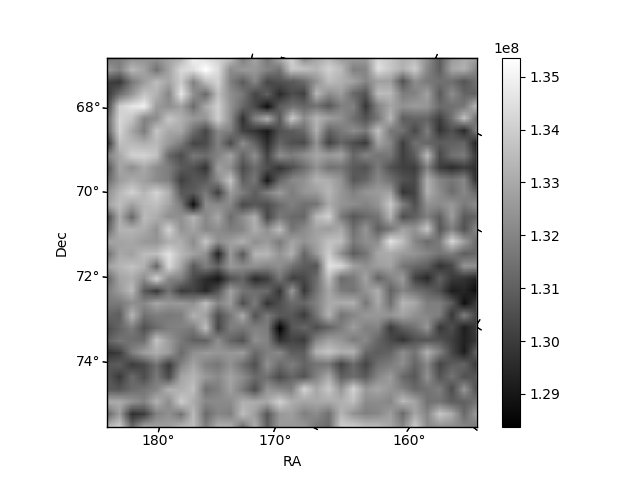
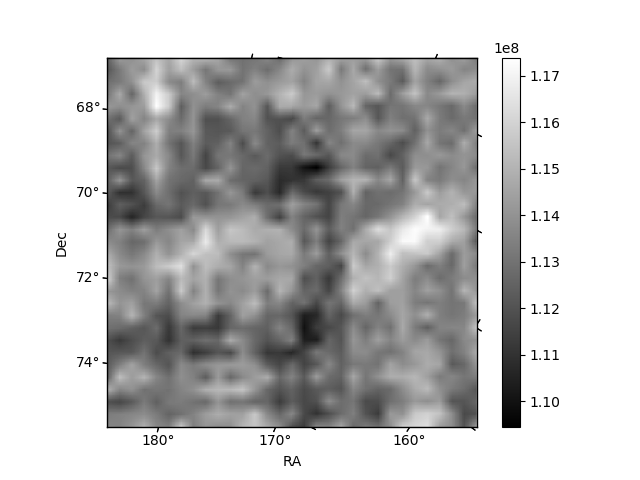
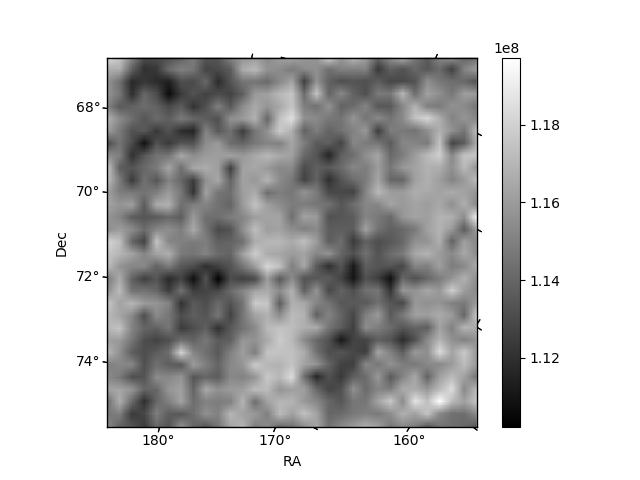
Histogram calculated using DETX and DETY for each event in the final _common_clean file
| Quadrant A | 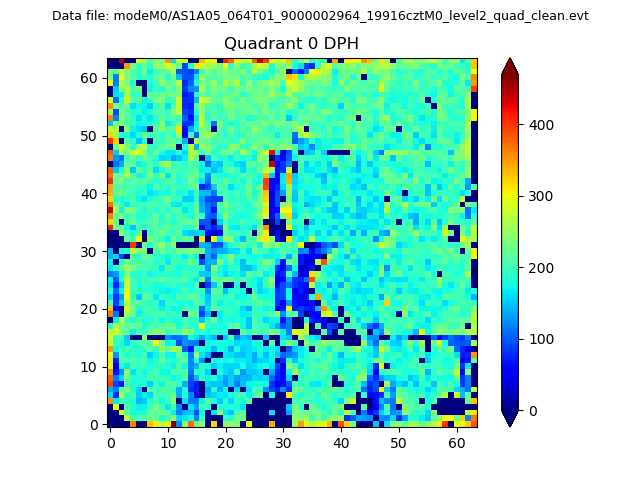 |
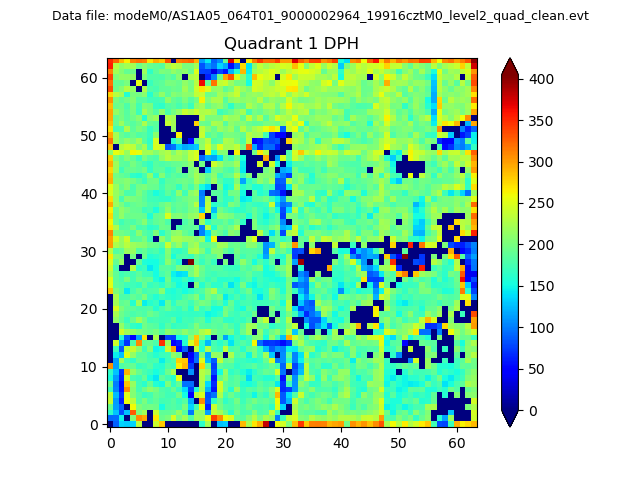 |
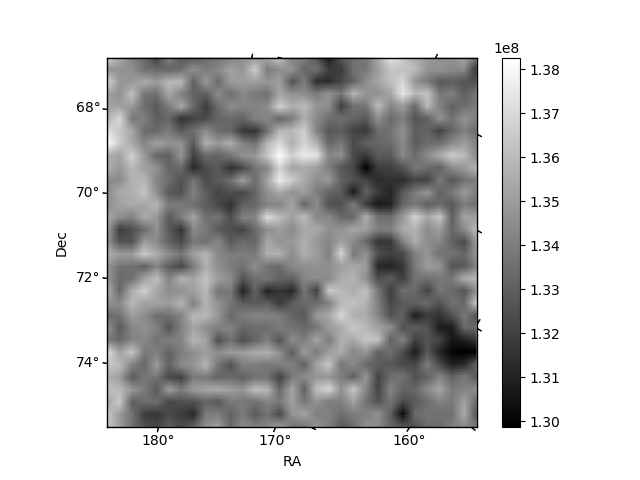
Quadrant B |
|---|---|---|---|
| Quadrant D | 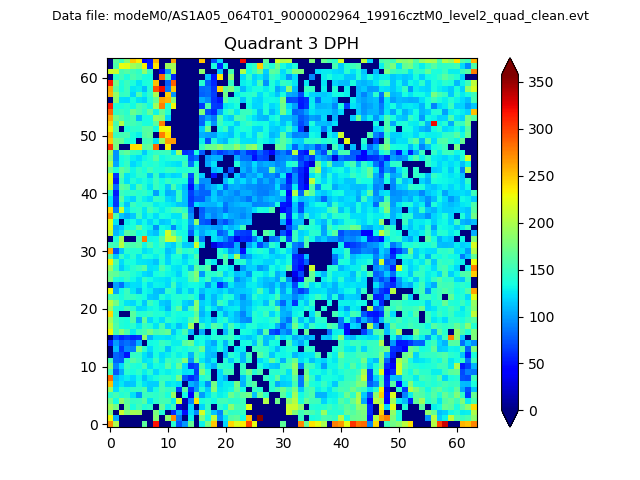 |
 |
Quadrant C |
| Plot type | Count rate plots | Images |
|---|---|---|
| Comparison with Poisson distribution Blue bars denote a histogram of data divided into 1 sec bins. Red curve is a Poisson curve with rate = median count rate of data. |
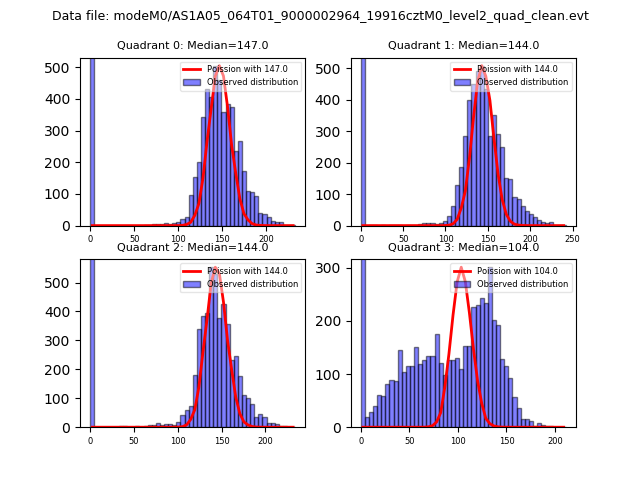 |
 |
| Quadrant-wise count rates Data is divided into 100 sec bins |
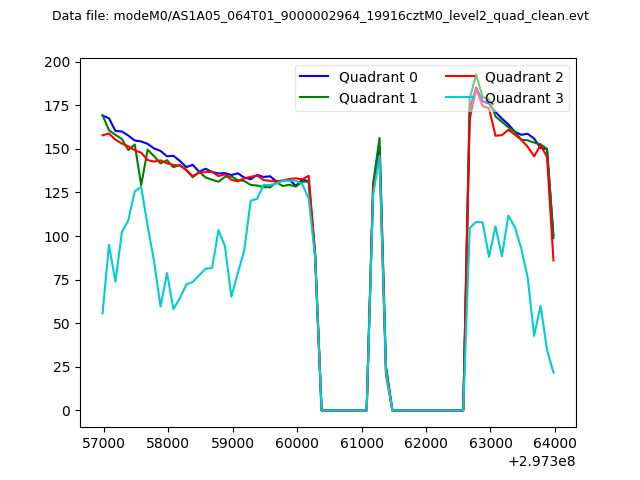 |
|
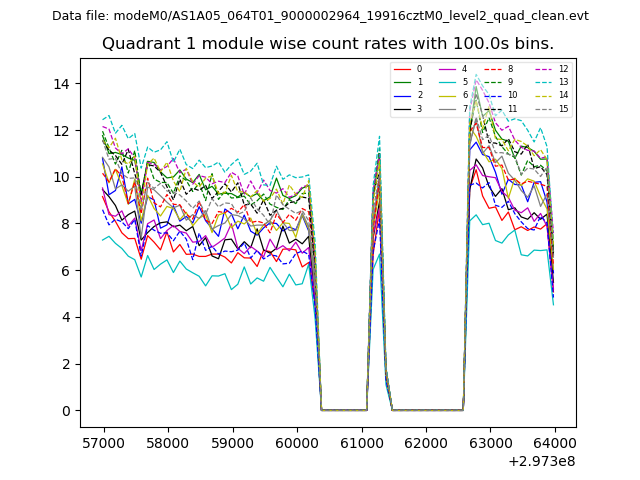
| Module-wise count rates for Quadrant A Data is divided into 100 sec bins |
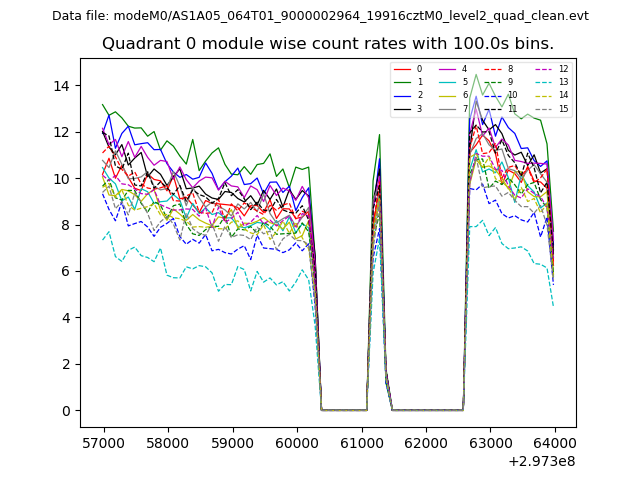 |
 |
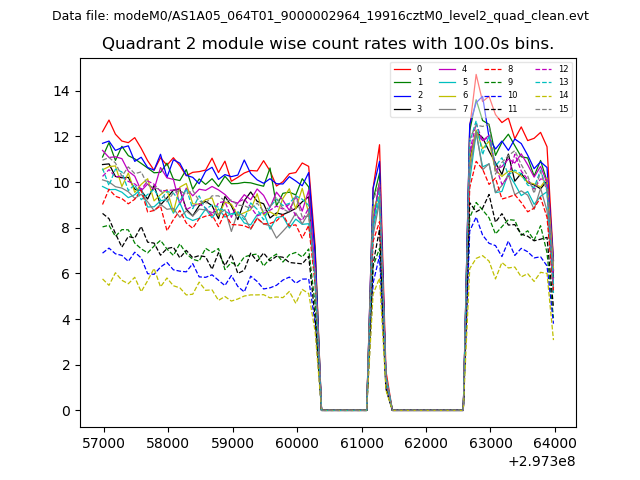
| Module-wise count rates for Quadrant B Data is divided into 100 sec bins |
 |
 |
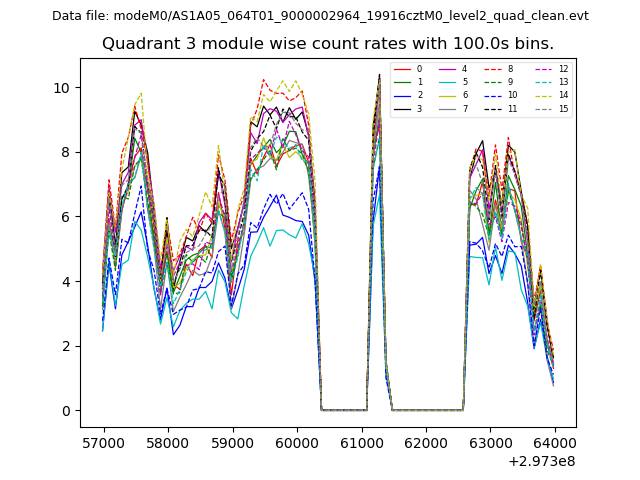
| Module-wise count rates for Quadrant C Data is divided into 100 sec bins |
 |
 |
| Module-wise count rates for Quadrant D Data is divided into 100 sec bins |
 |
 |
| Parameter | Plot |
|---|---|
| CZT HV Monitor | 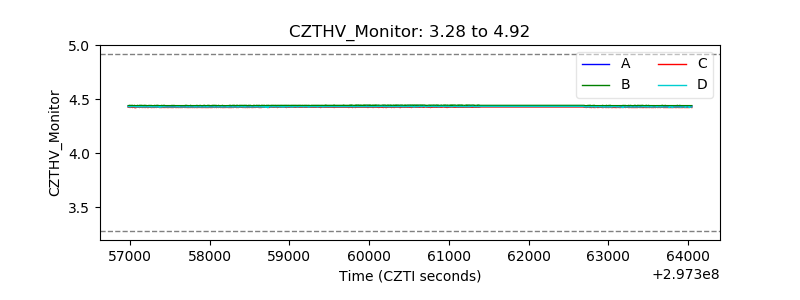 |
| D_VDD | 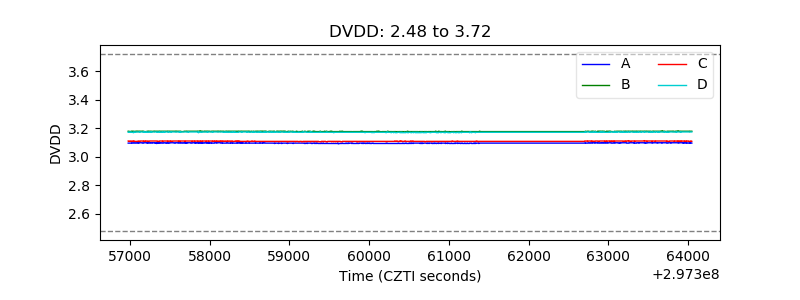 |
| Temperature 1 | 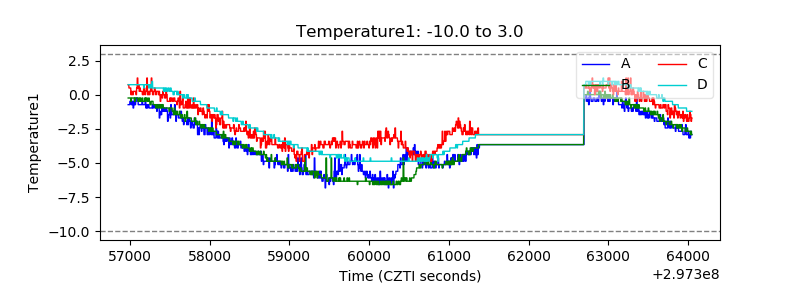 |
| Veto HV Monitor | 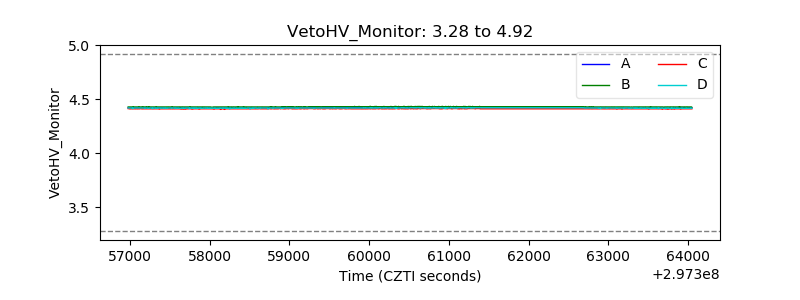 |
| Veto LLD | 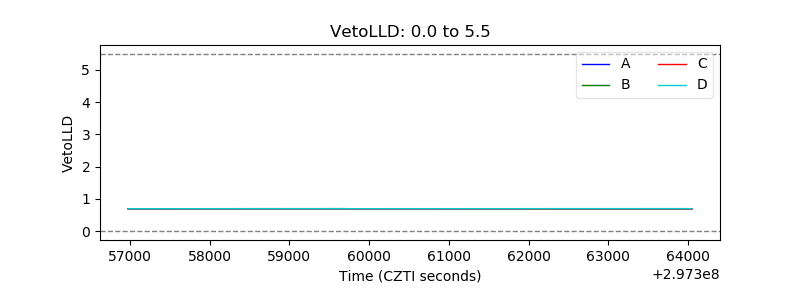 |
| Alpha Counter | 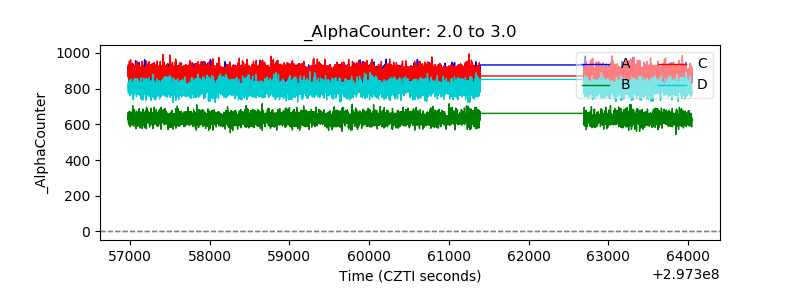 |
| _CPM_Rate | 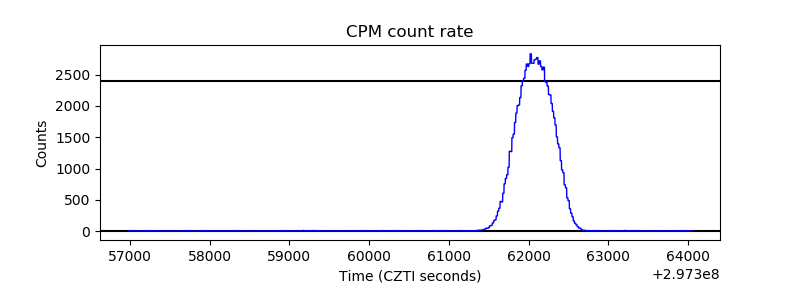 |
| CZT Counter | 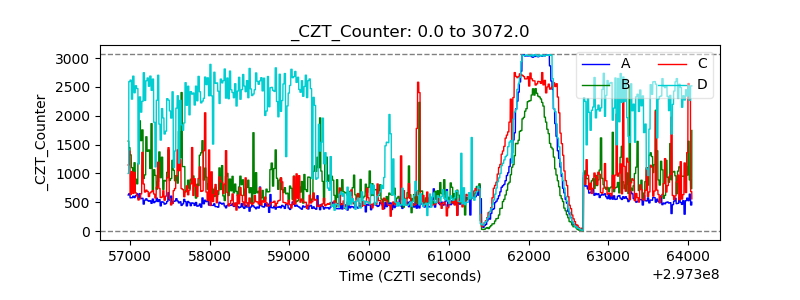 |
| +2.5 Volts monitor | 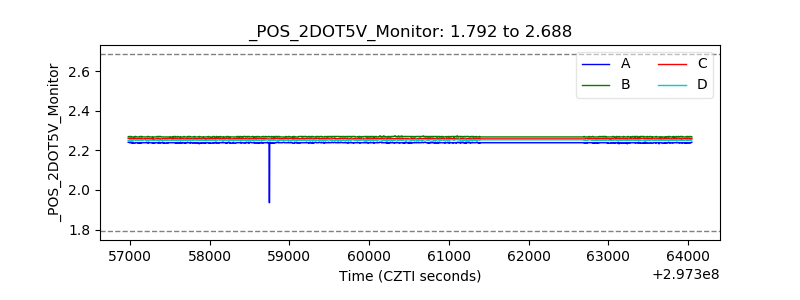 |
| +5 Volts monitor | 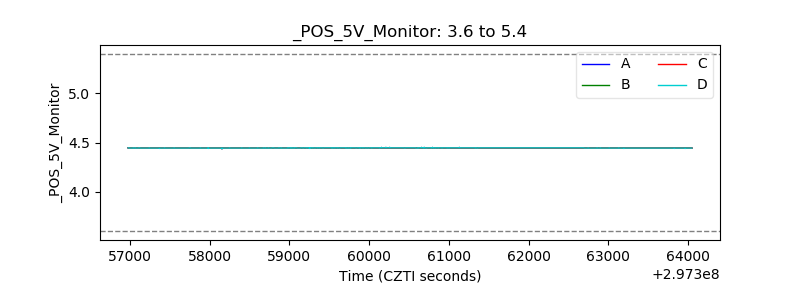 |
| _ROLL_ROT | 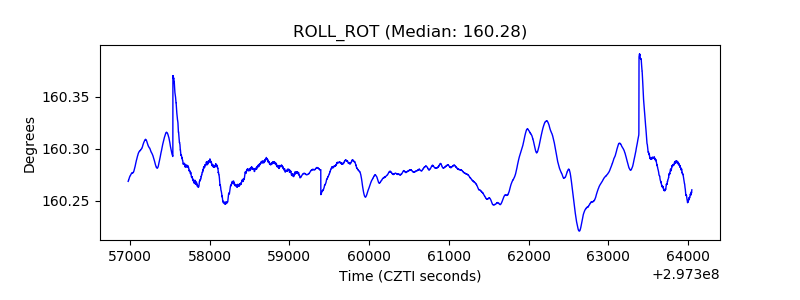 |
| _Roll_DEC | 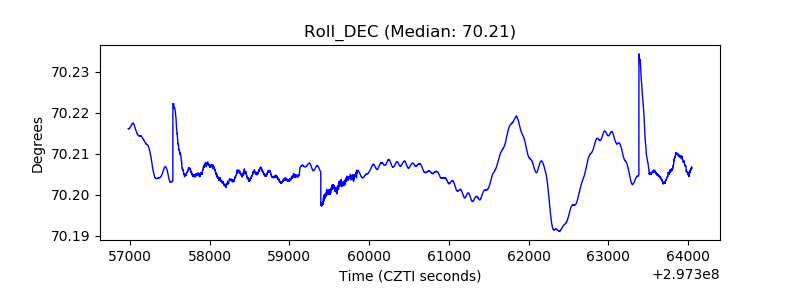 |
| _Roll_RA | 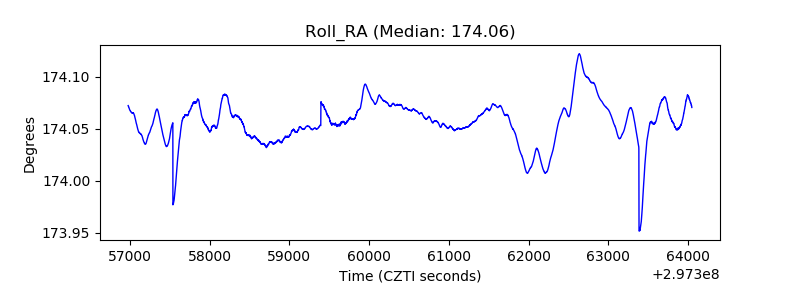 |
| Veto Counter | 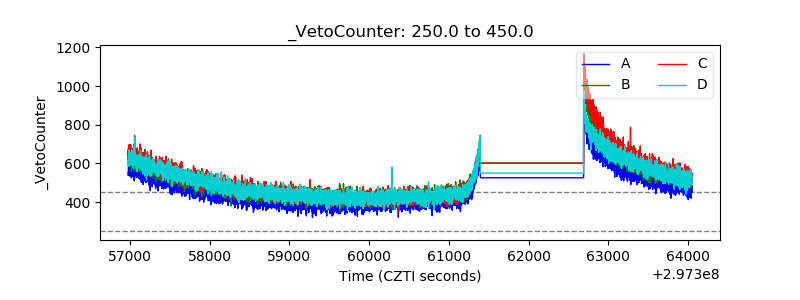 |