| Param | Original file | Final file |
|---|---|---|
| Filename | modeM0/AS1A05_064T01_9000002964_19917cztM0_level2.evt | modeM0/AS1A05_064T01_9000002964_19917cztM0_level2_quad_clean.evt |
| Size (bytes) | 729,936,000 | 95,811,840 |
| Size | 696.1 MB | 91.4 MB |
| Events in quadrant A | 2,852,287 | 716,235 |
| Events in quadrant B | 4,646,057 | 714,301 |
| Events in quadrant C | 4,920,689 | 688,758 |
| Events in quadrant D | 9,296,404 | 376,484 |
| Mode M0 | |||
|---|---|---|---|
| Quadrant | BADHDUFLAG | Total packets | Discarded packets |
| A | 0 | 12108 | 1 |
| B | 0 | 17877 | 4 |
| C | 0 | 18580 | 1 |
| D | 0 | 31493 | 1 |
| Mode SS | |||
|---|---|---|---|
| Quadrant | BADHDUFLAG | Total packets | Discarded packets |
| A | 0 | 118 | 0 |
| B | 0 | 118 | 0 |
| C | 0 | 118 | 0 |
| D | 0 | 118 | 0 |
| Mode M9 | |||
|---|---|---|---|
| Quadrant | BADHDUFLAG | Total packets | Discarded packets |
| A | 0 | 13 | 0 |
| B | 0 | 13 | 0 |
| C | 0 | 13 | 0 |
| D | 0 | 13 | 0 |
| Quadrant | Total seconds | Saturated seconds | Saturation percentage |
|---|---|---|---|
| A | 5780 | 27 | 0.467128% |
| B | 5780 | 137 | 2.370242% |
| C | 5780 | 580 | 10.034602% |
| D | 5780 | 3100 | 53.633218% |
Noise dominated data is calculated using 1-second bins in cleaned event files. If a bin has >2000 counts, and if more than 50% of those come from <1% of pixels, then it is considered to be noise-dominated and hence unusable.
| Quadrant | # 1 sec bins | Bins with >0 counts | Bins with >2000 counts | High rate bins dominated by noise | Noise dominated (total time) | Noise dominated (detector-on time) | Marked lightcurve |
|---|---|---|---|---|---|---|---|
| A | 7105 | 5781 | 2 | 2 | 0.03% | 0.03% | 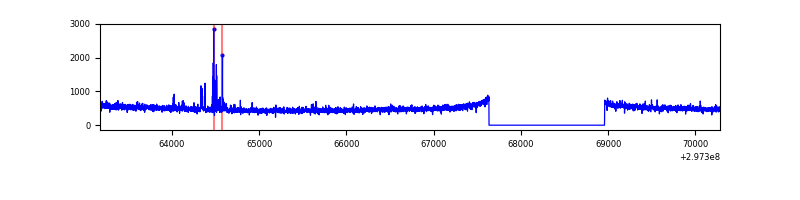 |
| B | 7105 | 5780 | 63 | 63 | 0.89% | 1.09% | 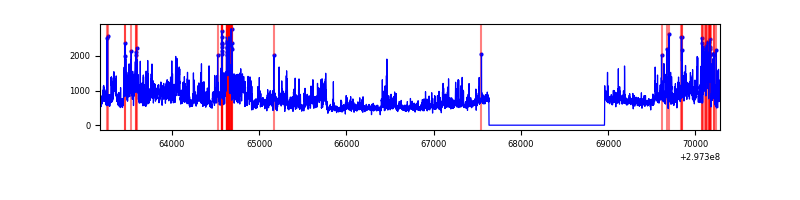 |
| C | 7105 | 5780 | 317 | 317 | 4.46% | 5.48% | 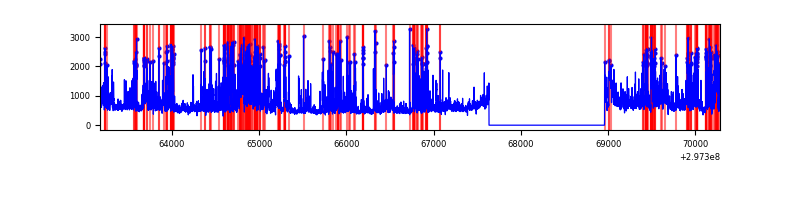 |
| D | 7104 | 5779 | 2673 | 2673 | 37.63% | 46.25% | 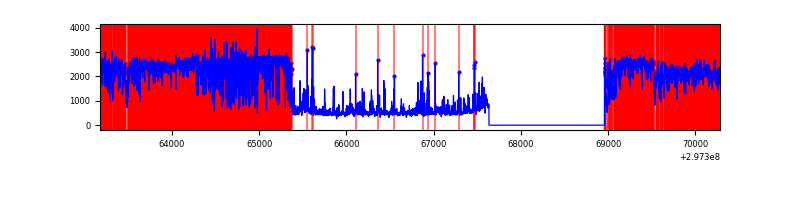 |
Top three noisy pixels from each quadrant. If the there are fewer than three noisy pixels in the level2.evt file, extra rows are filled as -1
| Pixel properties | Quadrant properties | ||||||
|---|---|---|---|---|---|---|---|
| Quadrant | DetID | PixID | Counts | Sigma | Mean | Median | Sigma |
| A | 10 | 253 | 53084 | 368.93 | 716 | 702 | 142.0 |
| A | 8 | 205 | 22334 | 152.36 | 716 | 702 | 142.0 |
| A | 8 | 35 | 12807 | 85.25 | 716 | 702 | 142.0 |
| B | 3 | 112 | 1604145 | 12108.29 | 719 | 703 | 132.4 |
| B | 4 | 171 | 64436 | 481.28 | 719 | 703 | 132.4 |
| B | 0 | 197 | 40225 | 298.45 | 719 | 703 | 132.4 |
| C | 4 | 254 | 1246843 | 7819.97 | 692 | 698 | 159.4 |
| C | 9 | 221 | 805389 | 5049.7 | 692 | 698 | 159.4 |
| C | 14 | 238 | 107603 | 670.86 | 692 | 698 | 159.4 |
| D | 7 | 38 | 4782556 | 42769.36 | 458 | 443 | 111.8 |
| D | 12 | 218 | 1254369 | 11214.63 | 458 | 443 | 111.8 |
| D | 2 | 184 | 1193552 | 10670.7 | 458 | 443 | 111.8 |
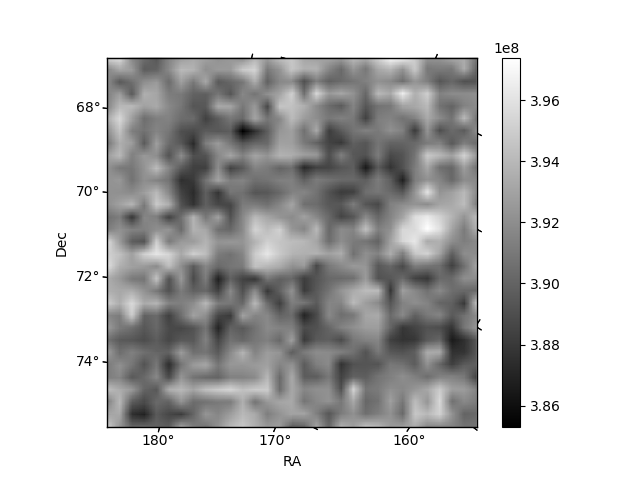
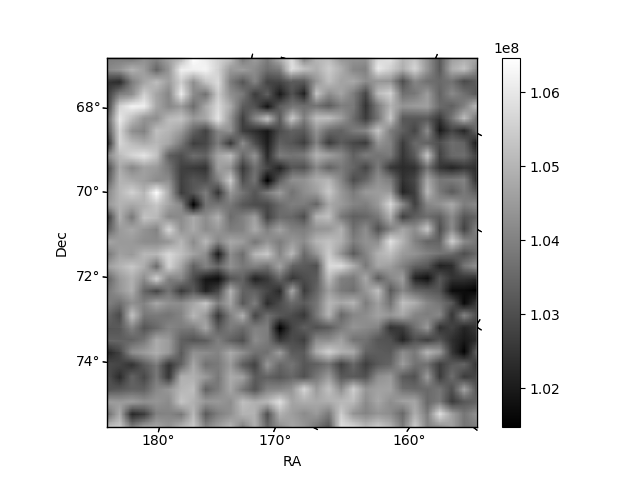
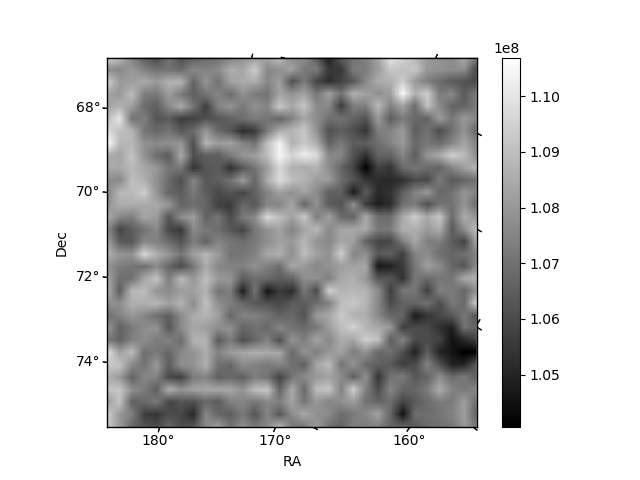
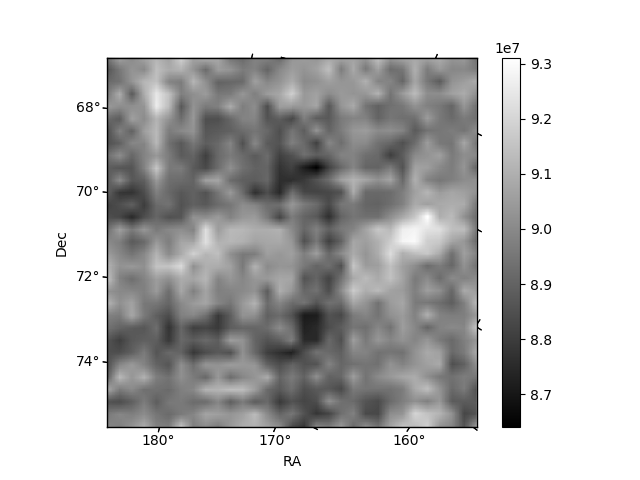
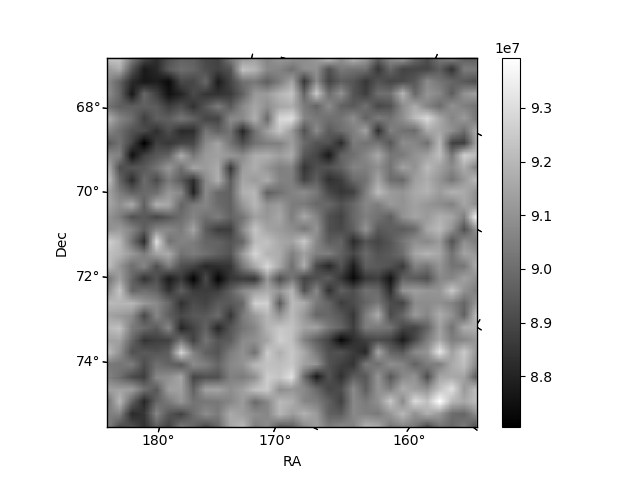
Histogram calculated using DETX and DETY for each event in the final _common_clean file
| Quadrant A | 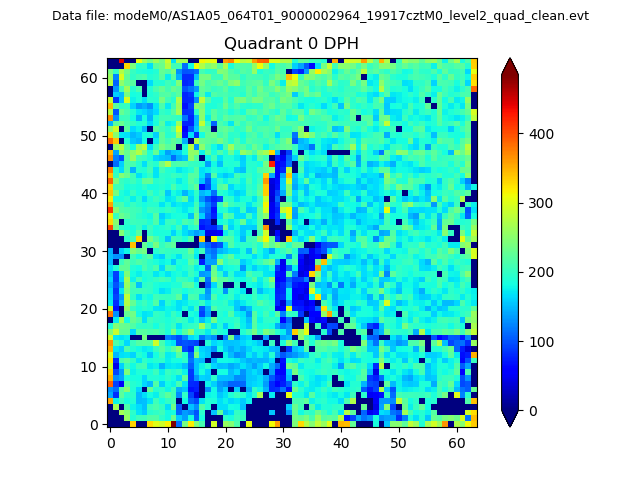 |
 |
Quadrant B |
|---|---|---|---|
| Quadrant D | 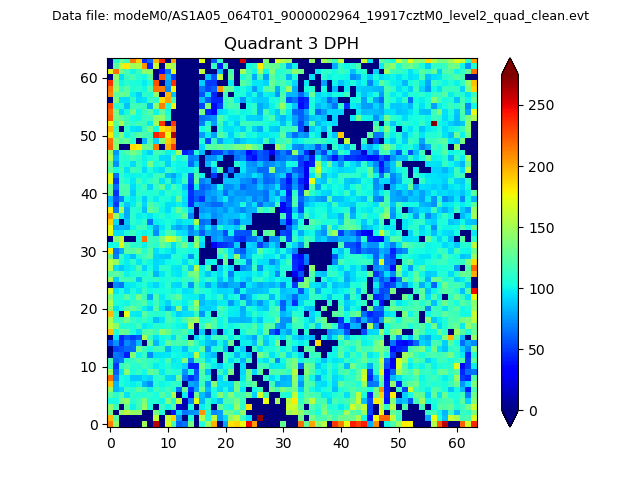 |
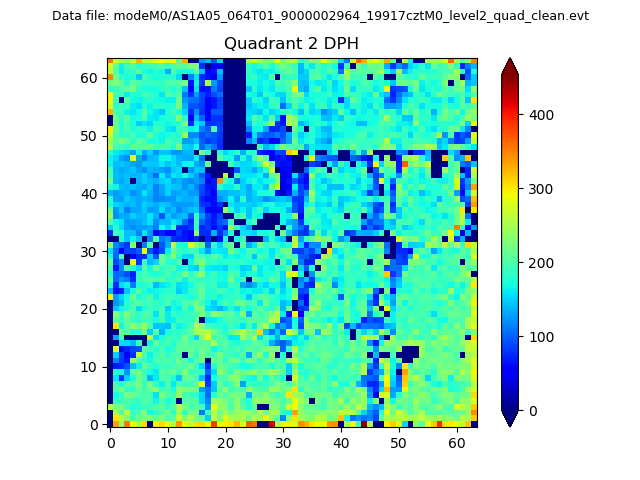 |
Quadrant C |
| Plot type | Count rate plots | Images |
|---|---|---|
| Comparison with Poisson distribution Blue bars denote a histogram of data divided into 1 sec bins. Red curve is a Poisson curve with rate = median count rate of data. |
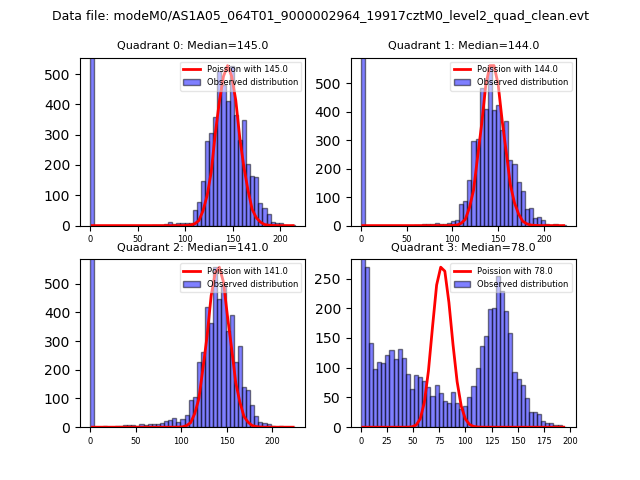 |
 |
| Quadrant-wise count rates Data is divided into 100 sec bins |
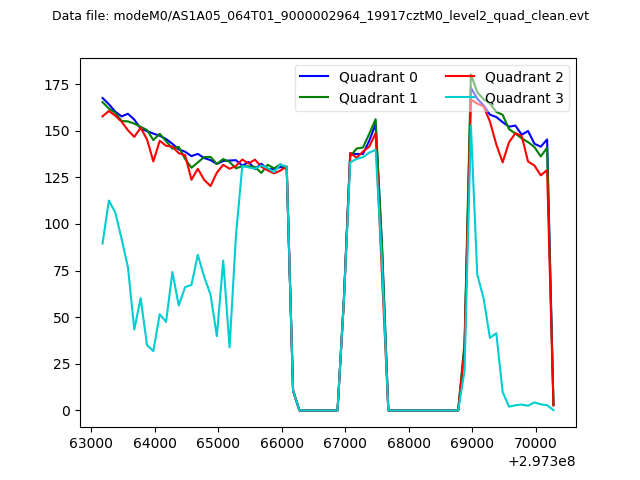 |
|
| Module-wise count rates for Quadrant A Data is divided into 100 sec bins |
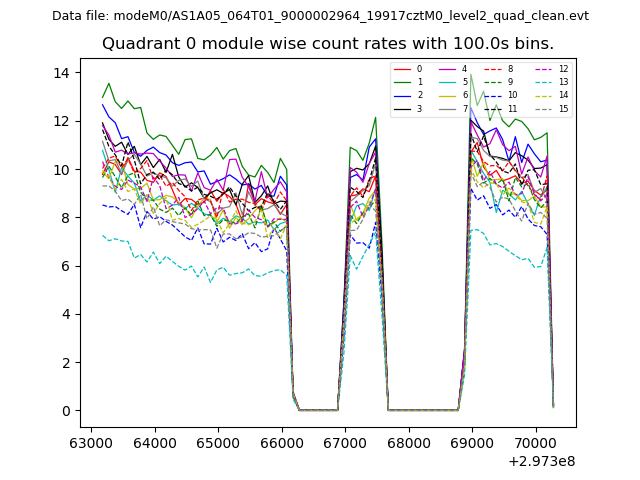 |
 |
| Module-wise count rates for Quadrant B Data is divided into 100 sec bins |
 |
 |
| Module-wise count rates for Quadrant C Data is divided into 100 sec bins |
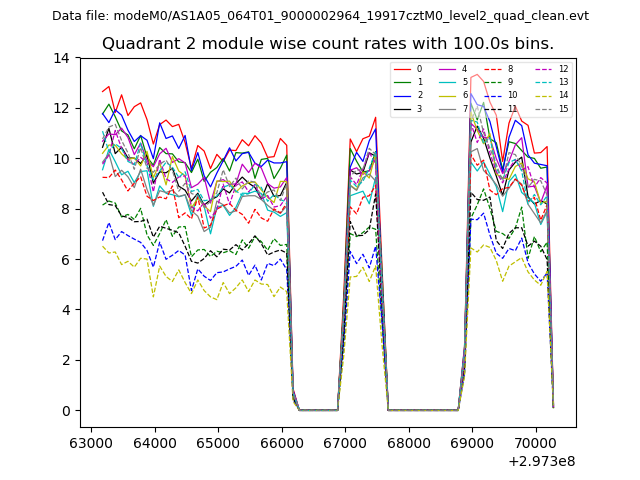 |
 |
| Module-wise count rates for Quadrant D Data is divided into 100 sec bins |
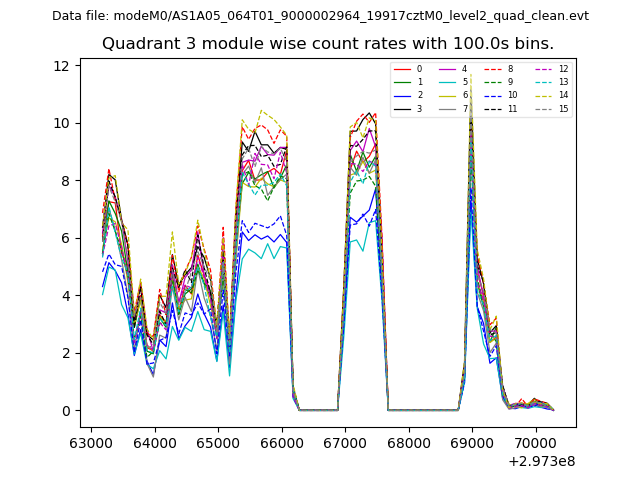 |
 |
| Parameter | Plot |
|---|---|
| CZT HV Monitor | 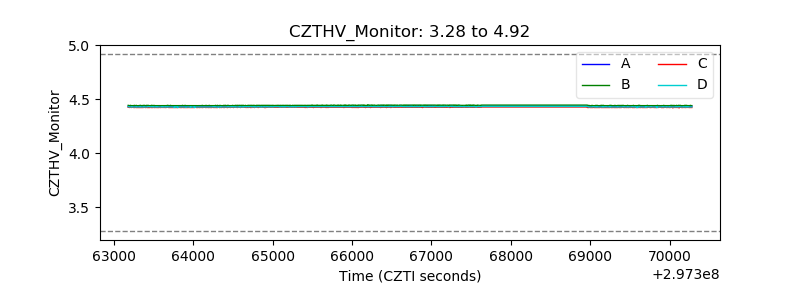 |
| D_VDD | 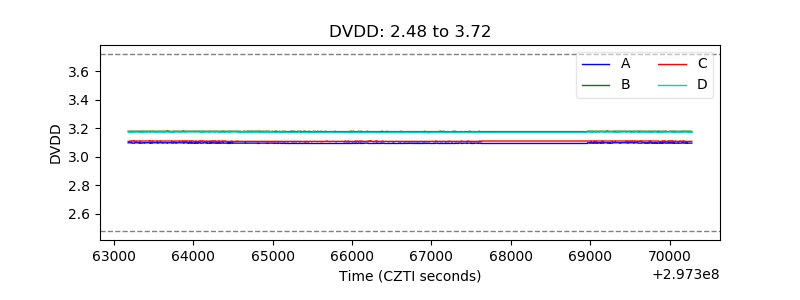 |
| Temperature 1 | 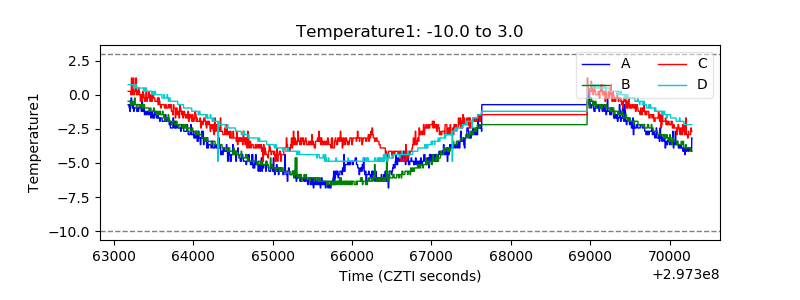 |
| Veto HV Monitor | 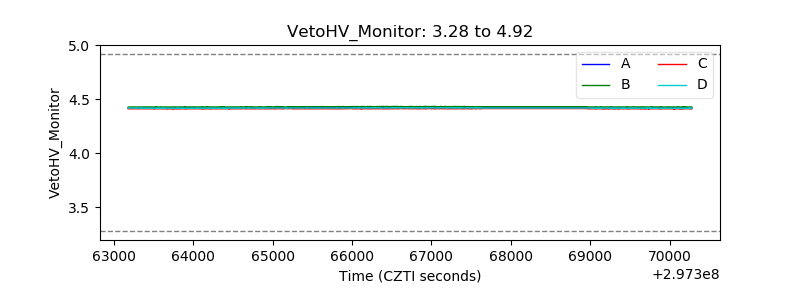 |
| Veto LLD | 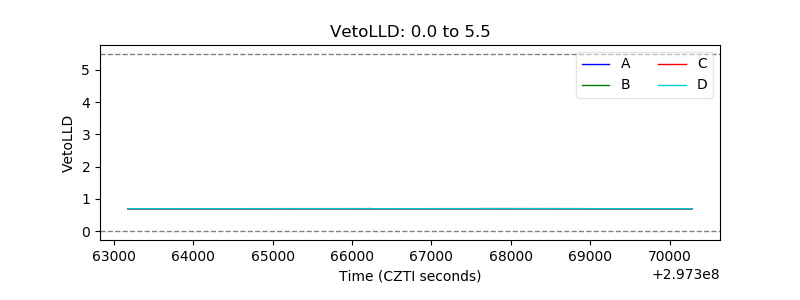 |
| Alpha Counter | 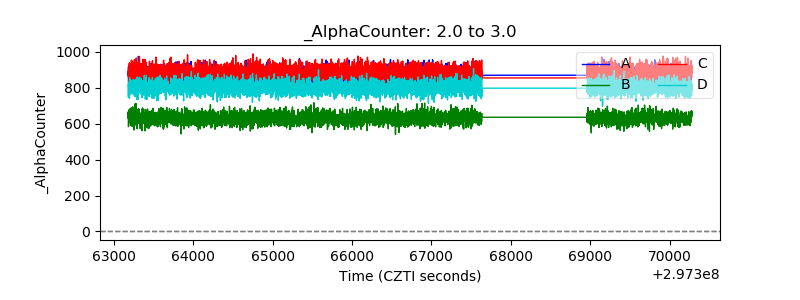 |
| _CPM_Rate | 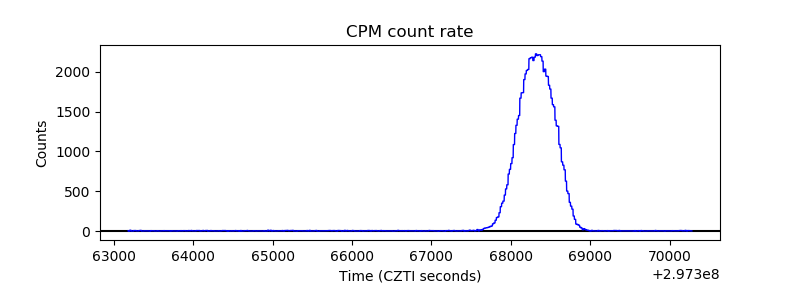 |
| CZT Counter | 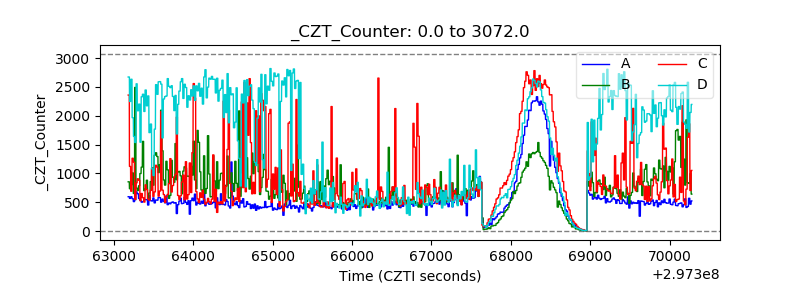 |
| +2.5 Volts monitor |  |
| +5 Volts monitor | 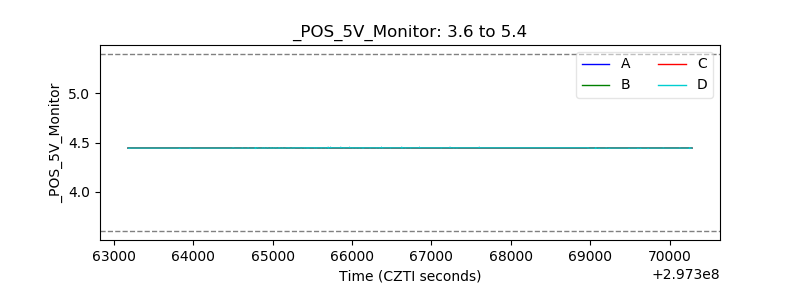 |
| _ROLL_ROT | 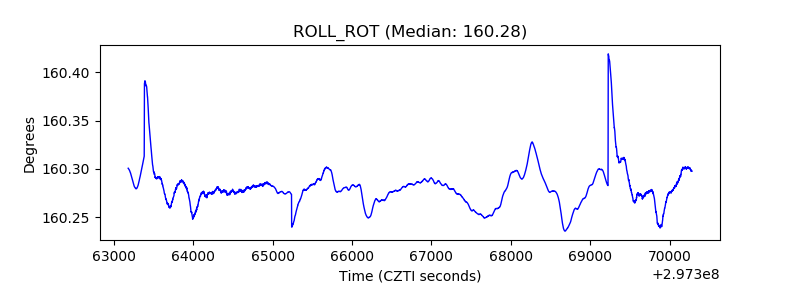 |
| _Roll_DEC | 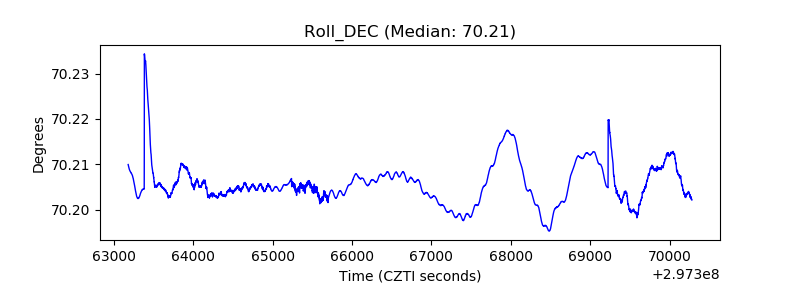 |
| _Roll_RA | 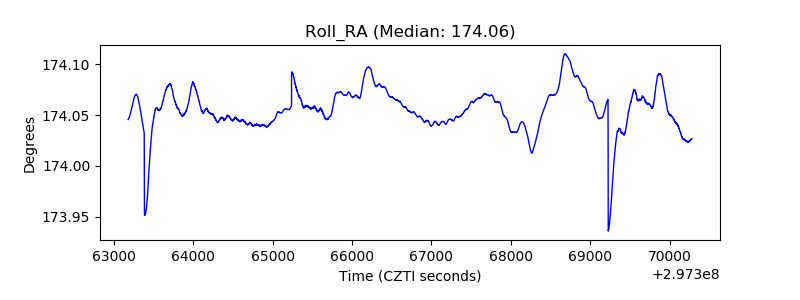 |
| Veto Counter | 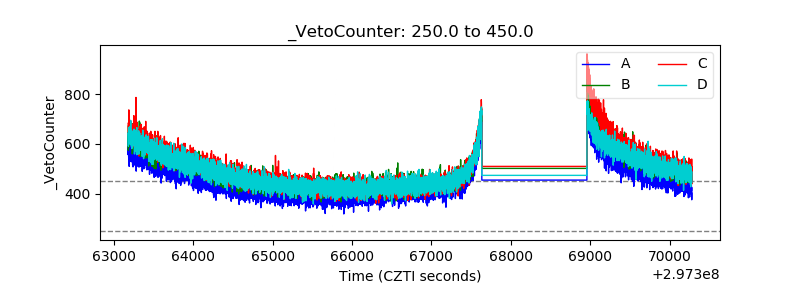 |