| Param | Original file | Final file |
|---|---|---|
| Filename | modeM0/AS1A05_064T01_9000002964_19918cztM0_level2.evt | modeM0/AS1A05_064T01_9000002964_19918cztM0_level2_quad_clean.evt |
| Size (bytes) | 893,522,880 | 95,014,080 |
| Size | 852.1 MB | 90.6 MB |
| Events in quadrant A | 2,970,280 | 756,303 |
| Events in quadrant B | 4,513,859 | 758,637 |
| Events in quadrant C | 5,170,503 | 727,151 |
| Events in quadrant D | 13,984,004 | 197,320 |
| Mode M0 | |||
|---|---|---|---|
| Quadrant | BADHDUFLAG | Total packets | Discarded packets |
| A | 0 | 12958 | 1 |
| B | 0 | 17815 | 1 |
| C | 0 | 19628 | 1 |
| D | 0 | 45810 | 7 |
| Mode SS | |||
|---|---|---|---|
| Quadrant | BADHDUFLAG | Total packets | Discarded packets |
| A | 0 | 126 | 0 |
| B | 0 | 126 | 0 |
| C | 0 | 126 | 0 |
| D | 0 | 126 | 0 |
| Mode M9 | |||
|---|---|---|---|
| Quadrant | BADHDUFLAG | Total packets | Discarded packets |
| A | 0 | 15 | 0 |
| B | 0 | 16 | 0 |
| C | 0 | 16 | 0 |
| D | 0 | 16 | 0 |
| Quadrant | Total seconds | Saturated seconds | Saturation percentage |
|---|---|---|---|
| A | 6243 | 14 | 0.224251% |
| B | 6243 | 124 | 1.986225% |
| C | 6243 | 605 | 9.690854% |
| D | 6242 | 5784 | 92.662608% |
Noise dominated data is calculated using 1-second bins in cleaned event files. If a bin has >2000 counts, and if more than 50% of those come from <1% of pixels, then it is considered to be noise-dominated and hence unusable.
| Quadrant | # 1 sec bins | Bins with >0 counts | Bins with >2000 counts | High rate bins dominated by noise | Noise dominated (total time) | Noise dominated (detector-on time) | Marked lightcurve |
|---|---|---|---|---|---|---|---|
| A | 7498 | 6244 | 2 | 2 | 0.03% | 0.03% |  |
| B | 7498 | 6243 | 41 | 41 | 0.55% | 0.66% |  |
| C | 7498 | 6243 | 230 | 230 | 3.07% | 3.68% |  |
| D | 7496 | 6241 | 4898 | 4898 | 65.34% | 78.48% |  |
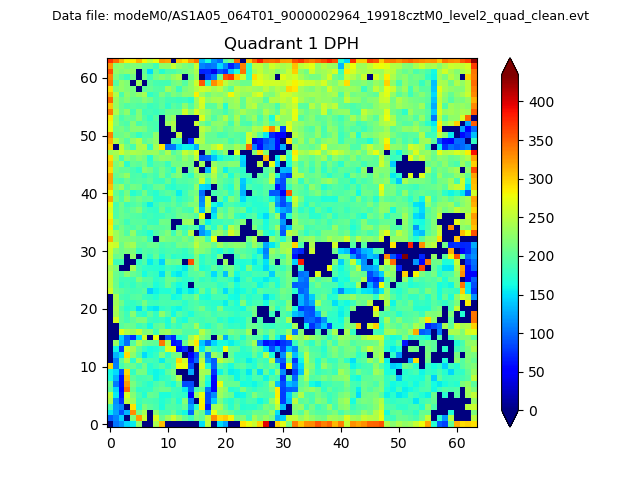
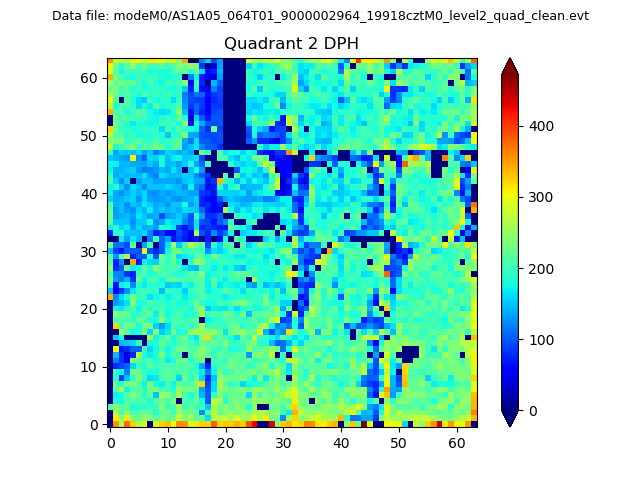
Top three noisy pixels from each quadrant. If the there are fewer than three noisy pixels in the level2.evt file, extra rows are filled as -1
| Pixel properties | Quadrant properties | ||||||
|---|---|---|---|---|---|---|---|
| Quadrant | DetID | PixID | Counts | Sigma | Mean | Median | Sigma |
| A | 5 | 16 | 52948 | 344.73 | 756 | 741 | 151.4 |
| A | 8 | 35 | 7559 | 45.02 | 756 | 741 | 151.4 |
| A | 0 | 226 | 6651 | 39.02 | 756 | 741 | 151.4 |
| B | 3 | 112 | 1289667 | 9127.82 | 764 | 746 | 141.2 |
| B | 0 | 197 | 49990 | 348.73 | 764 | 746 | 141.2 |
| B | 4 | 216 | 42075 | 292.68 | 764 | 746 | 141.2 |
| C | 9 | 221 | 1526428 | 8992.35 | 733 | 738 | 169.7 |
| C | 4 | 254 | 620465 | 3652.64 | 733 | 738 | 169.7 |
| C | 14 | 238 | 115543 | 676.66 | 733 | 738 | 169.7 |
| D | 2 | 184 | 8740115 | 128138.9 | 275 | 267 | 68.2 |
| D | 7 | 38 | 2740353 | 40173.65 | 275 | 267 | 68.2 |
| D | 12 | 218 | 1191093 | 17459.24 | 275 | 267 | 68.2 |
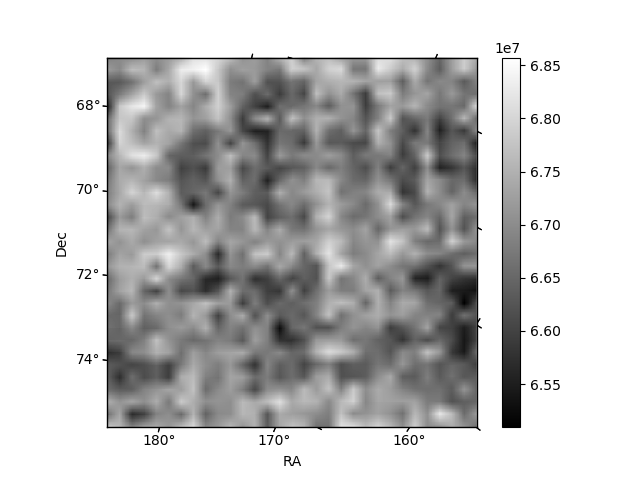
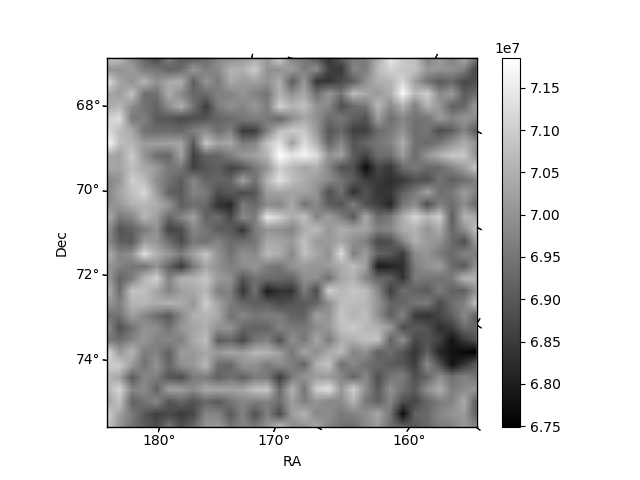
Histogram calculated using DETX and DETY for each event in the final _common_clean file
| Quadrant A | 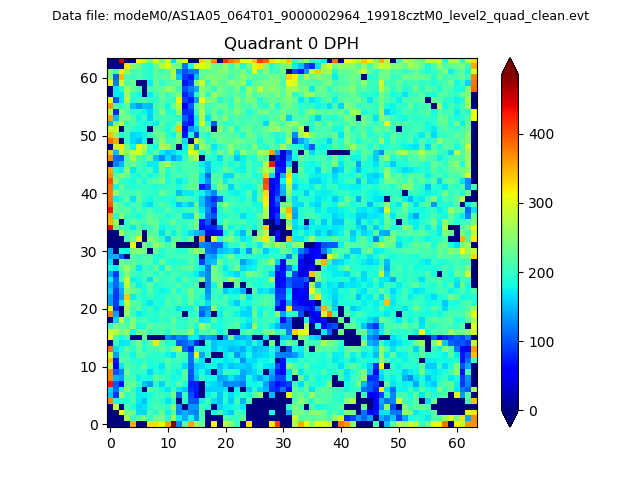 |
 |
Quadrant B |
|---|---|---|---|
| Quadrant D | 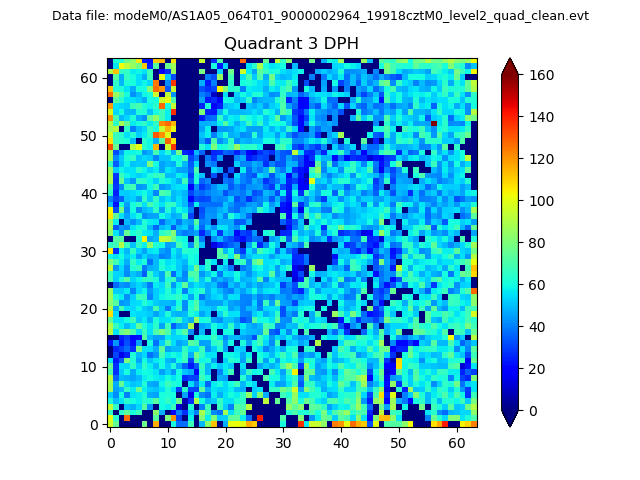 |
 |
Quadrant C |
| Plot type | Count rate plots | Images |
|---|---|---|
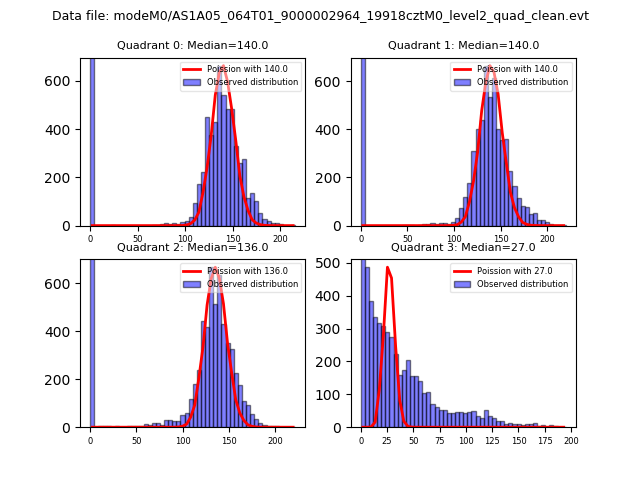
| Comparison with Poisson distribution Blue bars denote a histogram of data divided into 1 sec bins. Red curve is a Poisson curve with rate = median count rate of data. |
 |
 |
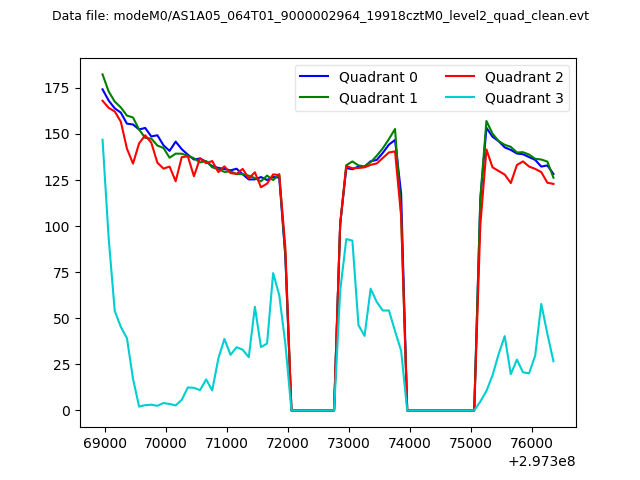
| Quadrant-wise count rates Data is divided into 100 sec bins |
 |
|
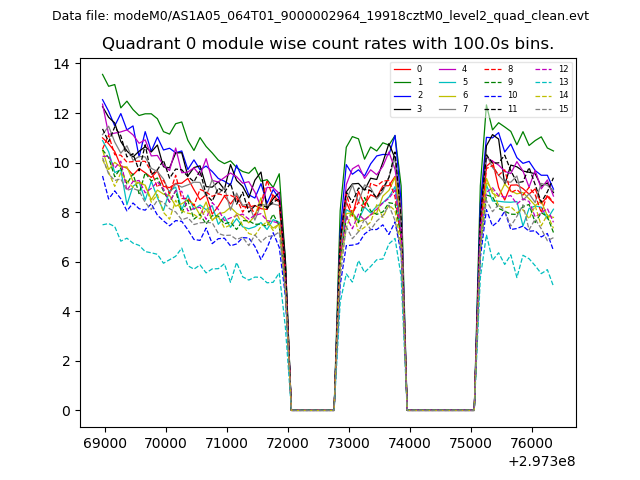
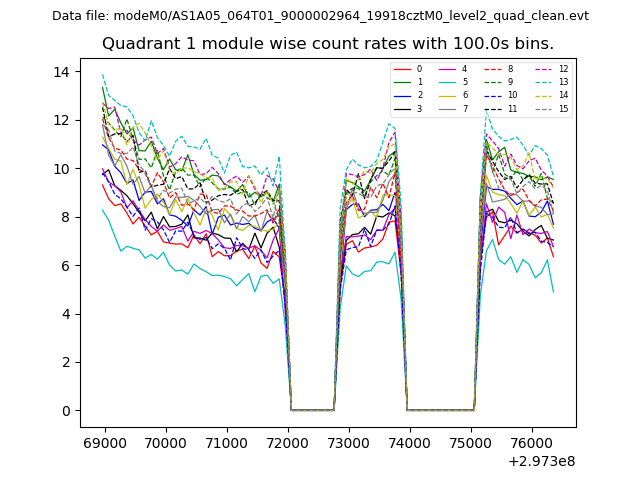
| Module-wise count rates for Quadrant A Data is divided into 100 sec bins |
 |
 |
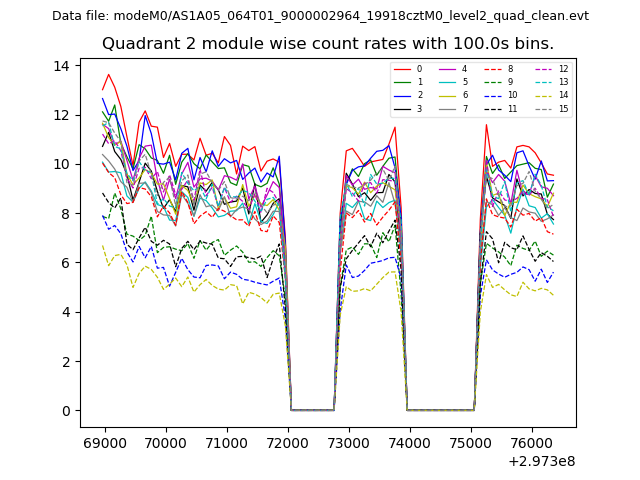
| Module-wise count rates for Quadrant B Data is divided into 100 sec bins |
 |
 |
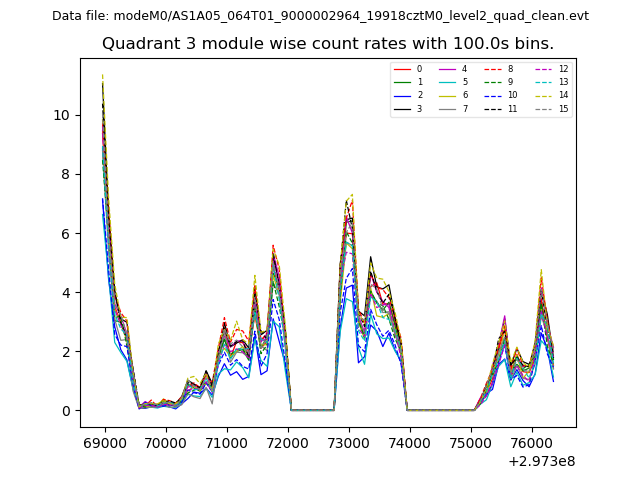
| Module-wise count rates for Quadrant C Data is divided into 100 sec bins |
 |
 |
| Module-wise count rates for Quadrant D Data is divided into 100 sec bins |
 |
 |
| Parameter | Plot |
|---|---|
| CZT HV Monitor | 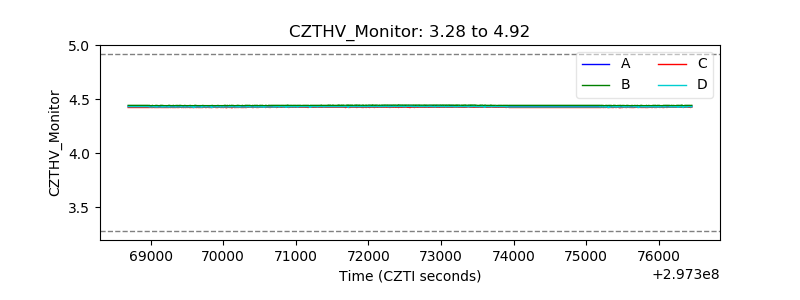 |
| D_VDD | 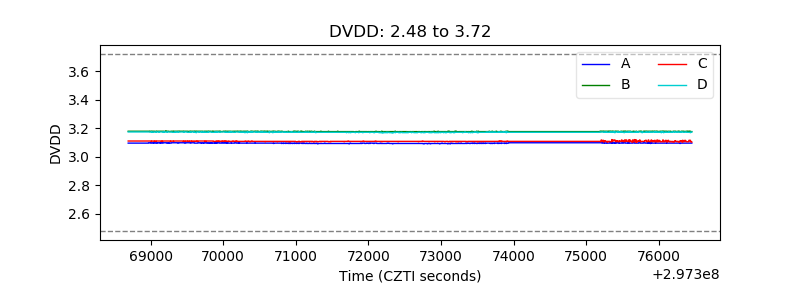 |
| Temperature 1 | 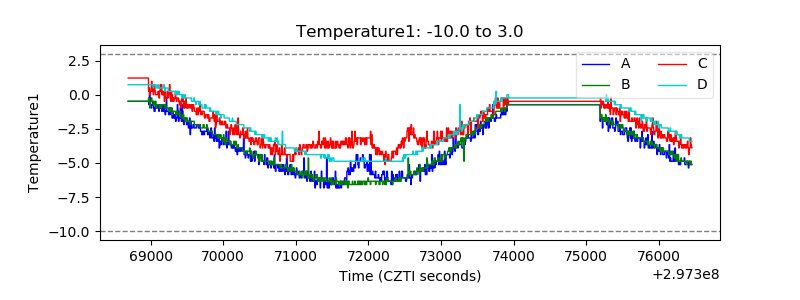 |
| Veto HV Monitor | 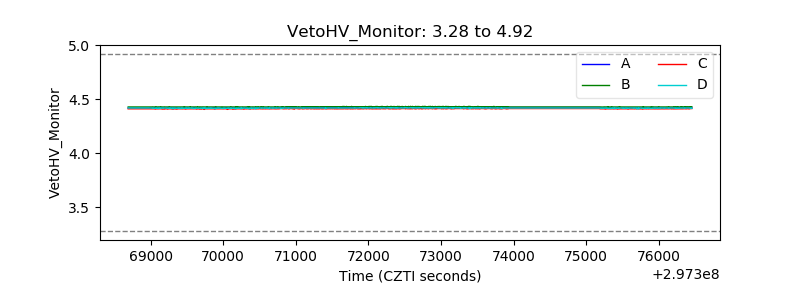 |
| Veto LLD | 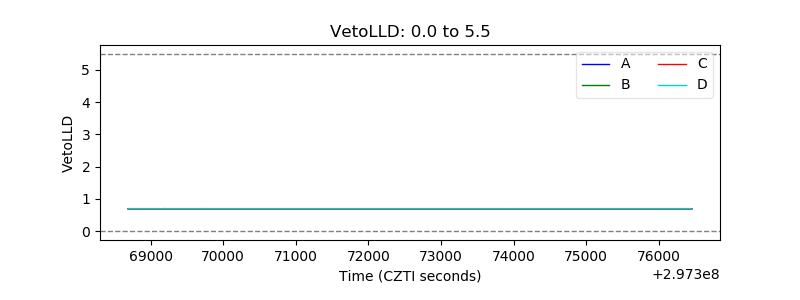 |
| Alpha Counter | 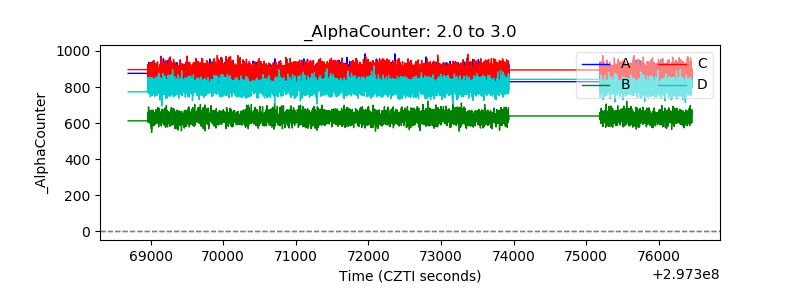 |
| _CPM_Rate | 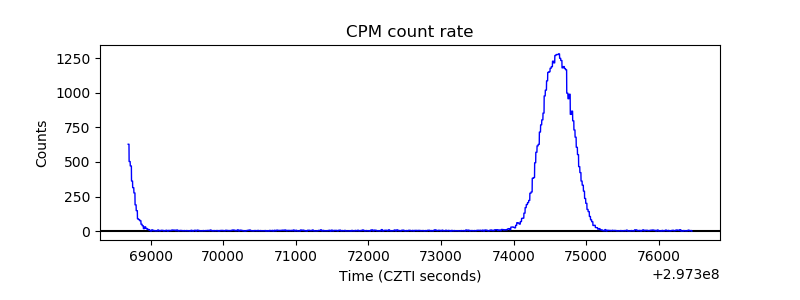 |
| CZT Counter | 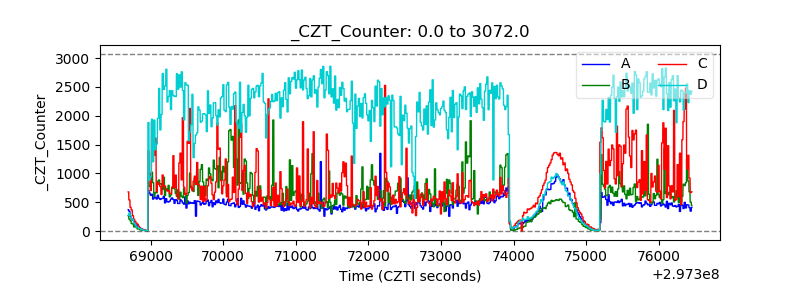 |
| +2.5 Volts monitor |  |
| +5 Volts monitor | 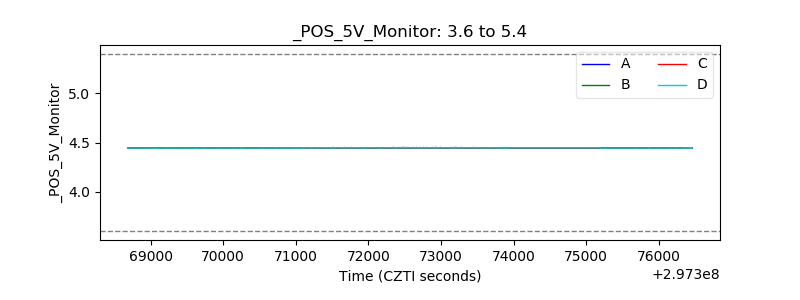 |
| _ROLL_ROT | 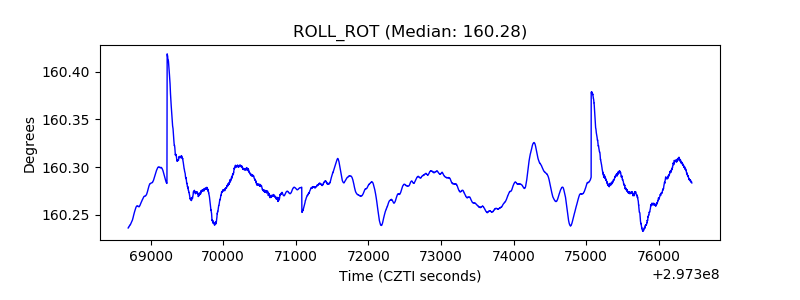 |
| _Roll_DEC | 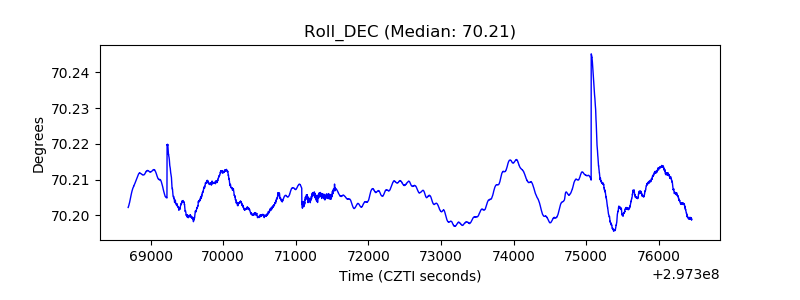 |
| _Roll_RA | 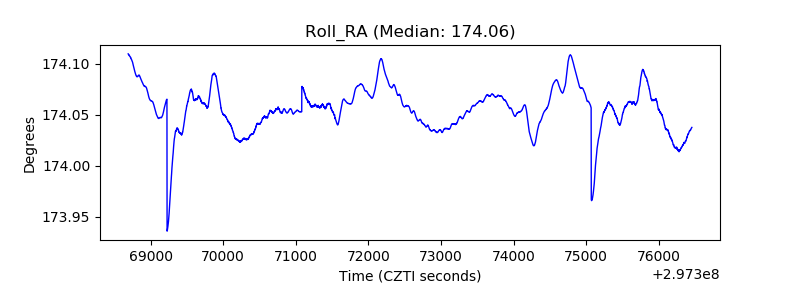 |
| Veto Counter | 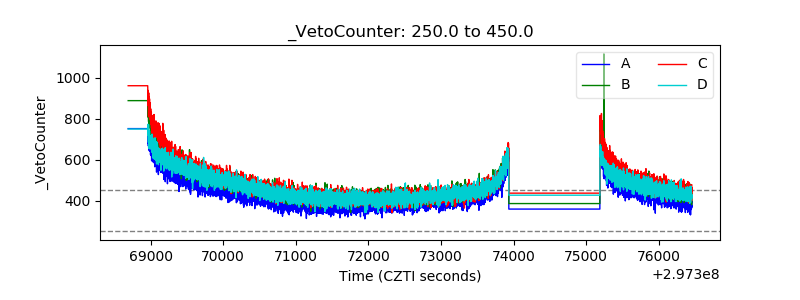 |