| Param | Original file | Final file |
|---|---|---|
| Filename | modeM0/AS1A05_064T01_9000002964_19920cztM0_level2.evt | modeM0/AS1A05_064T01_9000002964_19920cztM0_level2_quad_clean.evt |
| Size (bytes) | 726,534,720 | 111,818,880 |
| Size | 692.9 MB | 106.6 MB |
| Events in quadrant A | 3,836,467 | 754,521 |
| Events in quadrant B | 3,806,989 | 777,559 |
| Events in quadrant C | 5,942,789 | 731,201 |
| Events in quadrant D | 7,947,431 | 638,463 |
| Mode M0 | |||
|---|---|---|---|
| Quadrant | BADHDUFLAG | Total packets | Discarded packets |
| A | 0 | 16392 | 2 |
| B | 0 | 15971 | 2 |
| C | 0 | 22421 | 2 |
| D | 0 | 28520 | 2 |
| Mode SS | |||
|---|---|---|---|
| Quadrant | BADHDUFLAG | Total packets | Discarded packets |
| A | 0 | 142 | 0 |
| B | 0 | 142 | 0 |
| C | 0 | 142 | 0 |
| D | 0 | 142 | 0 |
| Mode M9 | |||
|---|---|---|---|
| Quadrant | BADHDUFLAG | Total packets | Discarded packets |
| A | 0 | 14 | 0 |
| B | 0 | 15 | 0 |
| C | 0 | 15 | 0 |
| D | 0 | 15 | 0 |
| Quadrant | Total seconds | Saturated seconds | Saturation percentage |
|---|---|---|---|
| A | 6941 | 232 | 3.342458% |
| B | 6941 | 106 | 1.527157% |
| C | 6941 | 658 | 9.479902% |
| D | 6941 | 1748 | 25.183691% |
Noise dominated data is calculated using 1-second bins in cleaned event files. If a bin has >2000 counts, and if more than 50% of those come from <1% of pixels, then it is considered to be noise-dominated and hence unusable.
| Quadrant | # 1 sec bins | Bins with >0 counts | Bins with >2000 counts | High rate bins dominated by noise | Noise dominated (total time) | Noise dominated (detector-on time) | Marked lightcurve |
|---|---|---|---|---|---|---|---|
| A | 7566 | 6942 | 158 | 158 | 2.09% | 2.28% | 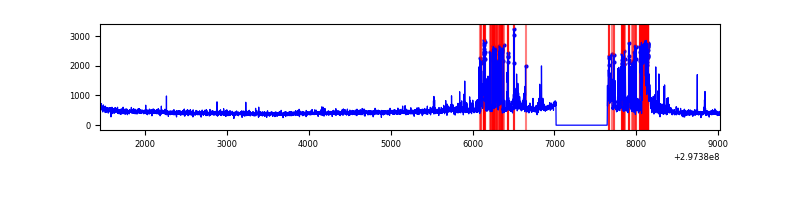 |
| B | 7566 | 6941 | 20 | 20 | 0.26% | 0.29% | 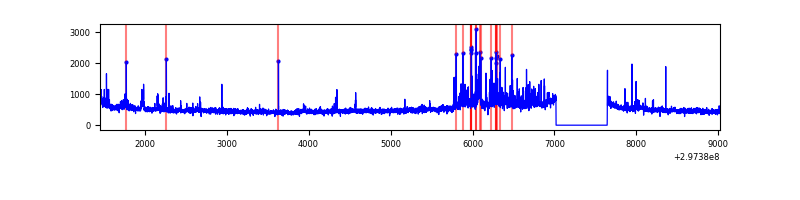 |
| C | 7566 | 6941 | 291 | 291 | 3.85% | 4.19% | 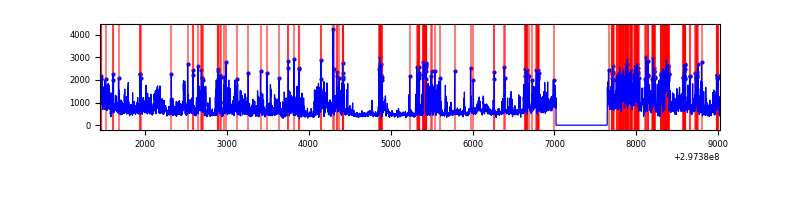 |
| D | 7566 | 6941 | 1563 | 1563 | 20.66% | 22.52% |  |
Top three noisy pixels from each quadrant. If the there are fewer than three noisy pixels in the level2.evt file, extra rows are filled as -1
| Pixel properties | Quadrant properties | ||||||
|---|---|---|---|---|---|---|---|
| Quadrant | DetID | PixID | Counts | Sigma | Mean | Median | Sigma |
| A | 14 | 238 | 781612 | 4872.33 | 792 | 773 | 160.3 |
| A | 0 | 226 | 6910 | 38.29 | 792 | 773 | 160.3 |
| A | 3 | 137 | 6075 | 33.08 | 792 | 773 | 160.3 |
| B | 3 | 112 | 262631 | 1717.1 | 806 | 785 | 152.5 |
| B | 7 | 220 | 191646 | 1251.6 | 806 | 785 | 152.5 |
| B | 0 | 197 | 58159 | 376.24 | 806 | 785 | 152.5 |
| C | 9 | 221 | 2399774 | 13469.99 | 764 | 769 | 178.1 |
| C | 4 | 254 | 262169 | 1467.71 | 764 | 769 | 178.1 |
| C | 3 | 233 | 175145 | 979.09 | 764 | 769 | 178.1 |
| D | 12 | 218 | 2128389 | 12370.81 | 706 | 684 | 172.0 |
| D | 7 | 38 | 1908163 | 11090.39 | 706 | 684 | 172.0 |
| D | 7 | 238 | 511356 | 2969.13 | 706 | 684 | 172.0 |
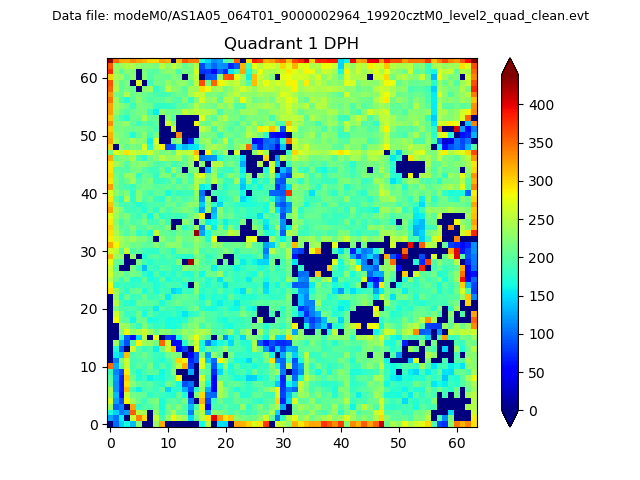
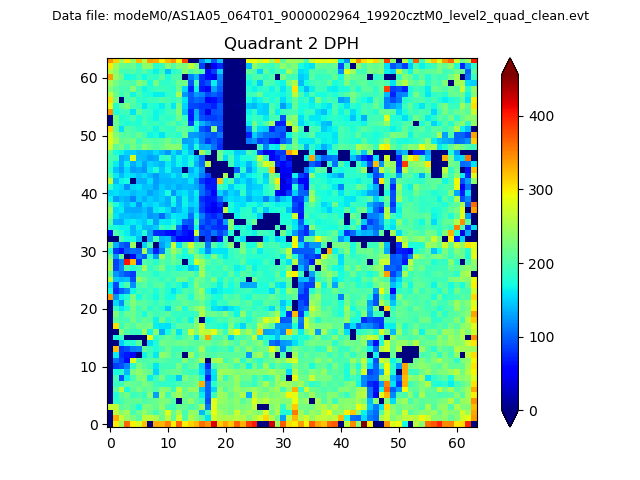
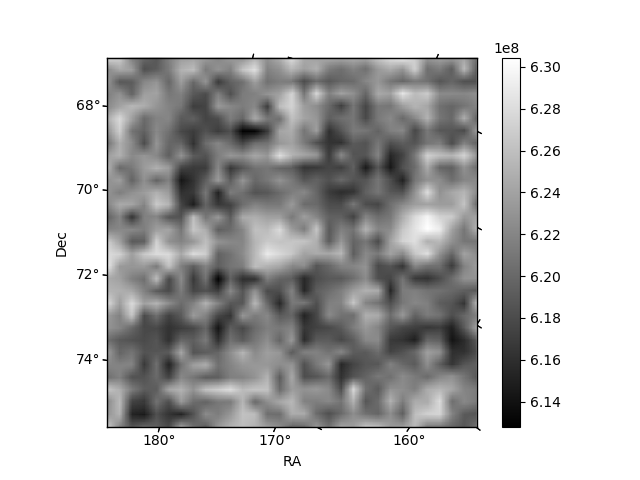
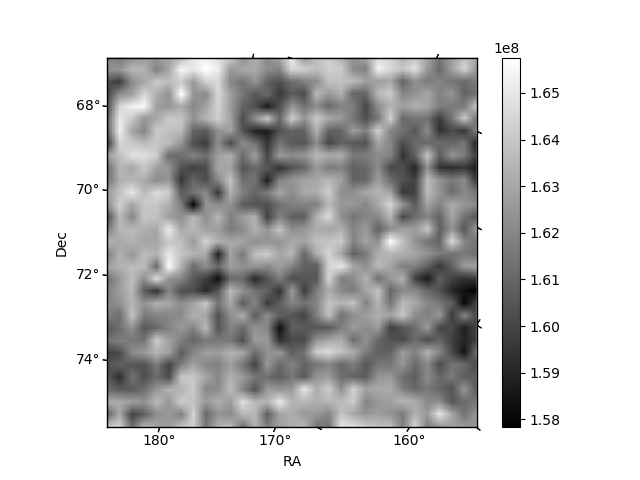
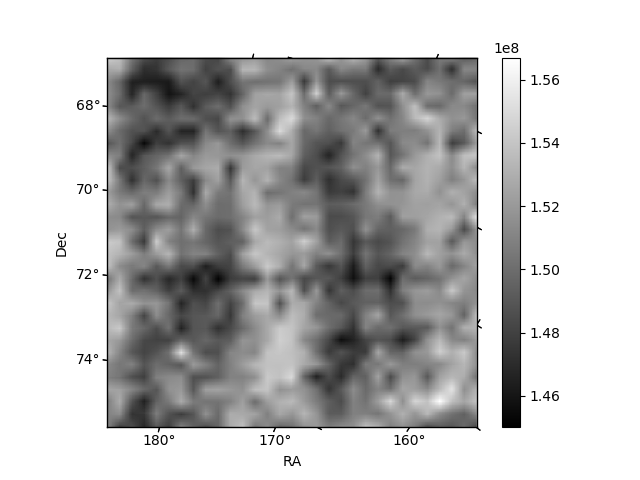
Histogram calculated using DETX and DETY for each event in the final _common_clean file
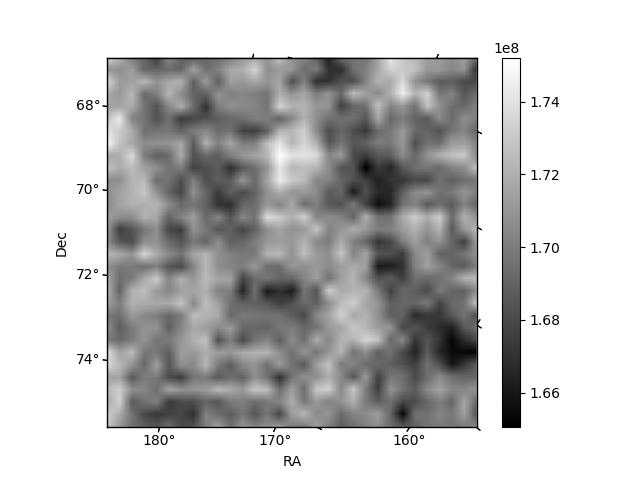
| Quadrant A | 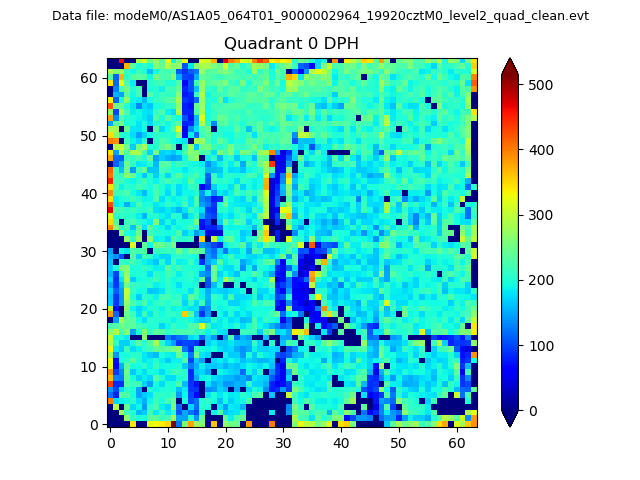 |
 |
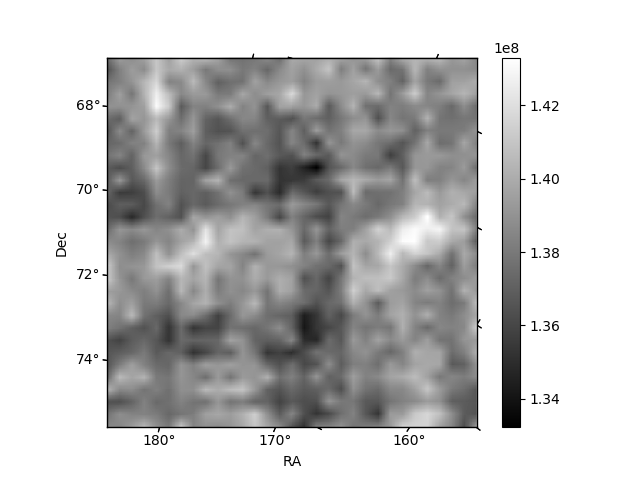
Quadrant B |
|---|---|---|---|
| Quadrant D | 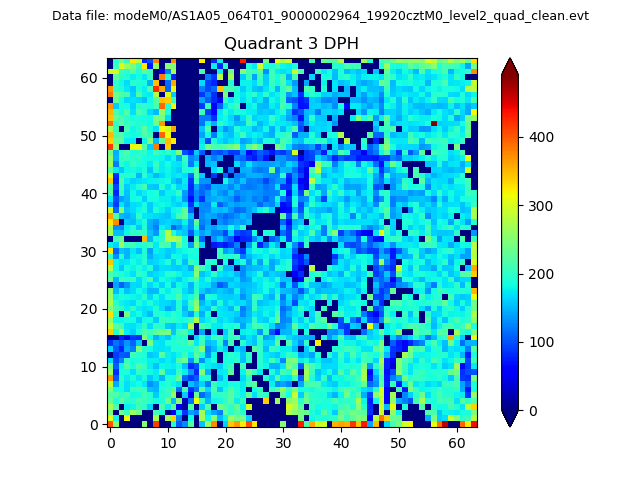 |
 |
Quadrant C |
| Plot type | Count rate plots | Images |
|---|---|---|
| Comparison with Poisson distribution Blue bars denote a histogram of data divided into 1 sec bins. Red curve is a Poisson curve with rate = median count rate of data. |
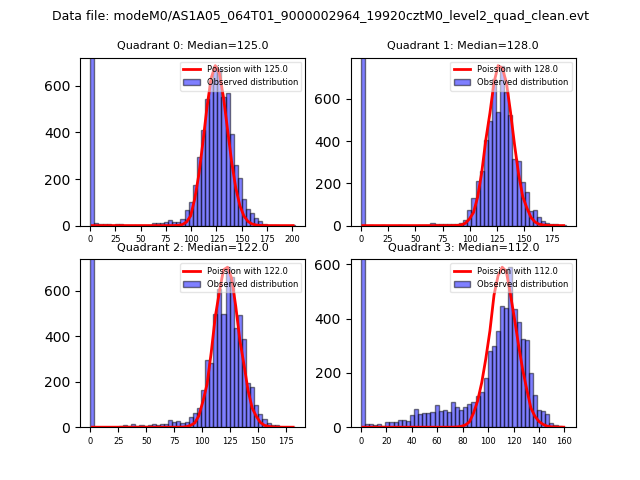 |
 |
| Quadrant-wise count rates Data is divided into 100 sec bins |
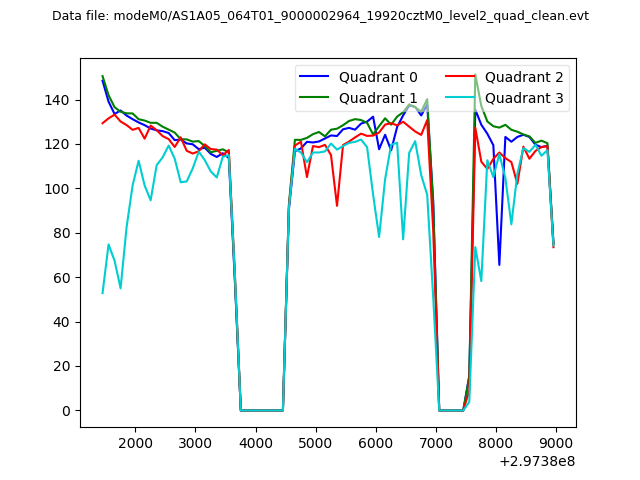 |
|
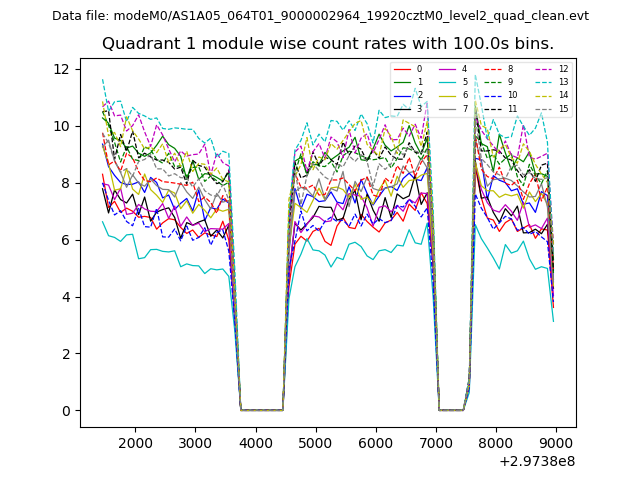
| Module-wise count rates for Quadrant A Data is divided into 100 sec bins |
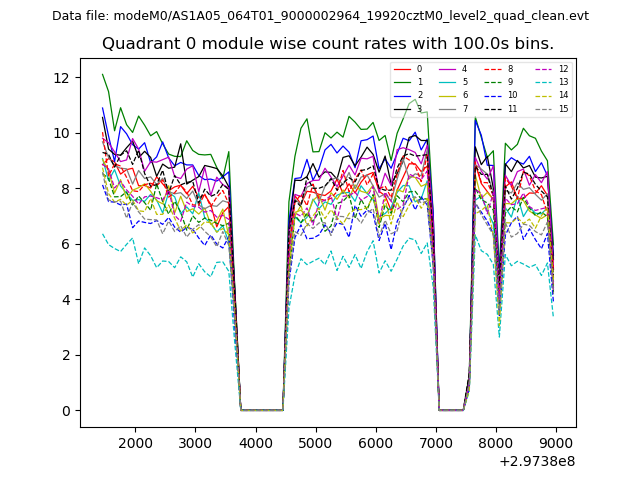 |
 |
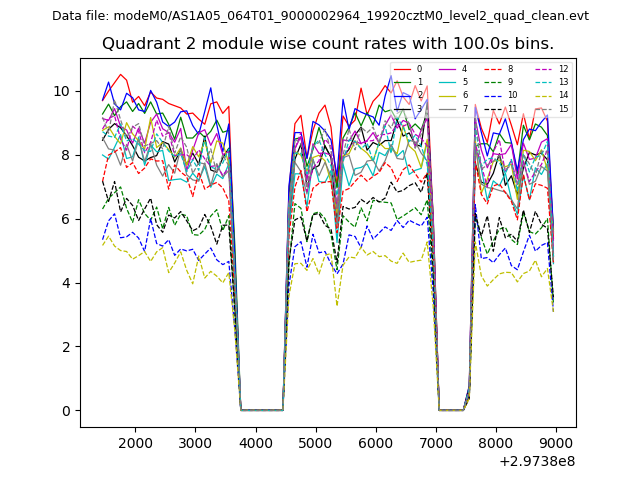
| Module-wise count rates for Quadrant B Data is divided into 100 sec bins |
 |
 |
| Module-wise count rates for Quadrant C Data is divided into 100 sec bins |
 |
 |
| Module-wise count rates for Quadrant D Data is divided into 100 sec bins |
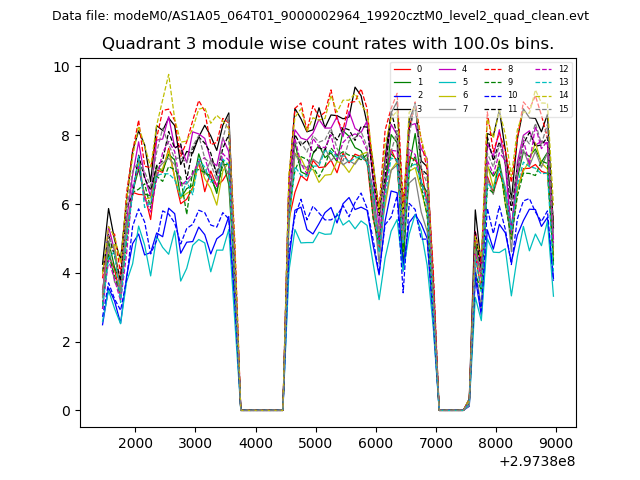 |
 |
| Parameter | Plot |
|---|---|
| CZT HV Monitor | 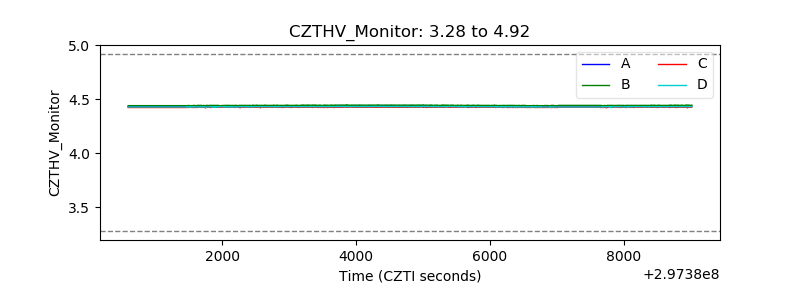 |
| D_VDD | 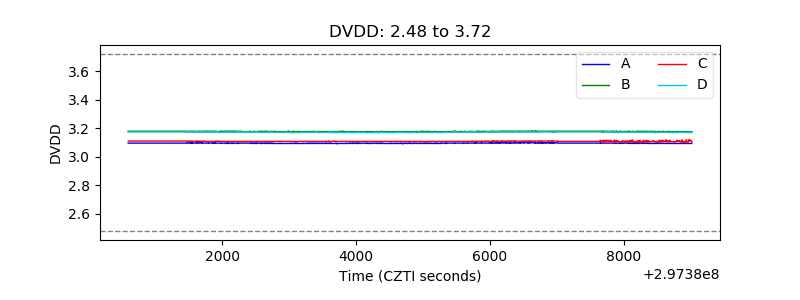 |
| Temperature 1 |  |
| Veto HV Monitor | 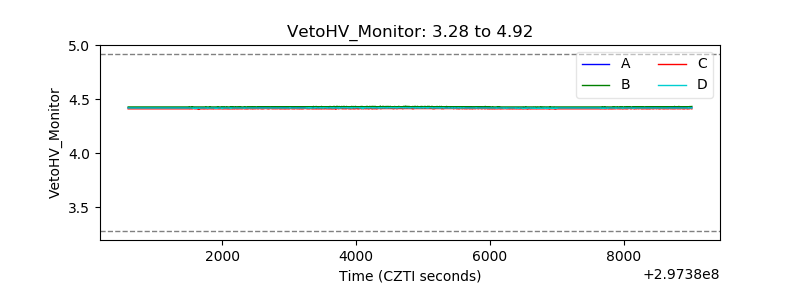 |
| Veto LLD | 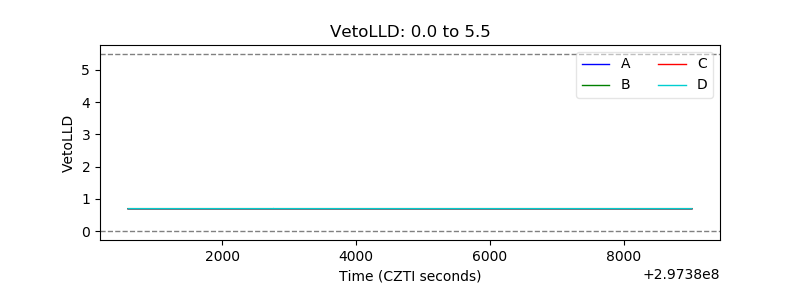 |
| Alpha Counter | 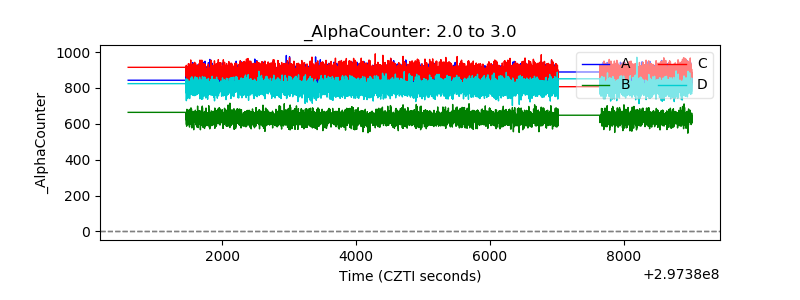 |
| _CPM_Rate | 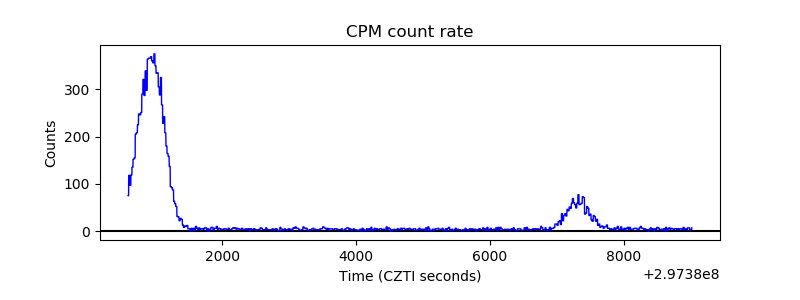 |
| CZT Counter | 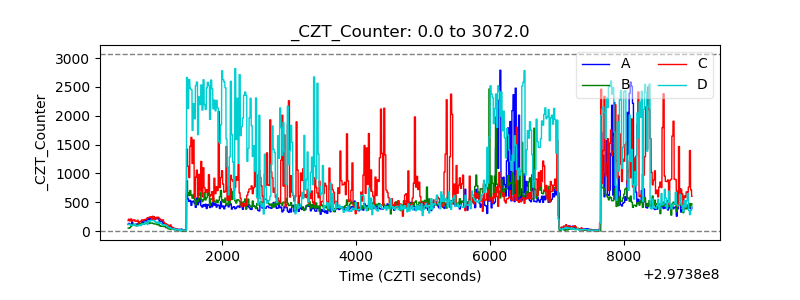 |
| +2.5 Volts monitor |  |
| +5 Volts monitor |  |
| _ROLL_ROT | 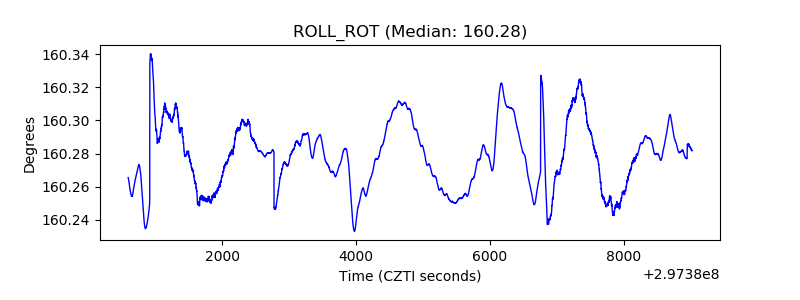 |
| _Roll_DEC |  |
| _Roll_RA | 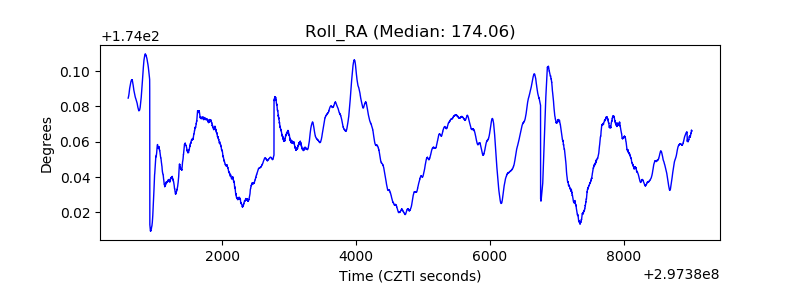 |
| Veto Counter | 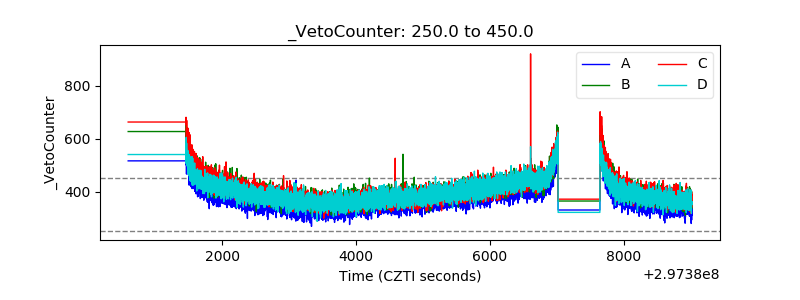 |