| Param | Original file | Final file |
|---|---|---|
| Filename | modeM0/AS1A05_064T01_9000002964_19921cztM0_level2.evt | modeM0/AS1A05_064T01_9000002964_19921cztM0_level2_quad_clean.evt |
| Size (bytes) | 744,065,280 | 123,111,360 |
| Size | 709.6 MB | 117.4 MB |
| Events in quadrant A | 4,110,927 | 828,295 |
| Events in quadrant B | 3,954,229 | 851,212 |
| Events in quadrant C | 7,196,751 | 782,266 |
| Events in quadrant D | 6,757,483 | 736,655 |
| Mode M0 | |||
|---|---|---|---|
| Quadrant | BADHDUFLAG | Total packets | Discarded packets |
| A | 0 | 17660 | 2 |
| B | 0 | 17012 | 2 |
| C | 0 | 26648 | 2 |
| D | 0 | 25566 | 2 |
| Mode SS | |||
|---|---|---|---|
| Quadrant | BADHDUFLAG | Total packets | Discarded packets |
| A | 0 | 158 | 0 |
| B | 0 | 158 | 0 |
| C | 0 | 158 | 0 |
| D | 0 | 158 | 0 |
| Mode M9 | |||
|---|---|---|---|
| Quadrant | BADHDUFLAG | Total packets | Discarded packets |
| A | 0 | 9 | 0 |
| B | 0 | 9 | 0 |
| C | 0 | 9 | 0 |
| D | 0 | 9 | 0 |
| Quadrant | Total seconds | Saturated seconds | Saturation percentage |
|---|---|---|---|
| A | 7601 | 207 | 2.723326% |
| B | 7601 | 113 | 1.486646% |
| C | 7601 | 1258 | 16.550454% |
| D | 7602 | 1270 | 16.706130% |
Noise dominated data is calculated using 1-second bins in cleaned event files. If a bin has >2000 counts, and if more than 50% of those come from <1% of pixels, then it is considered to be noise-dominated and hence unusable.
| Quadrant | # 1 sec bins | Bins with >0 counts | Bins with >2000 counts | High rate bins dominated by noise | Noise dominated (total time) | Noise dominated (detector-on time) | Marked lightcurve |
|---|---|---|---|---|---|---|---|
| A | 8526 | 7603 | 126 | 126 | 1.48% | 1.66% | 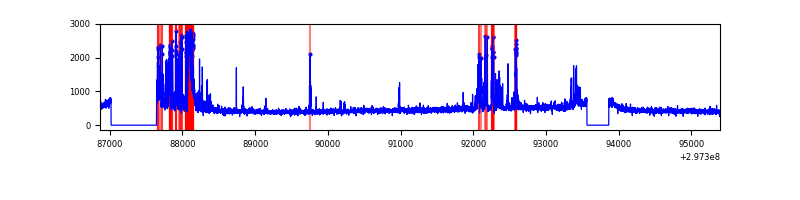 |
| B | 8526 | 7602 | 2 | 2 | 0.02% | 0.03% | 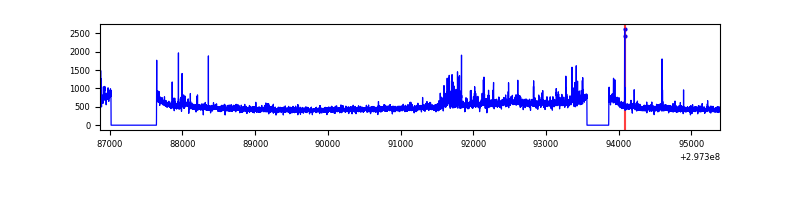 |
| C | 8526 | 7601 | 659 | 659 | 7.73% | 8.67% | 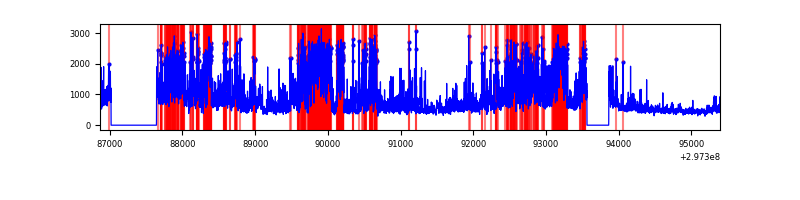 |
| D | 8527 | 7603 | 1061 | 1061 | 12.44% | 13.96% |  |
Top three noisy pixels from each quadrant. If the there are fewer than three noisy pixels in the level2.evt file, extra rows are filled as -1
| Pixel properties | Quadrant properties | ||||||
|---|---|---|---|---|---|---|---|
| Quadrant | DetID | PixID | Counts | Sigma | Mean | Median | Sigma |
| A | 14 | 238 | 707364 | 3985.84 | 877 | 856 | 177.3 |
| A | 5 | 16 | 24246 | 131.96 | 877 | 856 | 177.3 |
| A | 0 | 226 | 7737 | 38.82 | 877 | 856 | 177.3 |
| B | 3 | 112 | 246097 | 1457.44 | 890 | 864 | 168.3 |
| B | 0 | 197 | 50924 | 297.51 | 890 | 864 | 168.3 |
| B | 7 | 220 | 50887 | 297.29 | 890 | 864 | 168.3 |
| C | 9 | 221 | 2445667 | 12820.04 | 819 | 824 | 190.7 |
| C | 4 | 254 | 1072242 | 5618.2 | 819 | 824 | 190.7 |
| C | 3 | 233 | 336126 | 1758.23 | 819 | 824 | 190.7 |
| D | 7 | 38 | 1891732 | 9670.33 | 807 | 783 | 195.5 |
| D | 2 | 184 | 779742 | 3983.6 | 807 | 783 | 195.5 |
| D | 7 | 238 | 521819 | 2664.58 | 807 | 783 | 195.5 |
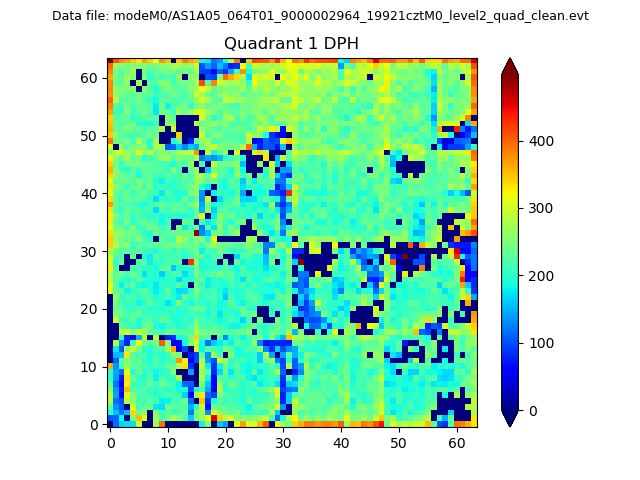
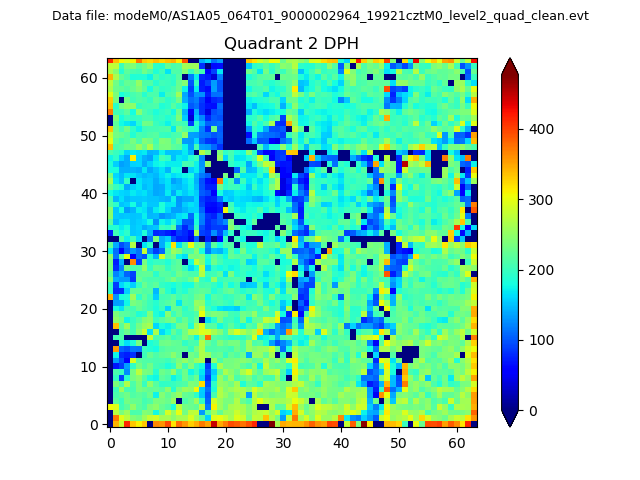
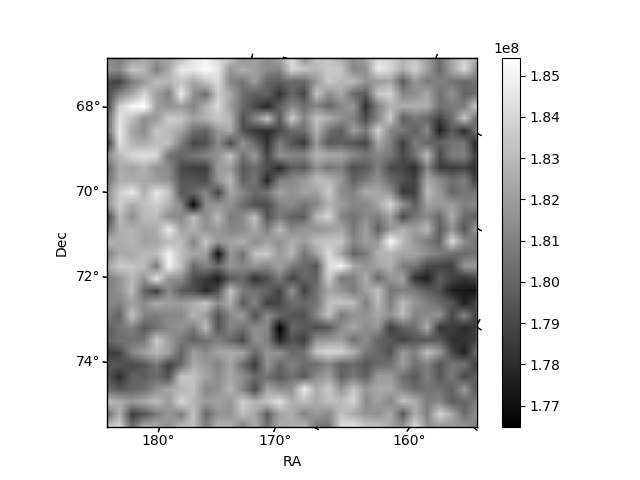
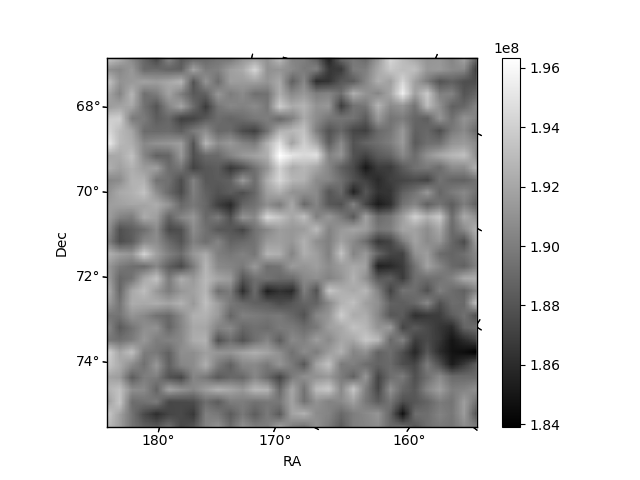
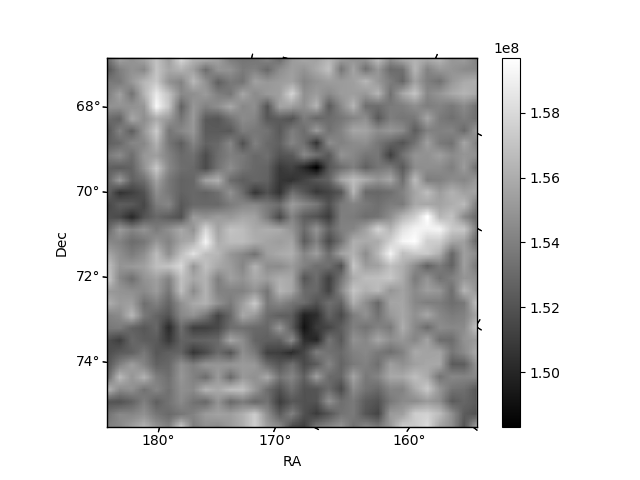
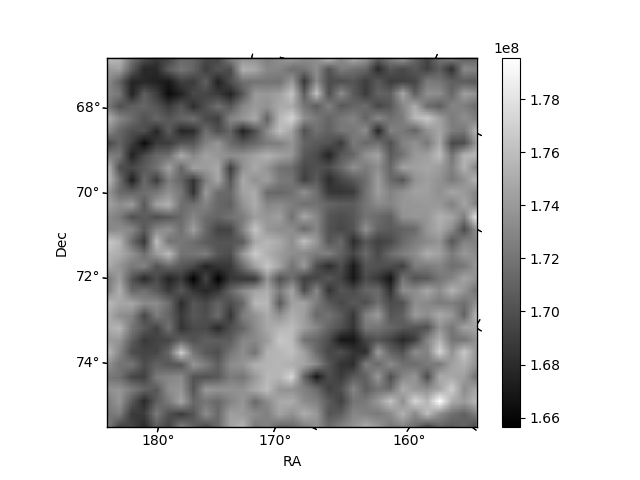
Histogram calculated using DETX and DETY for each event in the final _common_clean file
| Quadrant A |  |
 |
Quadrant B |
|---|---|---|---|
| Quadrant D | 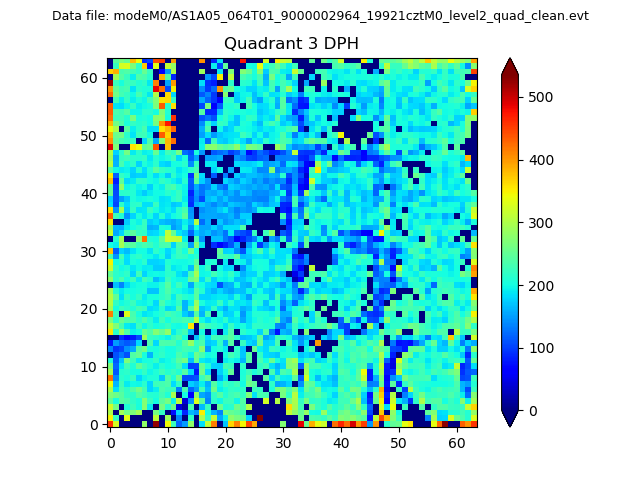 |
 |
Quadrant C |
| Plot type | Count rate plots | Images |
|---|---|---|
| Comparison with Poisson distribution Blue bars denote a histogram of data divided into 1 sec bins. Red curve is a Poisson curve with rate = median count rate of data. |
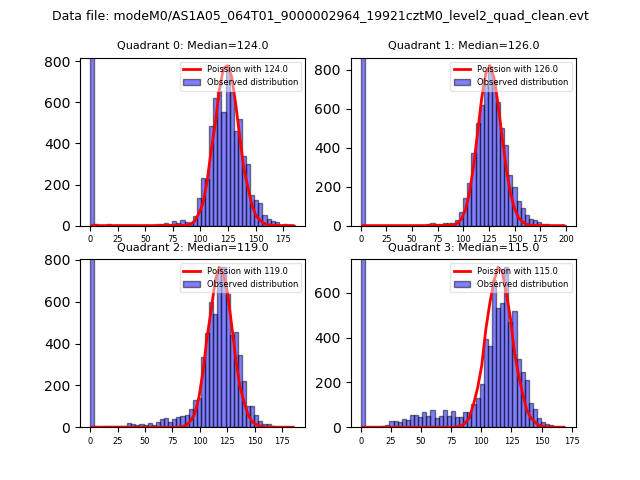 |
 |
| Quadrant-wise count rates Data is divided into 100 sec bins |
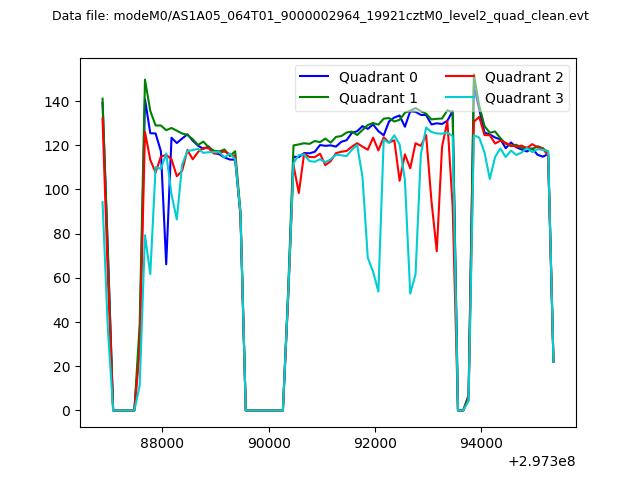 |
|
| Module-wise count rates for Quadrant A Data is divided into 100 sec bins |
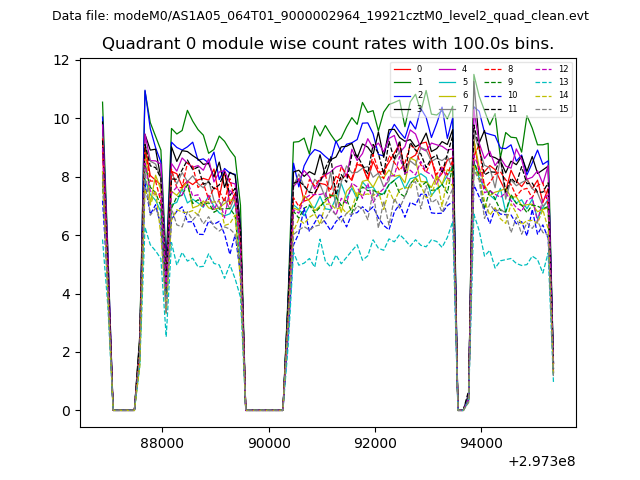 |
 |
| Module-wise count rates for Quadrant B Data is divided into 100 sec bins |
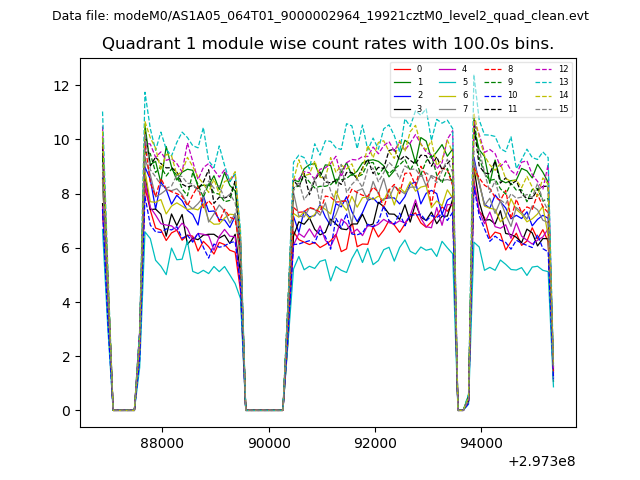 |
 |
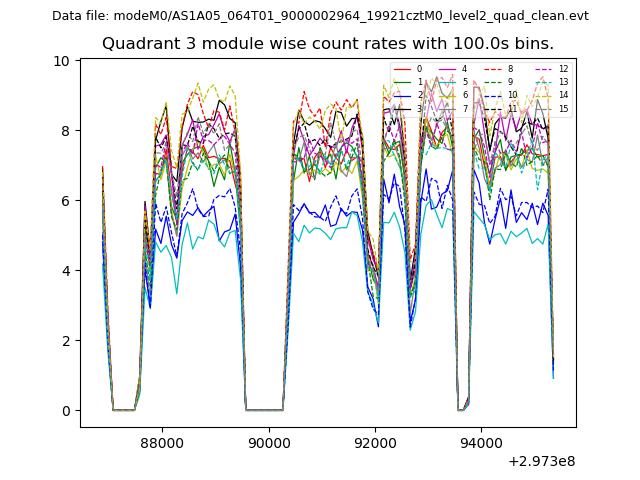
| Module-wise count rates for Quadrant C Data is divided into 100 sec bins |
 |
 |
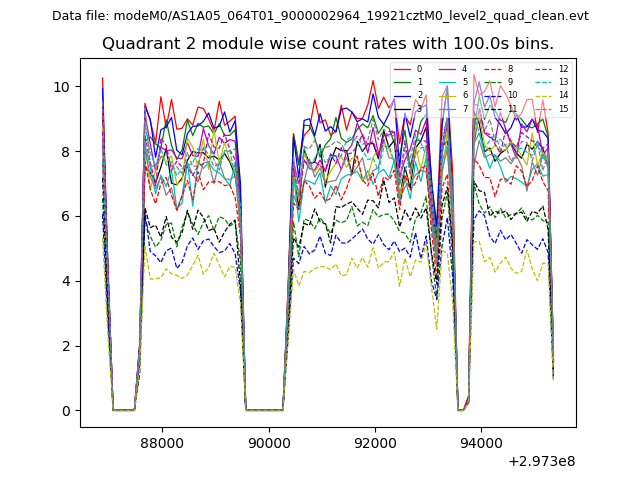
| Module-wise count rates for Quadrant D Data is divided into 100 sec bins |
 |
 |
| Parameter | Plot |
|---|---|
| CZT HV Monitor | 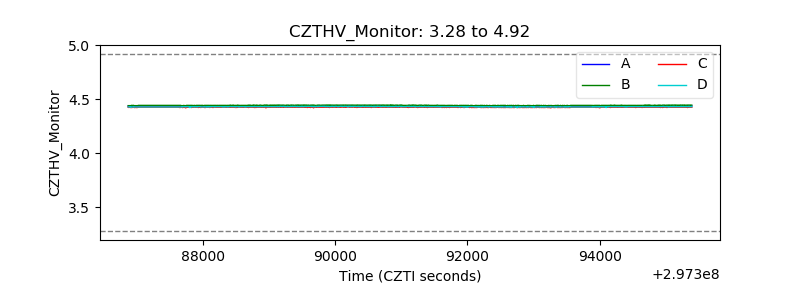 |
| D_VDD | 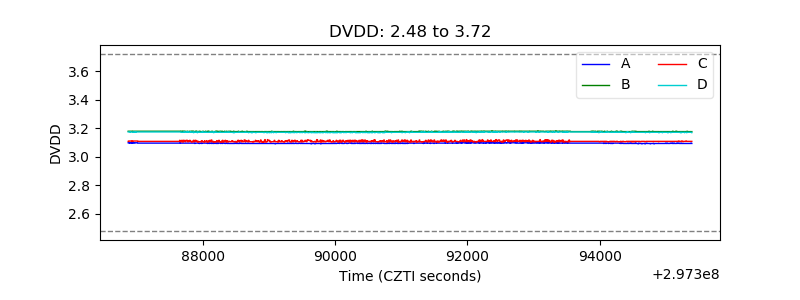 |
| Temperature 1 | 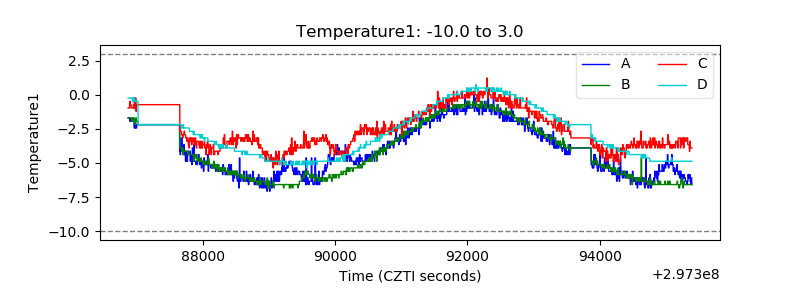 |
| Veto HV Monitor | 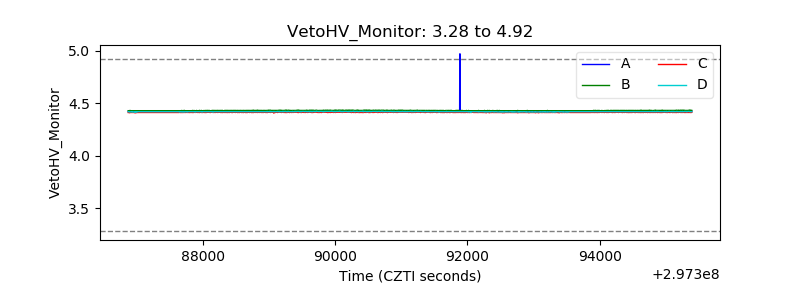 |
| Veto LLD |  |
| Alpha Counter | 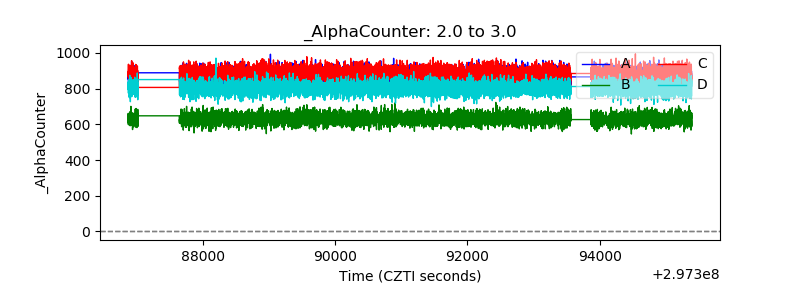 |
| _CPM_Rate | 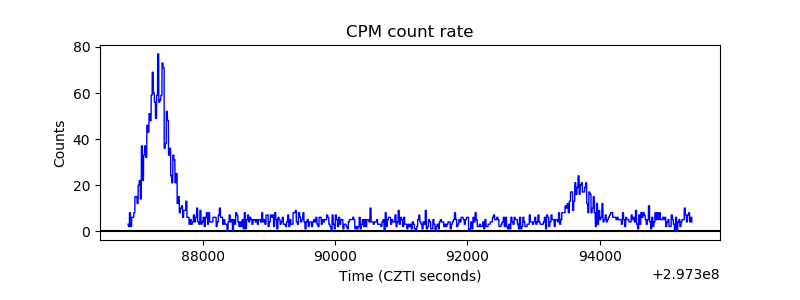 |
| CZT Counter | 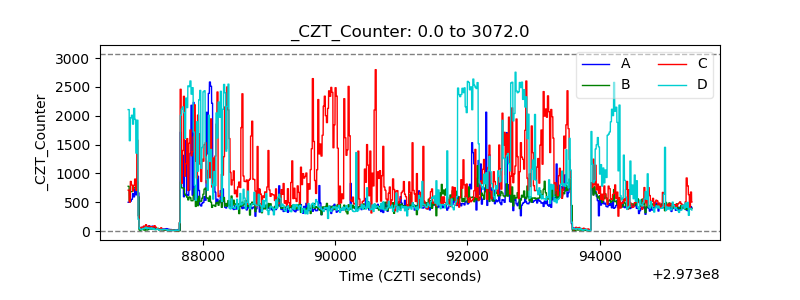 |
| +2.5 Volts monitor |  |
| +5 Volts monitor |  |
| _ROLL_ROT | 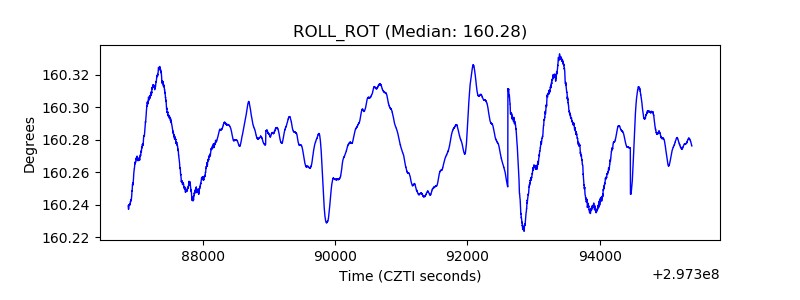 |
| _Roll_DEC | 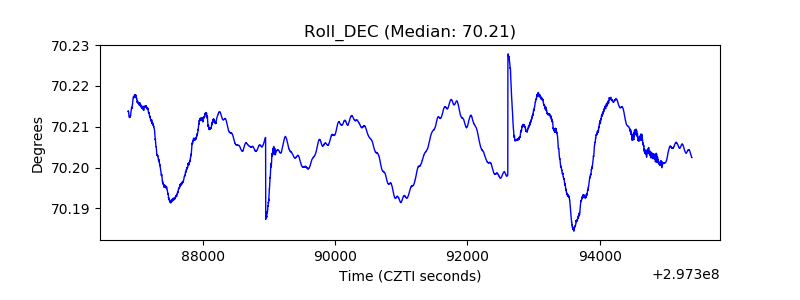 |
| _Roll_RA | 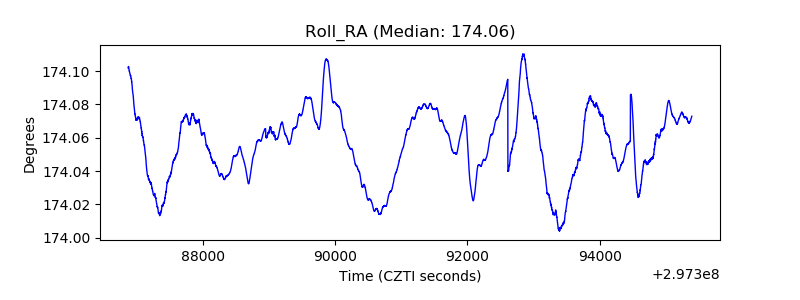 |
| Veto Counter | 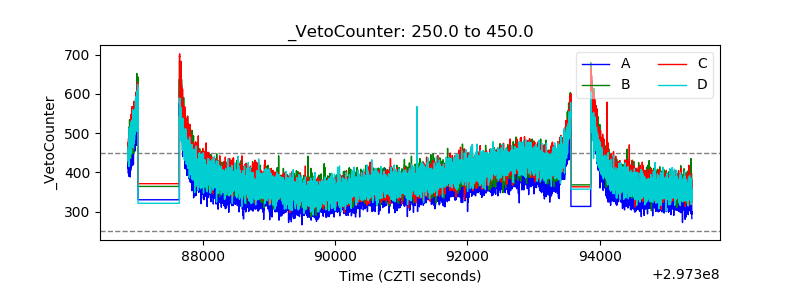 |