| Param | Original file | Final file |
|---|---|---|
| Filename | modeM0/AS1A05_064T01_9000002964_19922cztM0_level2.evt | modeM0/AS1A05_064T01_9000002964_19922cztM0_level2_quad_clean.evt |
| Size (bytes) | 764,395,200 | 121,826,880 |
| Size | 729.0 MB | 116.2 MB |
| Events in quadrant A | 3,827,387 | 815,237 |
| Events in quadrant B | 4,332,364 | 824,539 |
| Events in quadrant C | 7,347,942 | 755,825 |
| Events in quadrant D | 7,099,028 | 734,925 |
| Mode M0 | |||
|---|---|---|---|
| Quadrant | BADHDUFLAG | Total packets | Discarded packets |
| A | 0 | 17112 | 2 |
| B | 0 | 18437 | 2 |
| C | 0 | 27349 | 2 |
| D | 0 | 27110 | 2 |
| Mode SS | |||
|---|---|---|---|
| Quadrant | BADHDUFLAG | Total packets | Discarded packets |
| A | 0 | 166 | 0 |
| B | 0 | 166 | 0 |
| C | 0 | 166 | 0 |
| D | 0 | 166 | 0 |
| Mode M9 | |||
|---|---|---|---|
| Quadrant | BADHDUFLAG | Total packets | Discarded packets |
| A | 0 | 5 | 0 |
| B | 0 | 5 | 0 |
| C | 0 | 5 | 0 |
| D | 0 | 5 | 0 |
| Quadrant | Total seconds | Saturated seconds | Saturation percentage |
|---|---|---|---|
| A | 8023 | 113 | 1.408451% |
| B | 8022 | 195 | 2.430815% |
| C | 8022 | 1269 | 15.818998% |
| D | 8022 | 967 | 12.054351% |
Noise dominated data is calculated using 1-second bins in cleaned event files. If a bin has >2000 counts, and if more than 50% of those come from <1% of pixels, then it is considered to be noise-dominated and hence unusable.
| Quadrant | # 1 sec bins | Bins with >0 counts | Bins with >2000 counts | High rate bins dominated by noise | Noise dominated (total time) | Noise dominated (detector-on time) | Marked lightcurve |
|---|---|---|---|---|---|---|---|
| A | 8608 | 8024 | 17 | 17 | 0.20% | 0.21% | 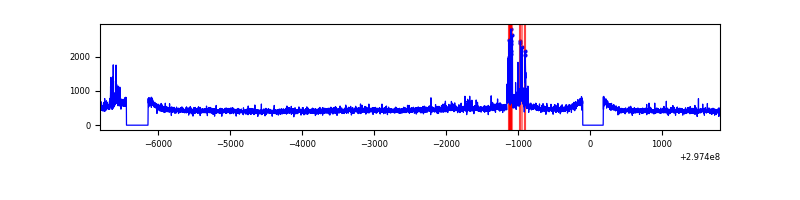 |
| B | 8607 | 8023 | 16 | 16 | 0.19% | 0.20% |  |
| C | 8607 | 8022 | 307 | 307 | 3.57% | 3.83% |  |
| D | 8607 | 8023 | 859 | 859 | 9.98% | 10.71% | 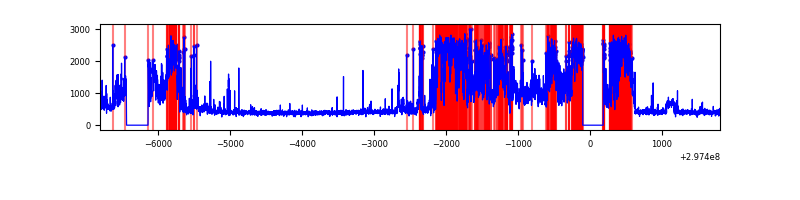 |
Top three noisy pixels from each quadrant. If the there are fewer than three noisy pixels in the level2.evt file, extra rows are filled as -1
| Pixel properties | Quadrant properties | ||||||
|---|---|---|---|---|---|---|---|
| Quadrant | DetID | PixID | Counts | Sigma | Mean | Median | Sigma |
| A | 14 | 238 | 218773 | 1154.47 | 935 | 915 | 188.7 |
| A | 0 | 226 | 8287 | 39.07 | 935 | 915 | 188.7 |
| A | 3 | 1 | 8220 | 38.71 | 935 | 915 | 188.7 |
| B | 3 | 112 | 267206 | 1495.09 | 942 | 916 | 178.1 |
| B | 7 | 220 | 121895 | 679.24 | 942 | 916 | 178.1 |
| B | 0 | 197 | 93871 | 521.9 | 942 | 916 | 178.1 |
| C | 9 | 221 | 3101846 | 15288.22 | 868 | 874 | 202.8 |
| C | 4 | 254 | 539603 | 2656.01 | 868 | 874 | 202.8 |
| C | 3 | 233 | 173351 | 850.34 | 868 | 874 | 202.8 |
| D | 7 | 38 | 1712951 | 8033.99 | 876 | 850 | 213.1 |
| D | 7 | 238 | 1580896 | 7414.33 | 876 | 850 | 213.1 |
| D | 1 | 52 | 208707 | 975.36 | 876 | 850 | 213.1 |
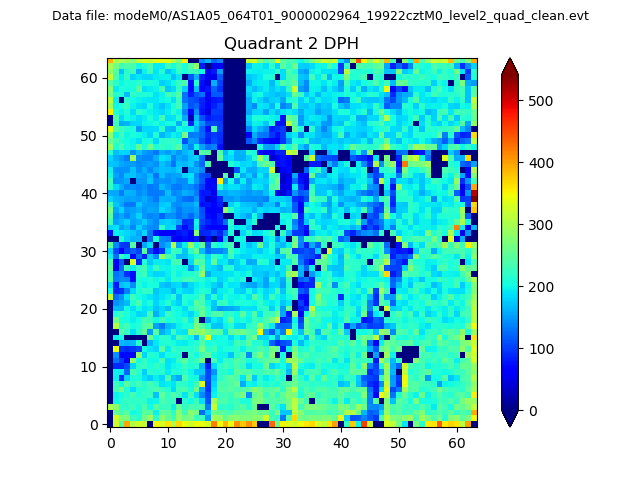
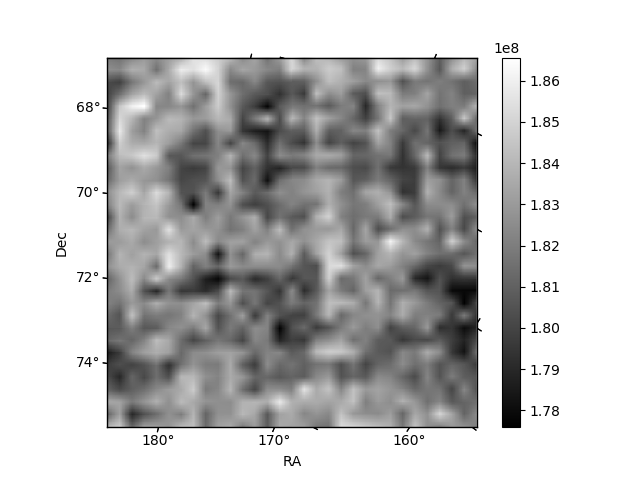
Histogram calculated using DETX and DETY for each event in the final _common_clean file
| Quadrant A | 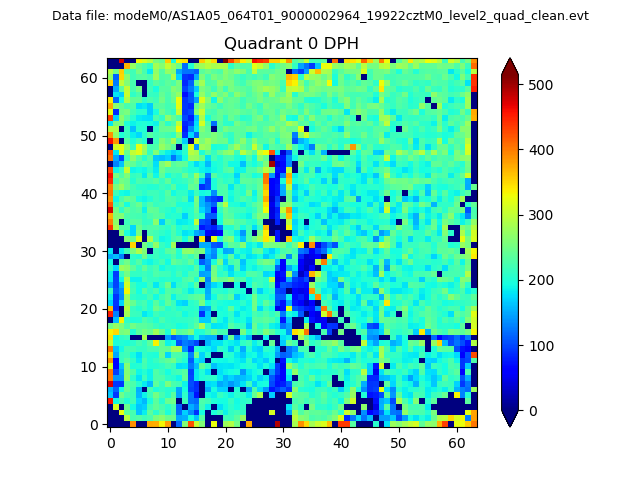 |
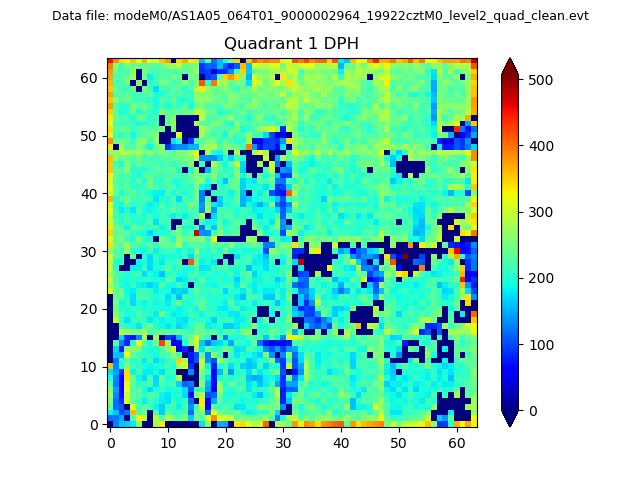 |
Quadrant B |
|---|---|---|---|
| Quadrant D | 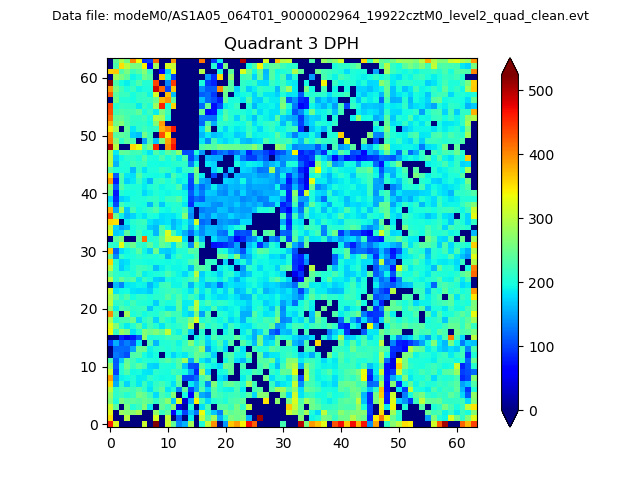 |
 |
Quadrant C |
| Plot type | Count rate plots | Images |
|---|---|---|
| Comparison with Poisson distribution Blue bars denote a histogram of data divided into 1 sec bins. Red curve is a Poisson curve with rate = median count rate of data. |
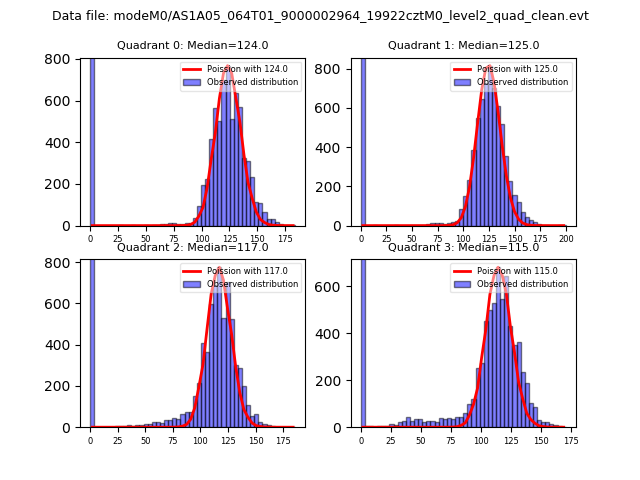 |
 |
| Quadrant-wise count rates Data is divided into 100 sec bins |
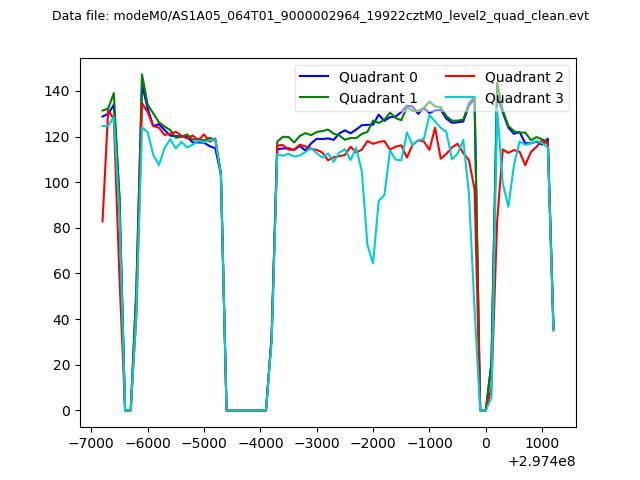 |
|
| Module-wise count rates for Quadrant A Data is divided into 100 sec bins |
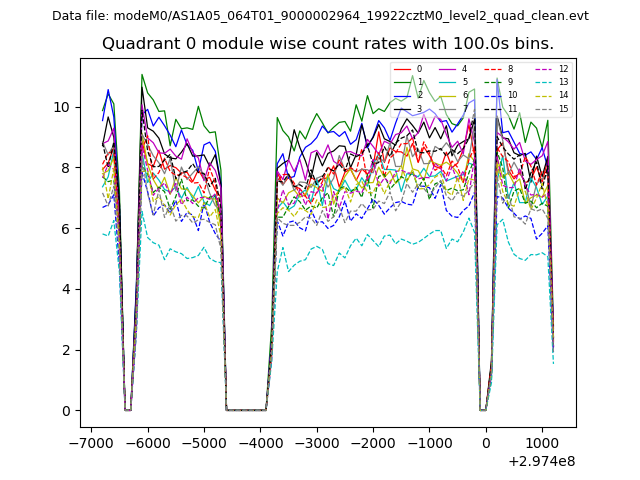 |
 |
| Module-wise count rates for Quadrant B Data is divided into 100 sec bins |
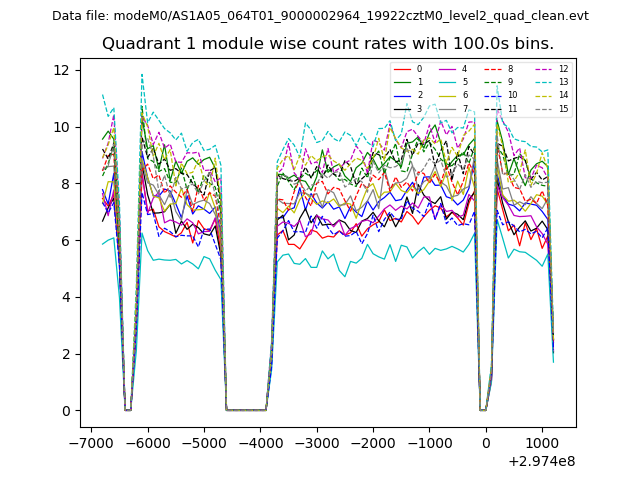 |
 |
| Module-wise count rates for Quadrant C Data is divided into 100 sec bins |
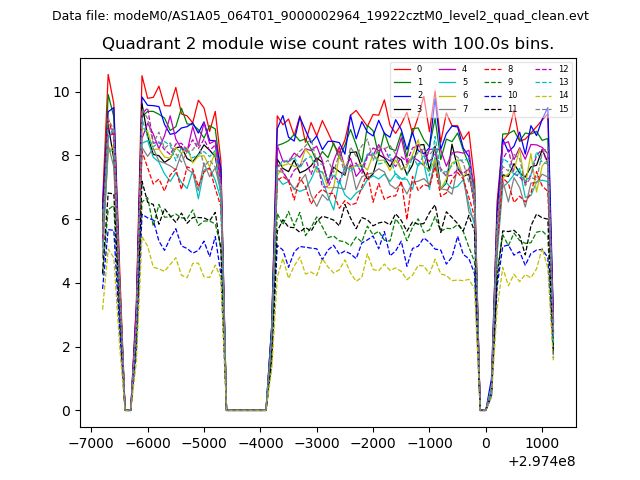 |
 |
| Module-wise count rates for Quadrant D Data is divided into 100 sec bins |
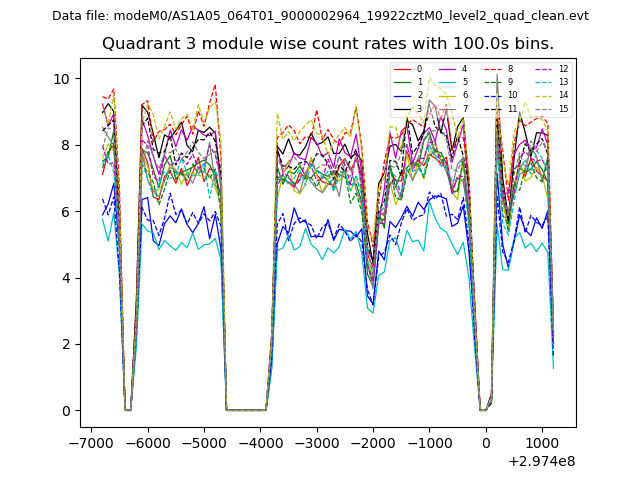 |
 |
| Parameter | Plot |
|---|---|
| CZT HV Monitor | 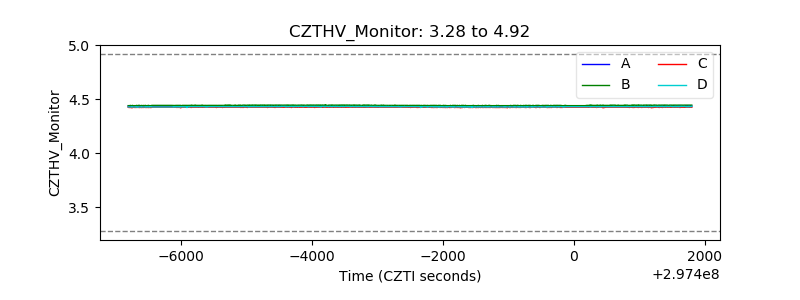 |
| D_VDD | 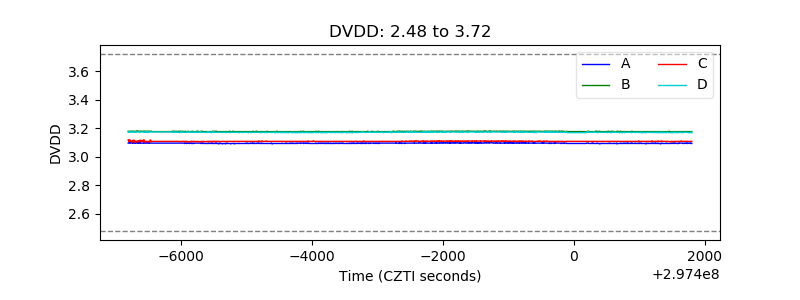 |
| Temperature 1 | 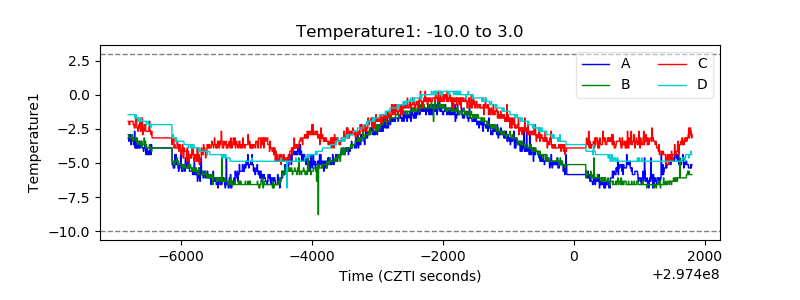 |
| Veto HV Monitor | 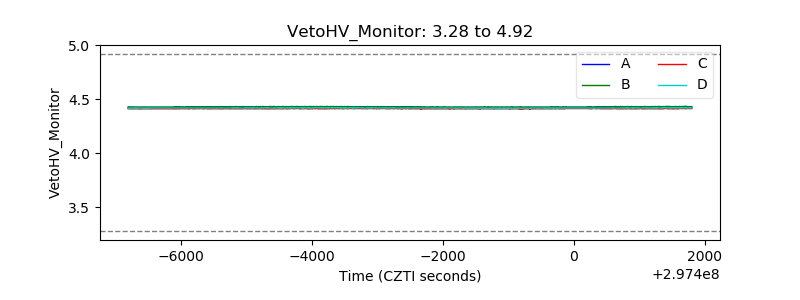 |
| Veto LLD | 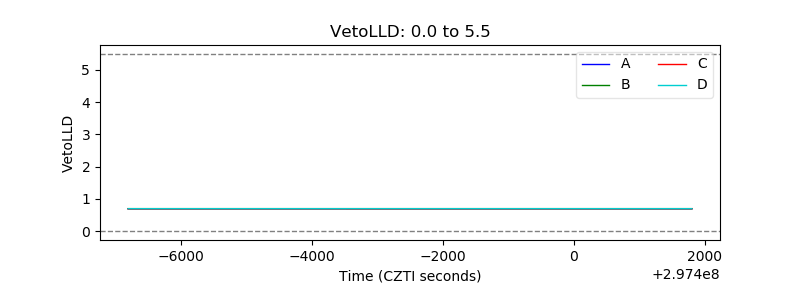 |
| Alpha Counter | 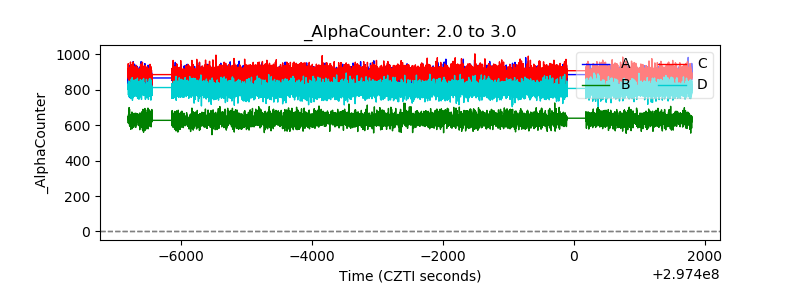 |
| _CPM_Rate | 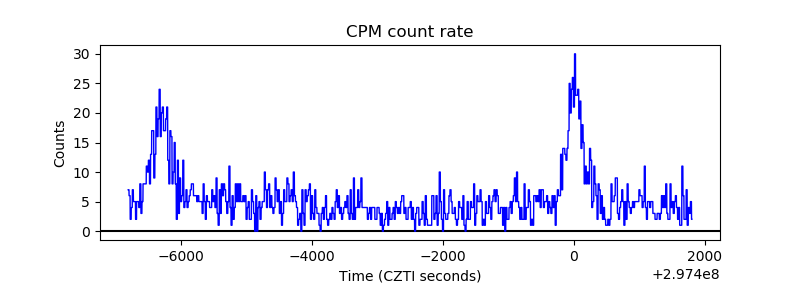 |
| CZT Counter | 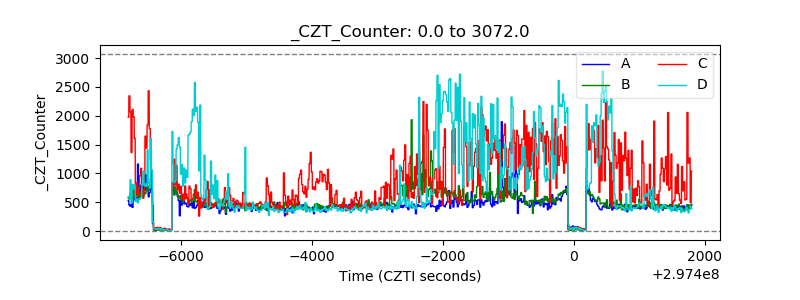 |
| +2.5 Volts monitor |  |
| +5 Volts monitor |  |
| _ROLL_ROT | 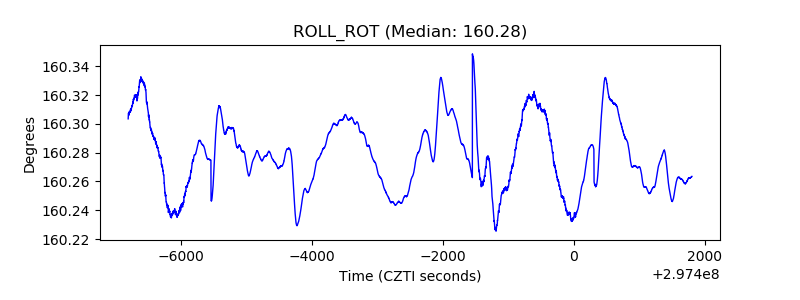 |
| _Roll_DEC | 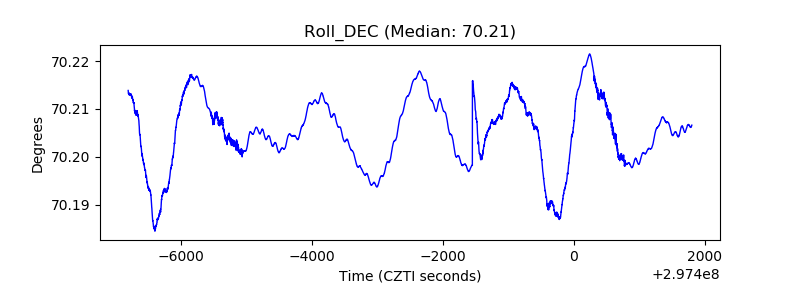 |
| _Roll_RA | 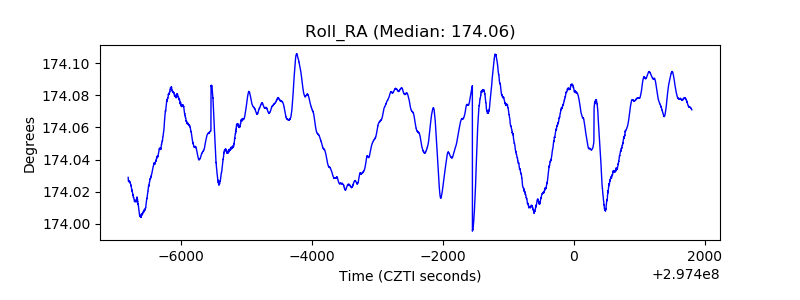 |
| Veto Counter | 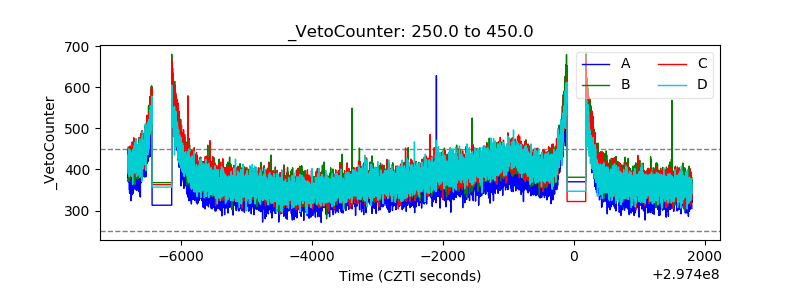 |