| Param | Original file | Final file |
|---|---|---|
| Filename | modeM0/AS1A05_064T01_9000002964_19926cztM0_level2.evt | modeM0/AS1A05_064T01_9000002964_19926cztM0_level2_quad_clean.evt |
| Size (bytes) | 372,438,720 | 62,835,840 |
| Size | 355.2 MB | 59.9 MB |
| Events in quadrant A | 1,764,851 | 424,081 |
| Events in quadrant B | 2,092,047 | 424,545 |
| Events in quadrant C | 4,265,272 | 382,704 |
| Events in quadrant D | 2,887,370 | 391,128 |
| Mode M0 | |||
|---|---|---|---|
| Quadrant | BADHDUFLAG | Total packets | Discarded packets |
| A | 0 | 7963 | 1 |
| B | 0 | 8498 | 1 |
| C | 0 | 15382 | 1 |
| D | 0 | 11234 | 1 |
| Mode SS | |||
|---|---|---|---|
| Quadrant | BADHDUFLAG | Total packets | Discarded packets |
| A | 0 | 80 | 0 |
| B | 0 | 80 | 0 |
| C | 0 | 80 | 0 |
| D | 0 | 80 | 0 |
| Quadrant | Total seconds | Saturated seconds | Saturation percentage |
|---|---|---|---|
| A | 3963 | 1 | 0.025233% |
| B | 3964 | 12 | 0.302725% |
| C | 3964 | 500 | 12.613522% |
| D | 3964 | 184 | 4.641776% |
Noise dominated data is calculated using 1-second bins in cleaned event files. If a bin has >2000 counts, and if more than 50% of those come from <1% of pixels, then it is considered to be noise-dominated and hence unusable.
| Quadrant | # 1 sec bins | Bins with >0 counts | Bins with >2000 counts | High rate bins dominated by noise | Noise dominated (total time) | Noise dominated (detector-on time) | Marked lightcurve |
|---|---|---|---|---|---|---|---|
| A | 3963 | 3963 | 0 | 0 | 0.00% | 0.00% | 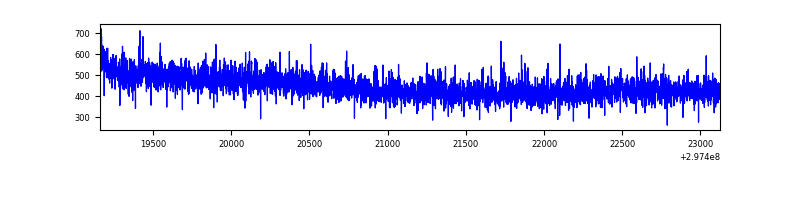 |
| B | 3964 | 3964 | 5 | 5 | 0.13% | 0.13% | 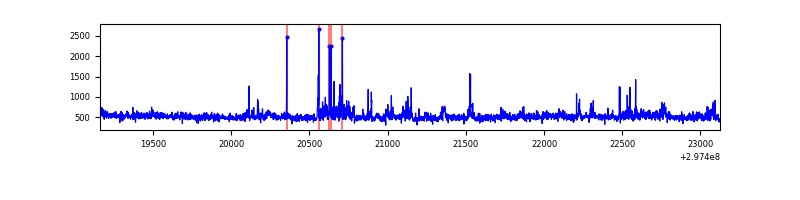 |
| C | 3964 | 3964 | 227 | 227 | 5.73% | 5.73% | 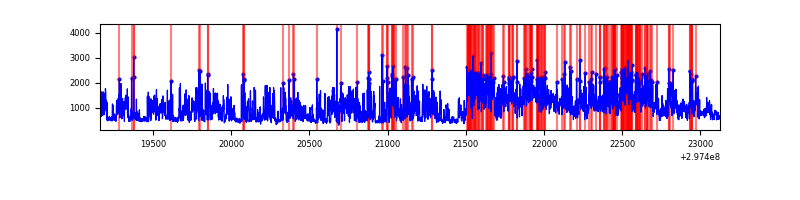 |
| D | 3964 | 3964 | 183 | 183 | 4.62% | 4.62% | 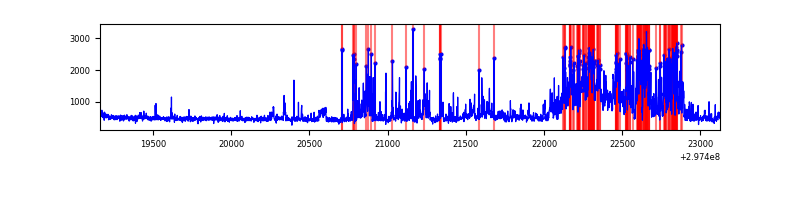 |
Top three noisy pixels from each quadrant. If the there are fewer than three noisy pixels in the level2.evt file, extra rows are filled as -1
| Pixel properties | Quadrant properties | ||||||
|---|---|---|---|---|---|---|---|
| Quadrant | DetID | PixID | Counts | Sigma | Mean | Median | Sigma |
| A | 0 | 226 | 4036 | 38.43 | 458 | 447 | 93.4 |
| A | 12 | 194 | 3407 | 31.7 | 458 | 447 | 93.4 |
| A | 3 | 137 | 3230 | 29.8 | 458 | 447 | 93.4 |
| B | 3 | 112 | 115836 | 1323.02 | 454 | 442 | 87.2 |
| B | 0 | 189 | 54629 | 621.27 | 454 | 442 | 87.2 |
| B | 7 | 220 | 49451 | 561.9 | 454 | 442 | 87.2 |
| C | 9 | 221 | 1467727 | 14844.1 | 421 | 423 | 98.8 |
| C | 3 | 233 | 540967 | 5468.46 | 421 | 423 | 98.8 |
| C | 7 | 220 | 273280 | 2760.38 | 421 | 423 | 98.8 |
| D | 12 | 32 | 582933 | 5400.62 | 440 | 426 | 107.9 |
| D | 7 | 38 | 456264 | 4226.23 | 440 | 426 | 107.9 |
| D | 1 | 52 | 48831 | 448.78 | 440 | 426 | 107.9 |
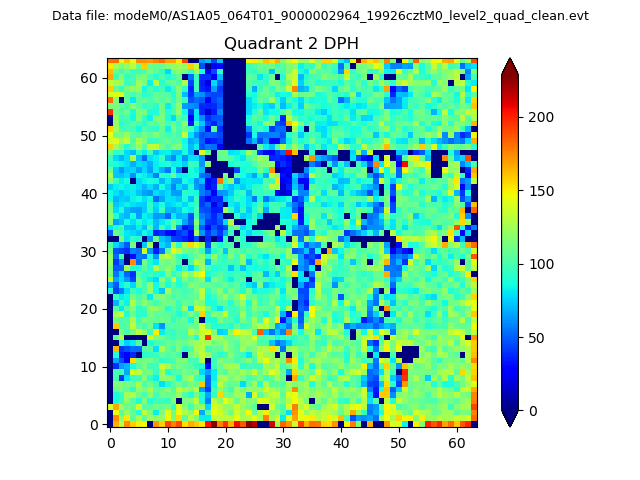
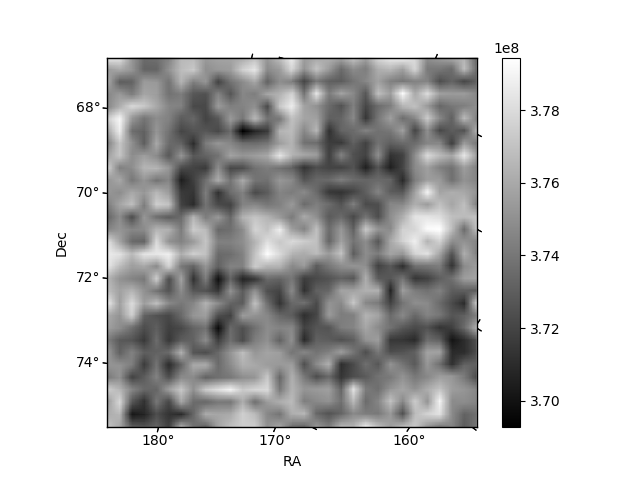
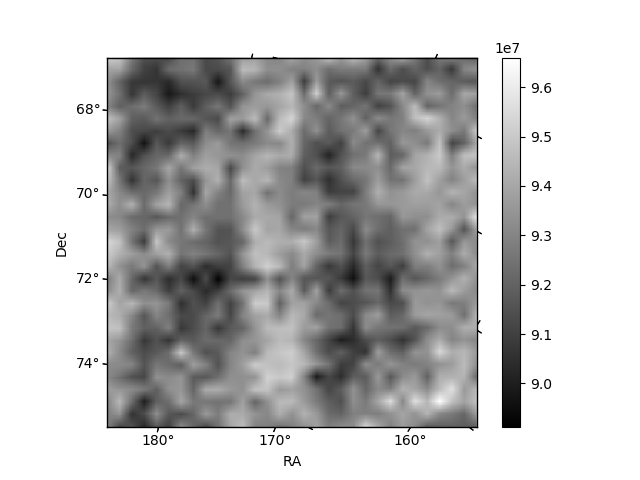
Histogram calculated using DETX and DETY for each event in the final _common_clean file
| Quadrant A | 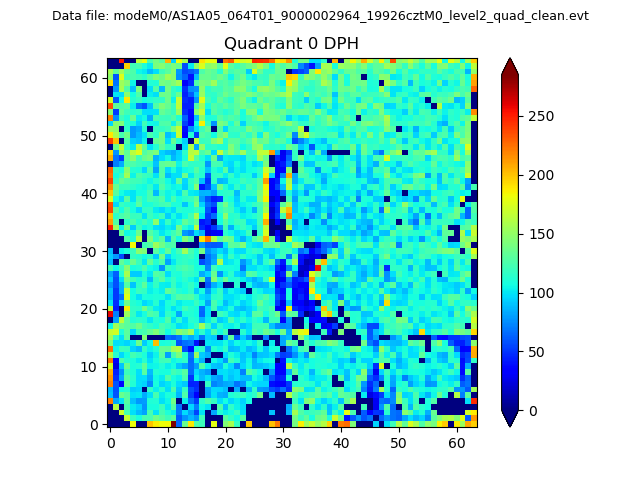 |
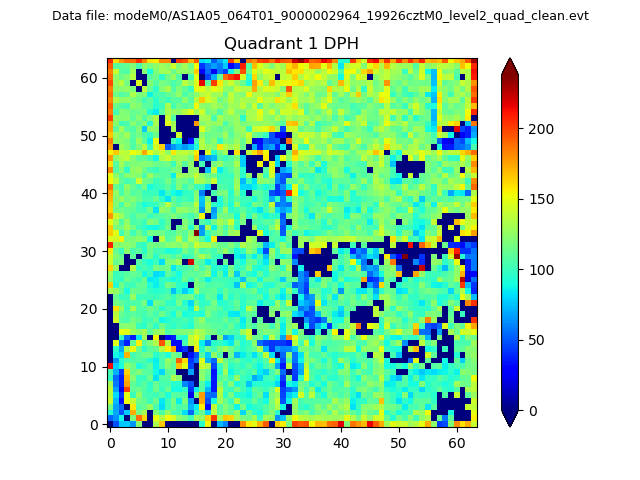 |
Quadrant B |
|---|---|---|---|
| Quadrant D | 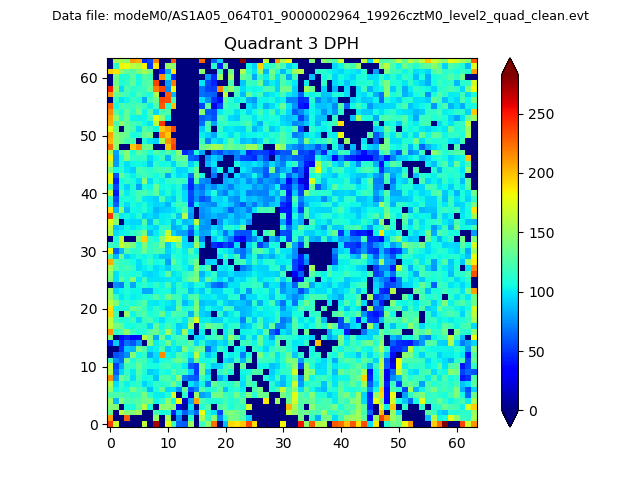 |
 |
Quadrant C |
| Plot type | Count rate plots | Images |
|---|---|---|
| Comparison with Poisson distribution Blue bars denote a histogram of data divided into 1 sec bins. Red curve is a Poisson curve with rate = median count rate of data. |
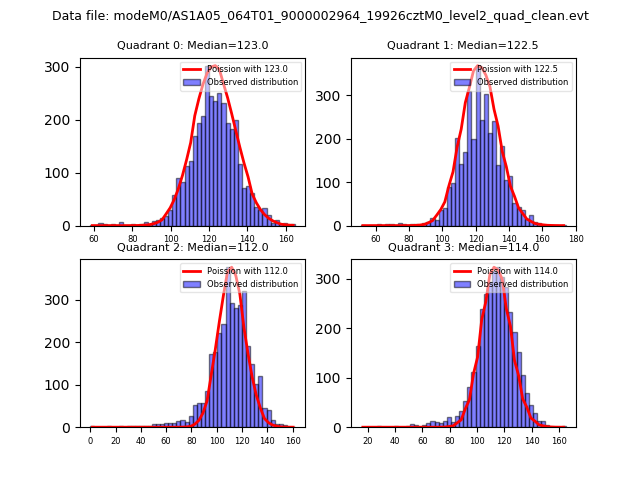 |
 |
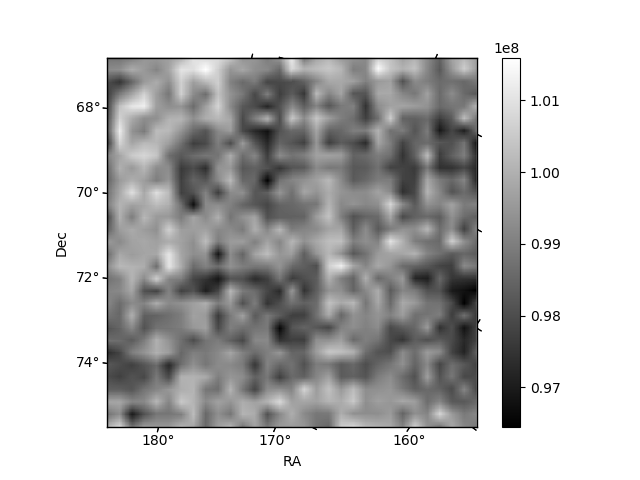
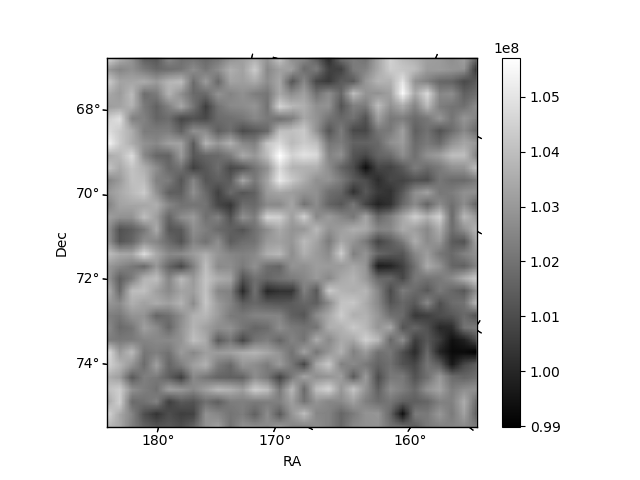
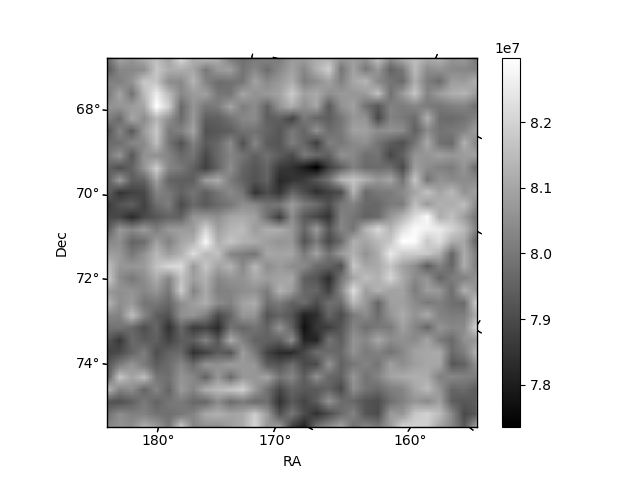
| Quadrant-wise count rates Data is divided into 100 sec bins |
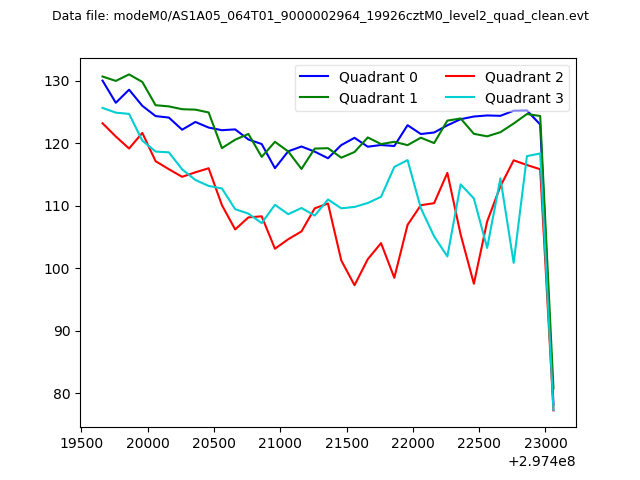 |
|
| Module-wise count rates for Quadrant A Data is divided into 100 sec bins |
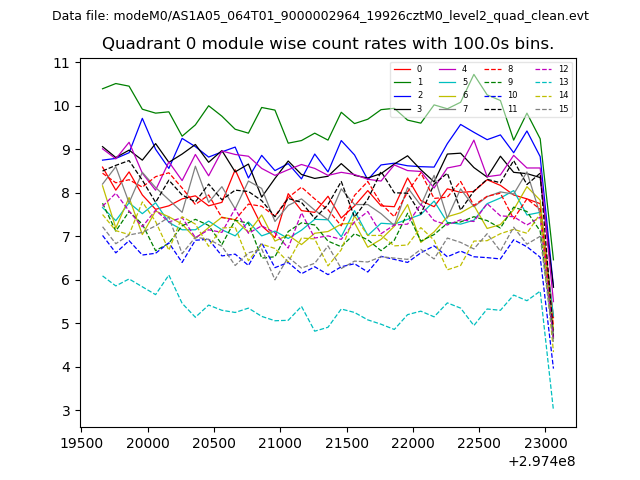 |
 |
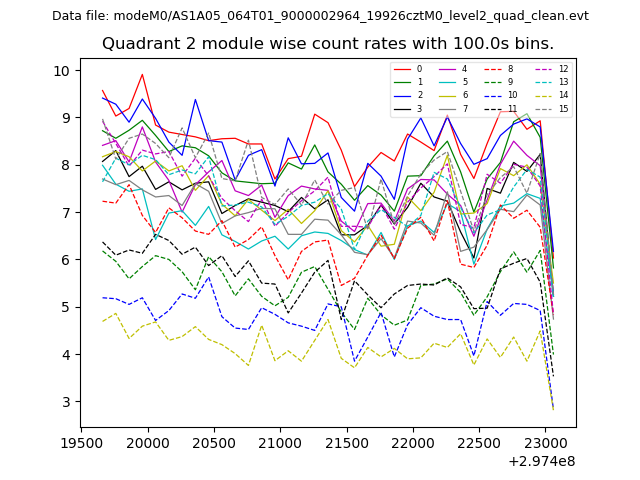
| Module-wise count rates for Quadrant B Data is divided into 100 sec bins |
 |
 |
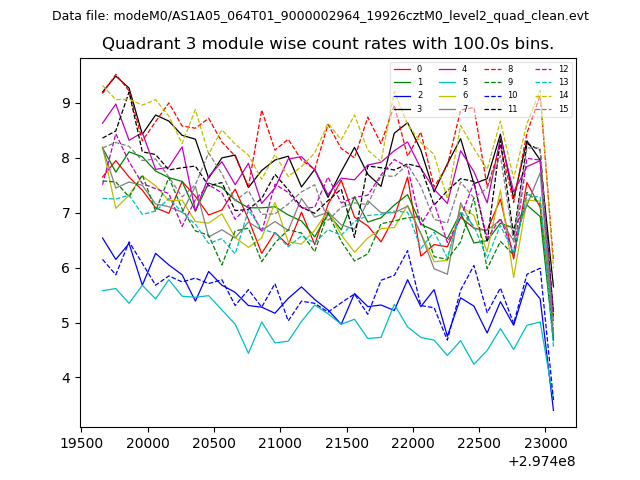
| Module-wise count rates for Quadrant C Data is divided into 100 sec bins |
 |
 |
| Module-wise count rates for Quadrant D Data is divided into 100 sec bins |
 |
 |
| Parameter | Plot |
|---|---|
| CZT HV Monitor |  |
| D_VDD | 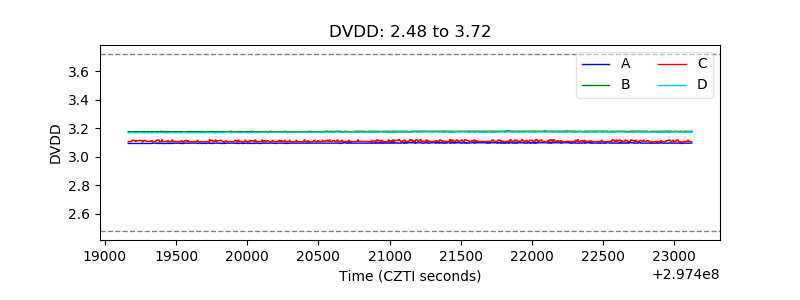 |
| Temperature 1 | 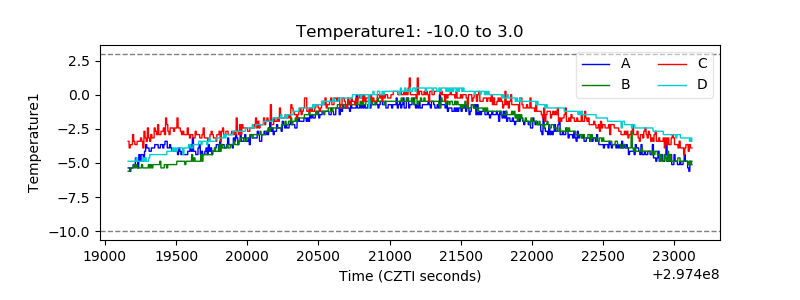 |
| Veto HV Monitor | 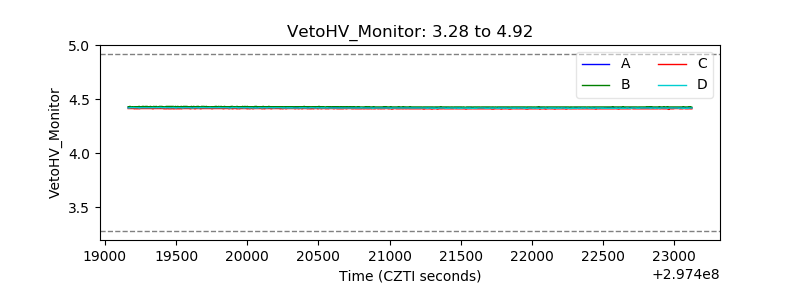 |
| Veto LLD | 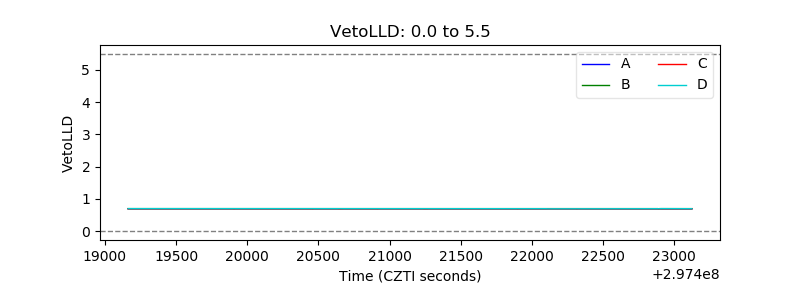 |
| Alpha Counter | 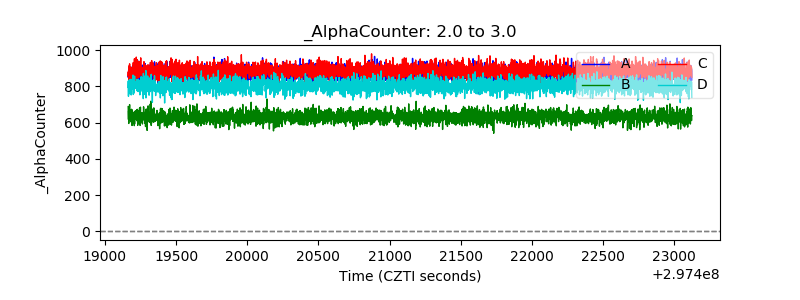 |
| _CPM_Rate | 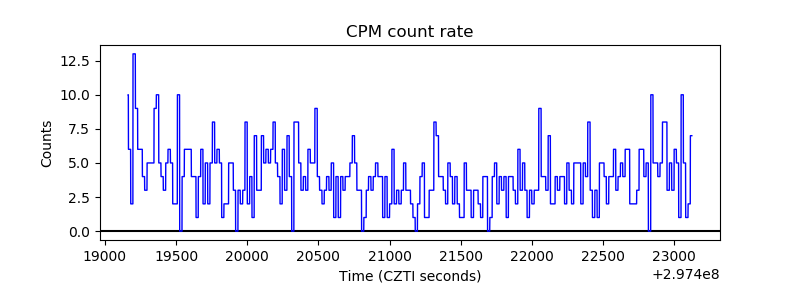 |
| CZT Counter | 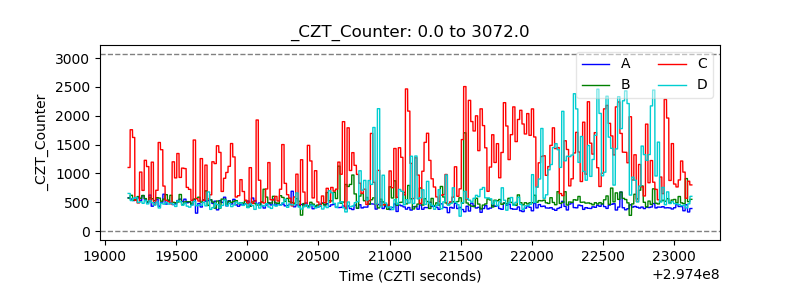 |
| +2.5 Volts monitor |  |
| +5 Volts monitor | 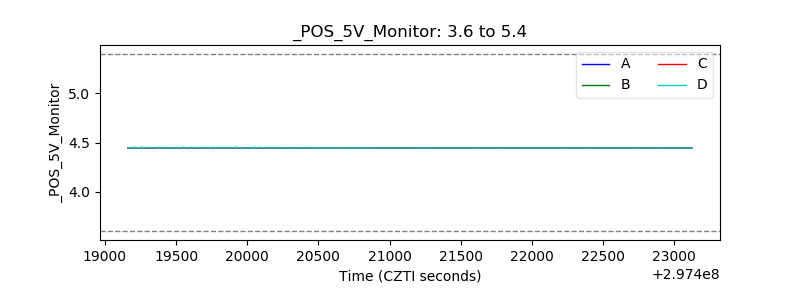 |
| _ROLL_ROT | 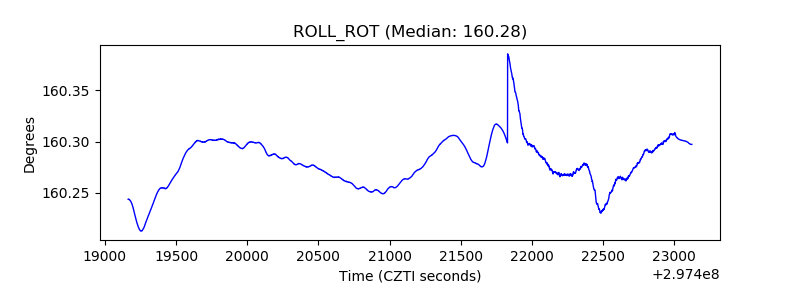 |
| _Roll_DEC | 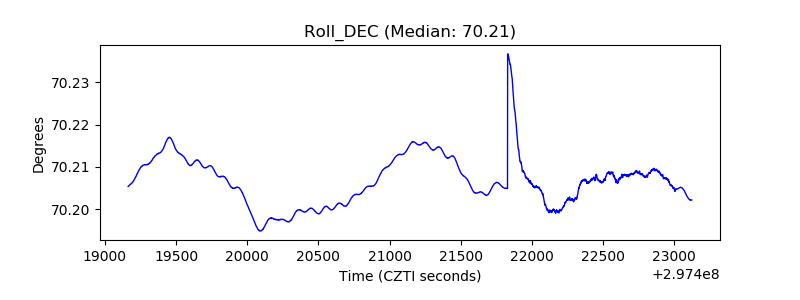 |
| _Roll_RA | 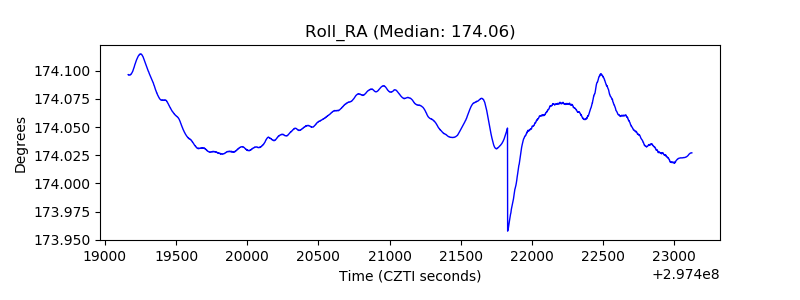 |
| Veto Counter | 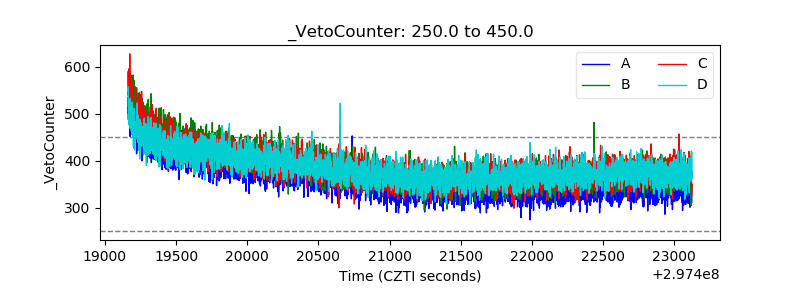 |