| Param | Original file | Final file |
|---|---|---|
| Filename | modeM0/AS1A05_160T01_9000002970cztM0_level2.fits | modeM0/AS1A05_160T01_9000002970cztM0_level2_quad_clean.evt |
| Size (bytes) | 1,402,891,200 | 1,243,825,920 |
| Size | 1.3 GB | 1.2 GB |
| Events in quadrant A | 8,417,280 | 7,089,248 |
| Events in quadrant B | 8,373,318 | 7,469,496 |
| Events in quadrant C | 8,490,172 | 6,911,438 |
| Events in quadrant D | 7,496,946 | 6,497,053 |
| Mode SS | |||
|---|---|---|---|
| Quadrant | BADHDUFLAG | Total packets | Discarded packets |
| A | 0 | 2890 | 0 |
| B | 0 | 2884 | 0 |
| C | 0 | 2880 | 0 |
| D | 0 | 2884 | 0 |
| Mode M0 | |||
|---|---|---|---|
| Quadrant | BADHDUFLAG | Total packets | Discarded packets |
| A | 0 | 382764 | 0 |
| B | 0 | 311051 | 0 |
| C | 0 | 359672 | 0 |
| D | 0 | 344163 | 0 |
| Mode M9 | |||
|---|---|---|---|
| Quadrant | BADHDUFLAG | Total packets | Discarded packets |
| A | 0 | 229 | 0 |
| B | 0 | 229 | 0 |
| C | 0 | 230 | 0 |
| D | 0 | 228 | 0 |
| Quadrant | Total seconds | Saturated seconds | Saturation percentage |
|---|---|---|---|
| A | 141525 | 12161 | 8.592828% |
| B | 141611 | 2431 | 1.716675% |
| C | 141620 | 6190 | 4.370852% |
| D | 141554 | 4935 | 3.486302% |
Noise dominated data is calculated using 1-second bins in cleaned event files. If a bin has >2000 counts, and if more than 50% of those come from <1% of pixels, then it is considered to be noise-dominated and hence unusable.
| Quadrant | # 1 sec bins | Bins with >0 counts | Bins with >2000 counts | High rate bins dominated by noise | Noise dominated (total time) | Noise dominated (detector-on time) | Marked lightcurve |
|---|---|---|---|---|---|---|---|
| A | 165807 | 140852 | 0 | 0 | 0.00% | 0.00% |  |
| B | 165807 | 141862 | 0 | 0 | 0.00% | 0.00% |  |
| C | 165807 | 141645 | 0 | 0 | 0.00% | 0.00% | 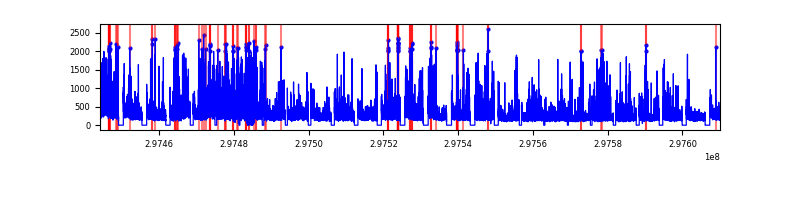 |
| D | 165807 | 141722 | 0 | 0 | 0.00% | 0.00% |  |
Top three noisy pixels from each quadrant. If the there are fewer than three noisy pixels in the level2.evt file, extra rows are filled as -1
| Pixel properties | Quadrant properties | ||||||
|---|---|---|---|---|---|---|---|
| Quadrant | DetID | PixID | Counts | Sigma | Mean | Median | Sigma |
| A | 0 | 29 | 7944 | 11.02 | 2190 | 2054 | 534.3 |
| A | 7 | 110 | 6754 | 8.8 | 2190 | 2054 | 534.3 |
| A | 9 | 19 | 6298 | 7.94 | 2190 | 2054 | 534.3 |
| B | 2 | 9 | 6740 | 10.73 | 2217 | 2114 | 430.9 |
| B | 2 | 8 | 5648 | 8.2 | 2217 | 2114 | 430.9 |
| B | 5 | 128 | 5475 | 7.8 | 2217 | 2114 | 430.9 |
| C | 1 | 80 | 6380 | 7.6 | 2238 | 2097 | 563.8 |
| C | 1 | 81 | 6256 | 7.38 | 2238 | 2097 | 563.8 |
| C | 12 | 241 | 6029 | 6.97 | 2238 | 2097 | 563.8 |
| D | 3 | 14 | 5393 | 6.13 | 2144 | 1961 | 560.2 |
| D | 7 | 3 | 5236 | 5.85 | 2144 | 1961 | 560.2 |
| D | 6 | 67 | 5212 | 5.8 | 2144 | 1961 | 560.2 |
Histogram calculated using DETX and DETY for each event in the final _common_clean file
| Quadrant A | 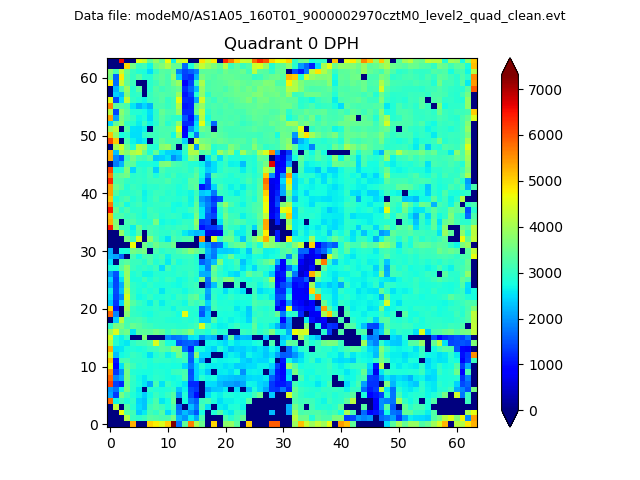 |
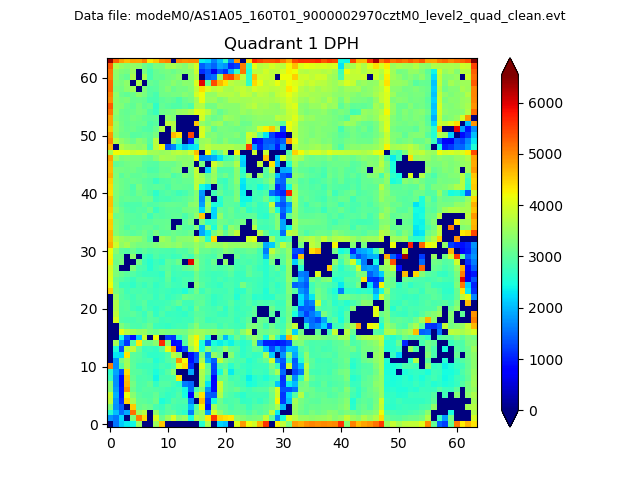 |
Quadrant B |
|---|---|---|---|
| Quadrant D | 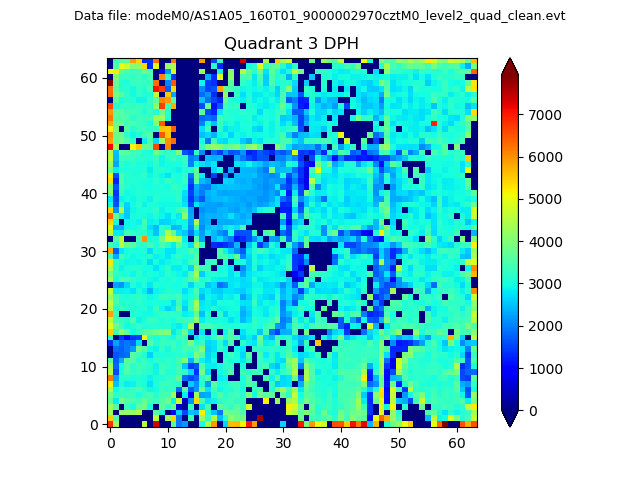 |
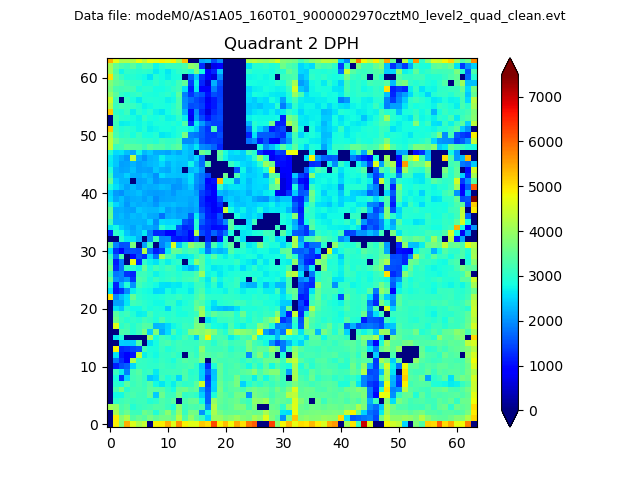 |
Quadrant C |
| Plot type | Count rate plots | Images |
|---|---|---|
| Comparison with Poisson distribution Blue bars denote a histogram of data divided into 1 sec bins. Red curve is a Poisson curve with rate = median count rate of data. |
 |
 |
| Quadrant-wise count rates Data is divided into 100 sec bins |
 |
|
| Module-wise count rates for Quadrant A Data is divided into 100 sec bins |
 |
 |
| Module-wise count rates for Quadrant B Data is divided into 100 sec bins |
 |
 |
| Module-wise count rates for Quadrant C Data is divided into 100 sec bins |
 |
 |
| Module-wise count rates for Quadrant D Data is divided into 100 sec bins |
 |
 |
| Parameter | Plot |
|---|---|
| CZT HV Monitor |  |
| D_VDD | 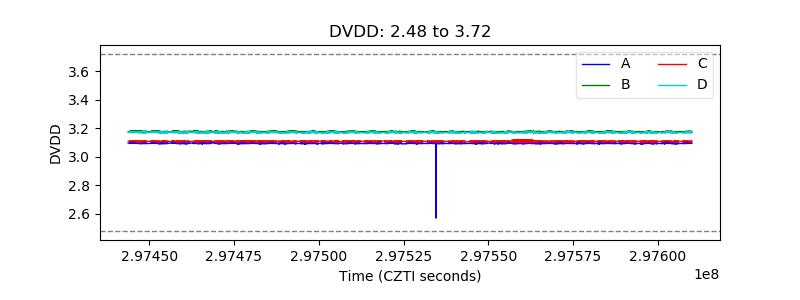 |
| Temperature 1 |  |
| Veto HV Monitor |  |
| Veto LLD |  |
| Alpha Counter |  |
| _CPM_Rate | 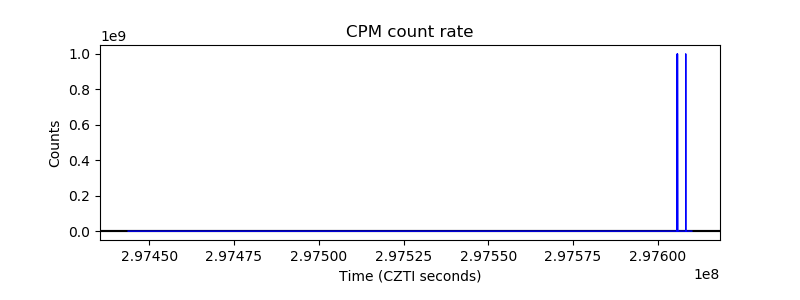 |
| CZT Counter |  |
| +2.5 Volts monitor |  |
| +5 Volts monitor |  |
| _ROLL_ROT |  |
| _Roll_DEC |  |
| _Roll_RA |  |
| Veto Counter |  |