| Param | Original file | Final file |
|---|---|---|
| Filename | modeM0/AS1A05_160T01_9000002970_19932cztM0_level2.evt | modeM0/AS1A05_160T01_9000002970_19932cztM0_level2_quad_clean.evt |
| Size (bytes) | 547,197,120 | 85,104,000 |
| Size | 521.8 MB | 81.2 MB |
| Events in quadrant A | 3,418,769 | 545,066 |
| Events in quadrant B | 3,726,777 | 548,308 |
| Events in quadrant C | 4,240,332 | 522,804 |
| Events in quadrant D | 4,757,568 | 519,591 |
| Mode SS | |||
|---|---|---|---|
| Quadrant | BADHDUFLAG | Total packets | Discarded packets |
| A | 0 | 128 | 0 |
| B | 0 | 128 | 0 |
| C | 0 | 128 | 0 |
| D | 0 | 128 | 0 |
| Mode M0 | |||
|---|---|---|---|
| Quadrant | BADHDUFLAG | Total packets | Discarded packets |
| A | 0 | 14125 | 2 |
| B | 0 | 15195 | 2 |
| C | 0 | 17108 | 2 |
| D | 0 | 18382 | 2 |
| Mode M9 | |||
|---|---|---|---|
| Quadrant | BADHDUFLAG | Total packets | Discarded packets |
| A | 0 | 24 | 0 |
| B | 0 | 25 | 0 |
| C | 0 | 25 | 0 |
| D | 0 | 25 | 0 |
| Quadrant | Total seconds | Saturated seconds | Saturation percentage |
|---|---|---|---|
| A | 6328 | 125 | 1.975348% |
| B | 6328 | 163 | 2.575853% |
| C | 6327 | 226 | 3.571993% |
| D | 6327 | 243 | 3.840683% |
Noise dominated data is calculated using 1-second bins in cleaned event files. If a bin has >2000 counts, and if more than 50% of those come from <1% of pixels, then it is considered to be noise-dominated and hence unusable.
| Quadrant | # 1 sec bins | Bins with >0 counts | Bins with >2000 counts | High rate bins dominated by noise | Noise dominated (total time) | Noise dominated (detector-on time) | Marked lightcurve |
|---|---|---|---|---|---|---|---|
| A | 7603 | 6328 | 0 | 0 | 0.00% | 0.00% | 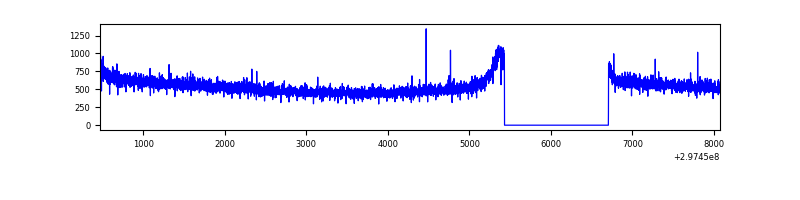 |
| B | 7603 | 6328 | 11 | 11 | 0.14% | 0.17% |  |
| C | 7602 | 6327 | 11 | 11 | 0.14% | 0.17% | 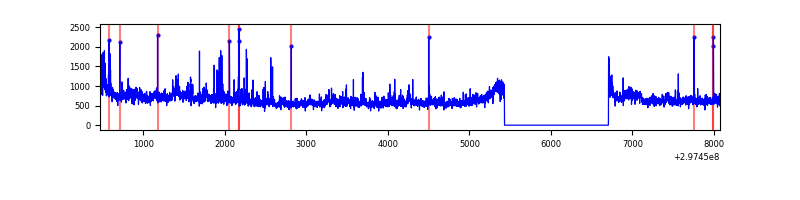 |
| D | 7602 | 6327 | 124 | 124 | 1.63% | 1.96% | 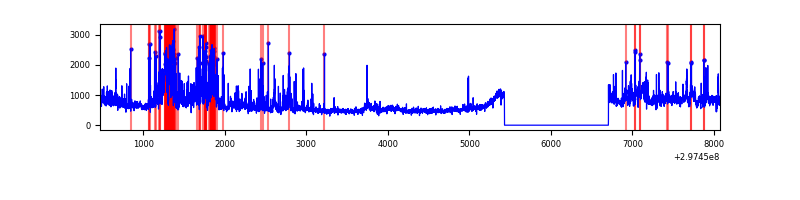 |
Top three noisy pixels from each quadrant. If the there are fewer than three noisy pixels in the level2.evt file, extra rows are filled as -1
| Pixel properties | Quadrant properties | ||||||
|---|---|---|---|---|---|---|---|
| Quadrant | DetID | PixID | Counts | Sigma | Mean | Median | Sigma |
| A | 0 | 226 | 7734 | 38.62 | 887 | 872 | 177.7 |
| A | 3 | 137 | 6446 | 31.37 | 887 | 872 | 177.7 |
| A | 12 | 194 | 6408 | 31.16 | 887 | 872 | 177.7 |
| B | 0 | 189 | 104016 | 619.82 | 881 | 861 | 166.4 |
| B | 0 | 197 | 53453 | 316.01 | 881 | 861 | 166.4 |
| B | 7 | 220 | 44720 | 263.53 | 881 | 861 | 166.4 |
| C | 3 | 233 | 646802 | 3270.75 | 850 | 860 | 197.5 |
| C | 14 | 238 | 131949 | 663.77 | 850 | 860 | 197.5 |
| C | 4 | 254 | 93623 | 469.71 | 850 | 860 | 197.5 |
| D | 1 | 52 | 1018099 | 4891.15 | 865 | 844 | 208.0 |
| D | 7 | 38 | 422022 | 2025.1 | 865 | 844 | 208.0 |
| D | 2 | 234 | 40570 | 191.01 | 865 | 844 | 208.0 |
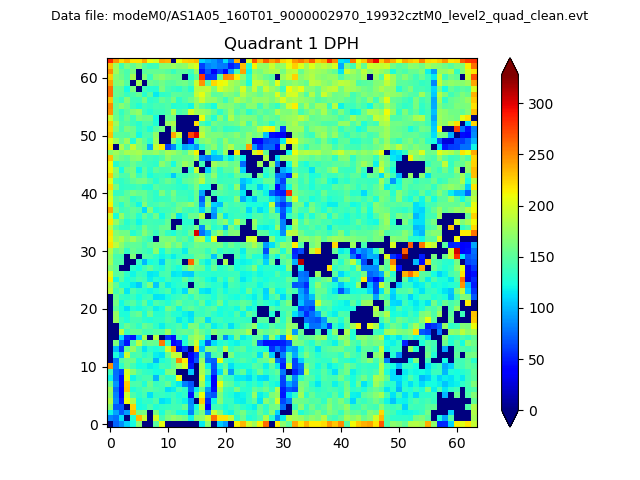
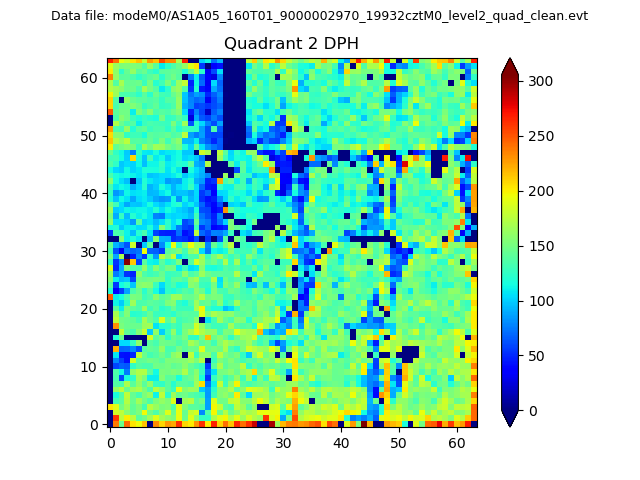
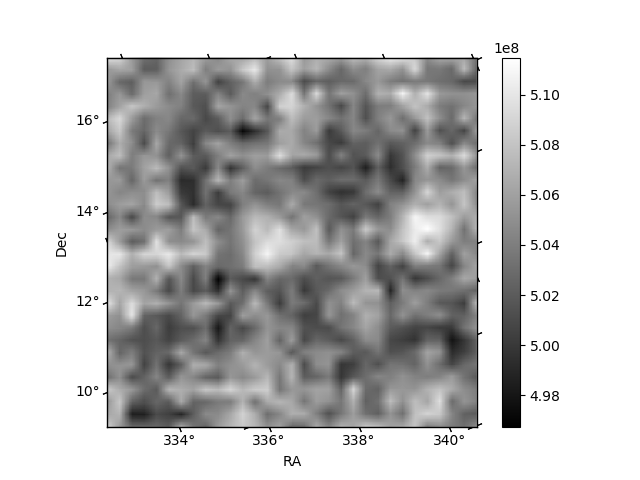
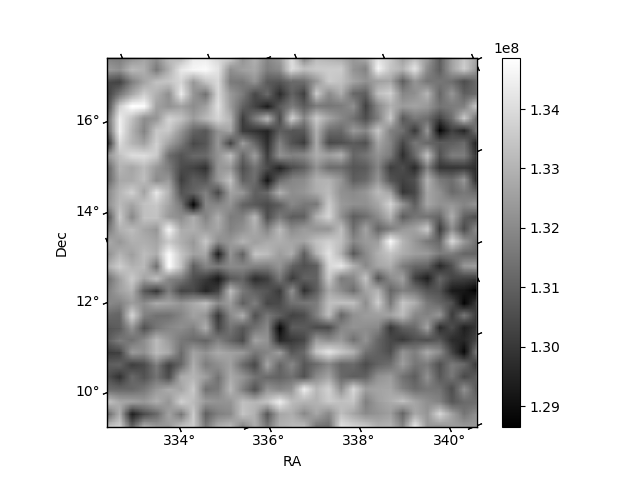
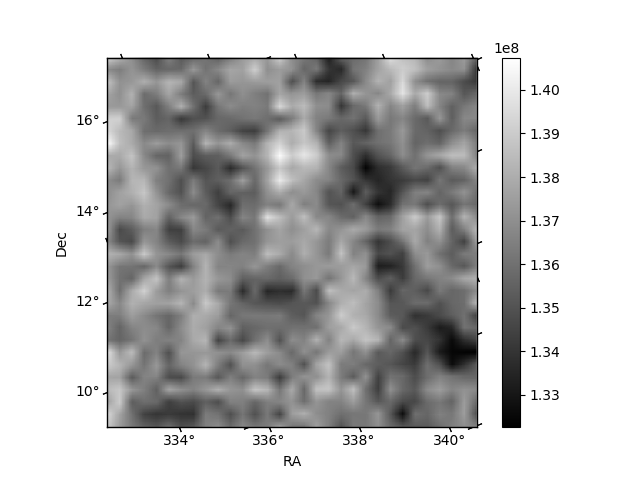
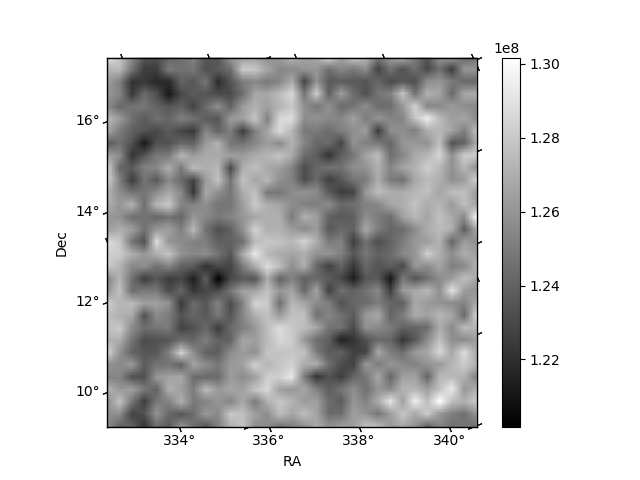
Histogram calculated using DETX and DETY for each event in the final _common_clean file
| Quadrant A | 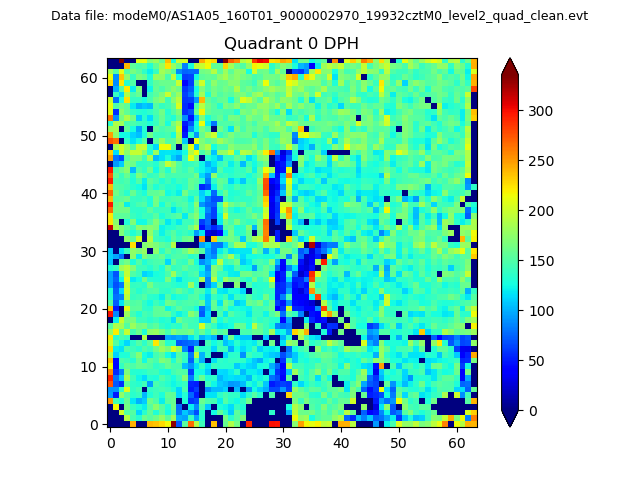 |
 |
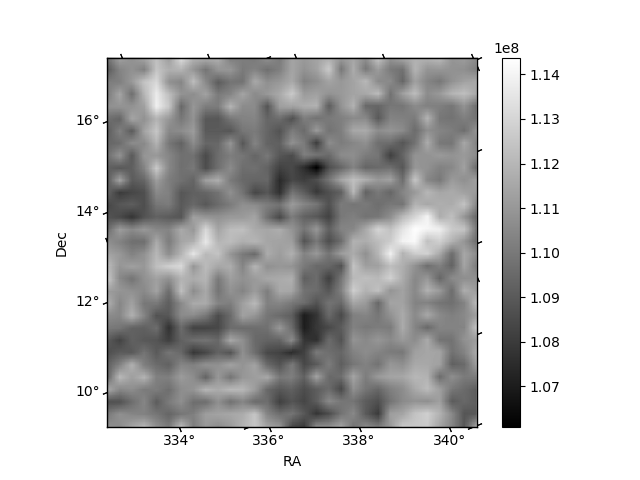
Quadrant B |
|---|---|---|---|
| Quadrant D | 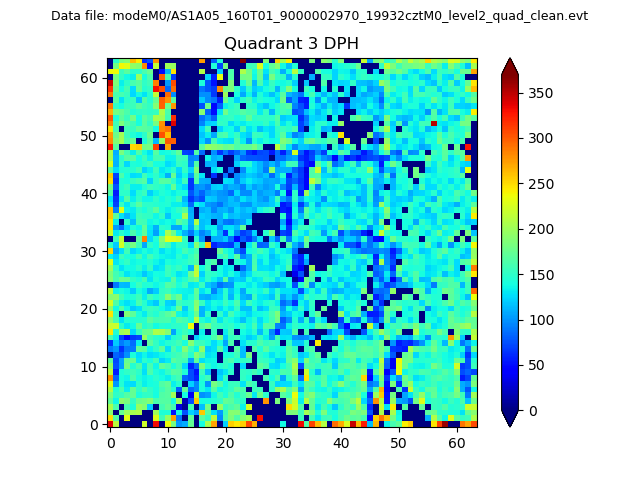 |
 |
Quadrant C |
| Plot type | Count rate plots | Images |
|---|---|---|
| Comparison with Poisson distribution Blue bars denote a histogram of data divided into 1 sec bins. Red curve is a Poisson curve with rate = median count rate of data. |
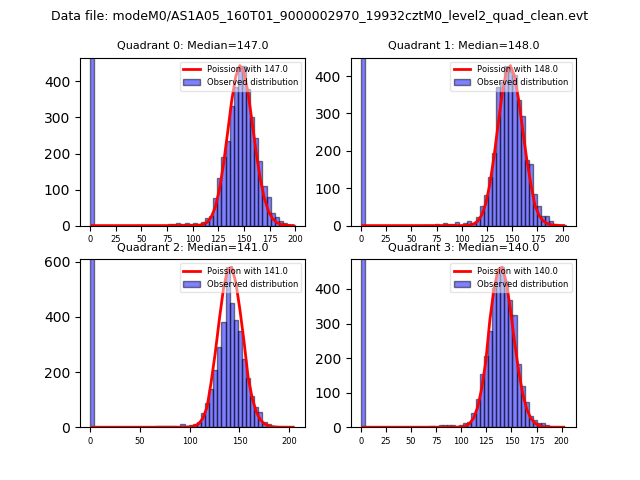 |
 |
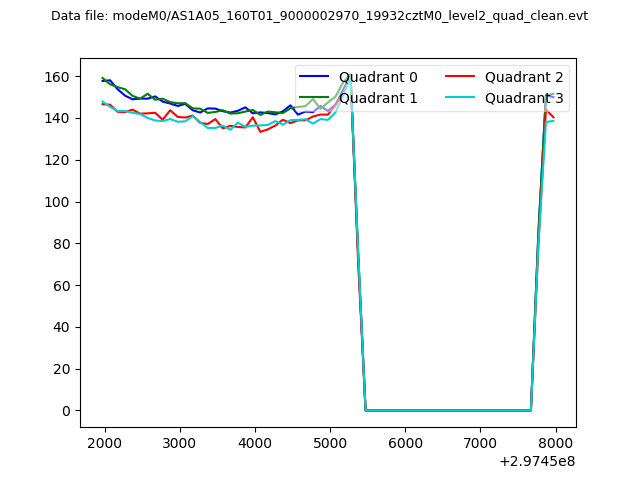
| Quadrant-wise count rates Data is divided into 100 sec bins |
 |
|
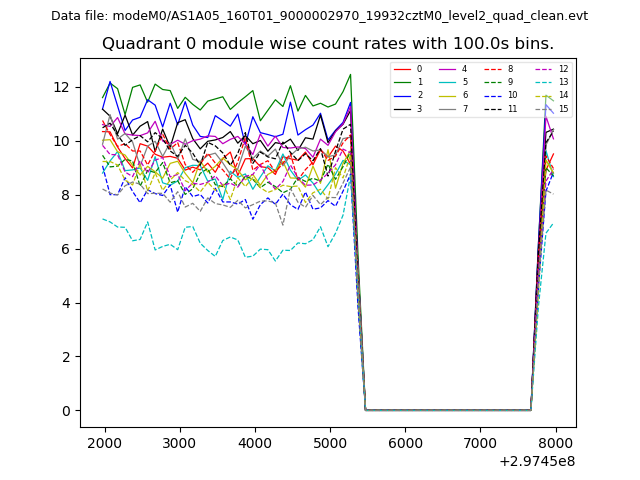
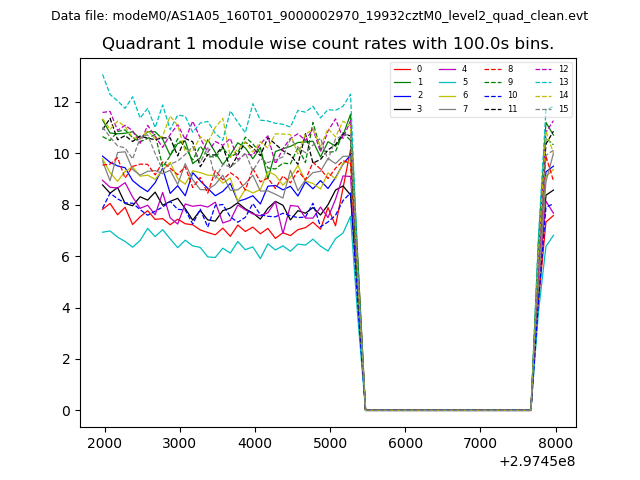
| Module-wise count rates for Quadrant A Data is divided into 100 sec bins |
 |
 |
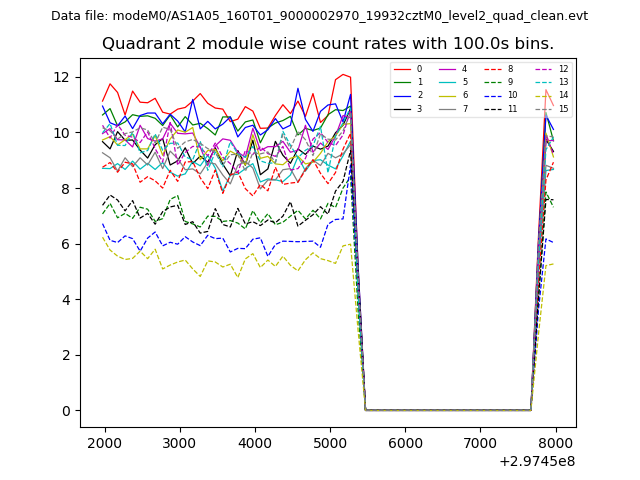
| Module-wise count rates for Quadrant B Data is divided into 100 sec bins |
 |
 |
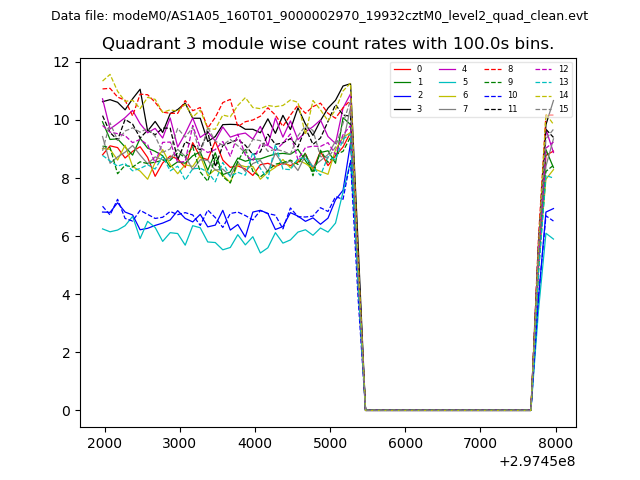
| Module-wise count rates for Quadrant C Data is divided into 100 sec bins |
 |
 |
| Module-wise count rates for Quadrant D Data is divided into 100 sec bins |
 |
 |
| Parameter | Plot |
|---|---|
| CZT HV Monitor | 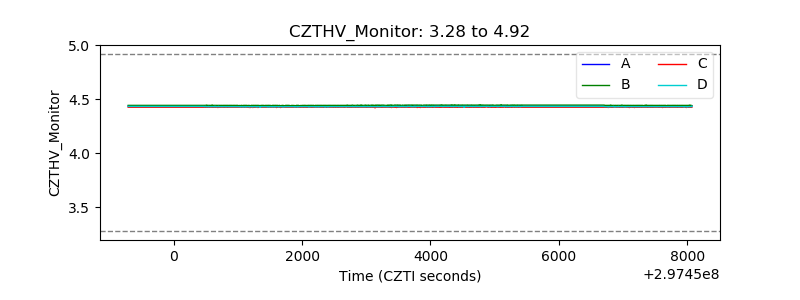 |
| D_VDD | 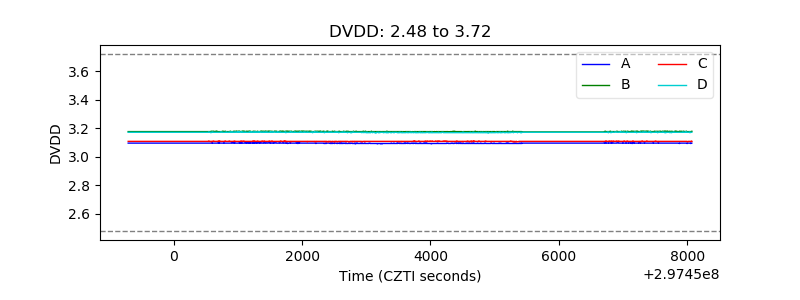 |
| Temperature 1 | 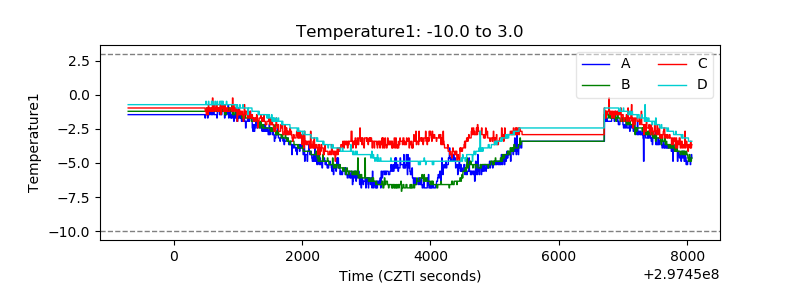 |
| Veto HV Monitor | 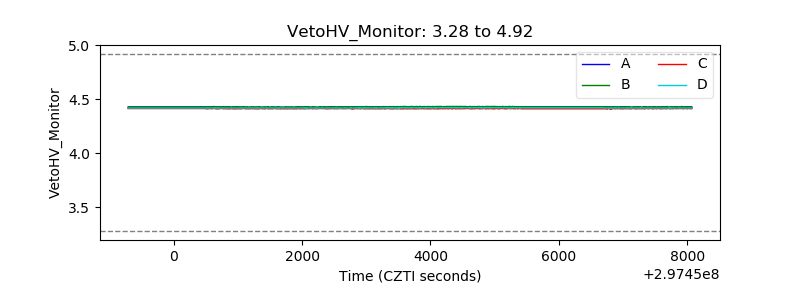 |
| Veto LLD | 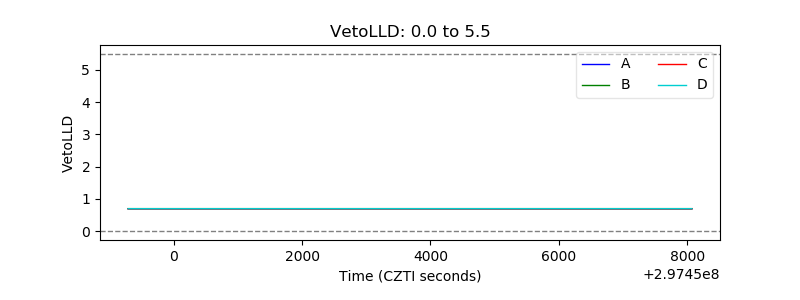 |
| Alpha Counter | 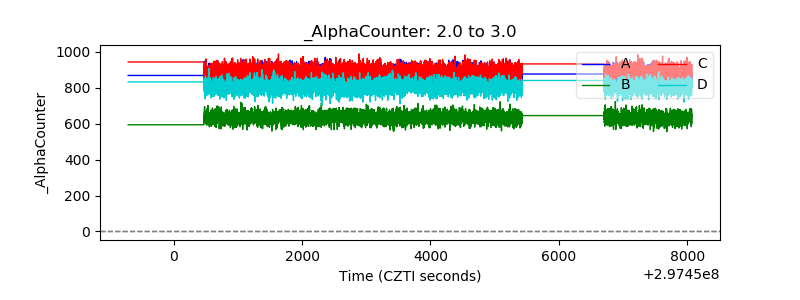 |
| _CPM_Rate | 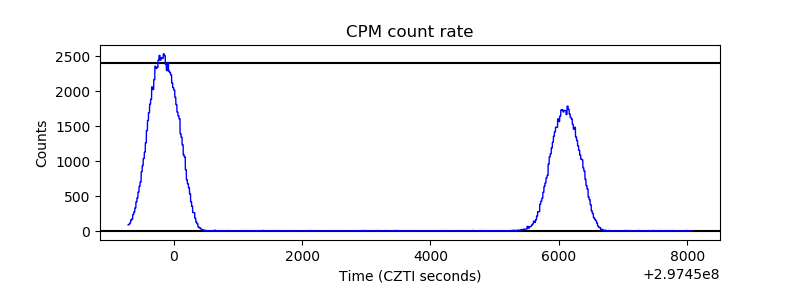 |
| CZT Counter | 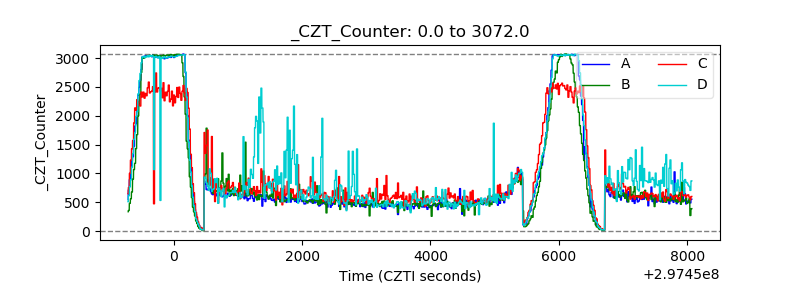 |
| +2.5 Volts monitor |  |
| +5 Volts monitor |  |
| _ROLL_ROT | 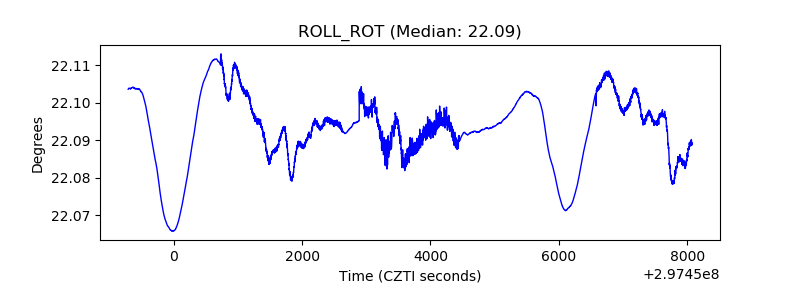 |
| _Roll_DEC | 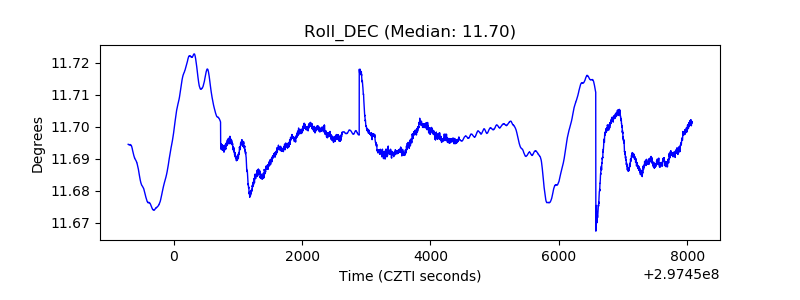 |
| _Roll_RA | 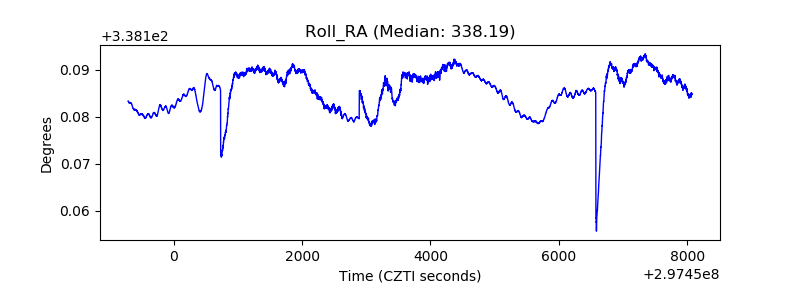 |
| Veto Counter | 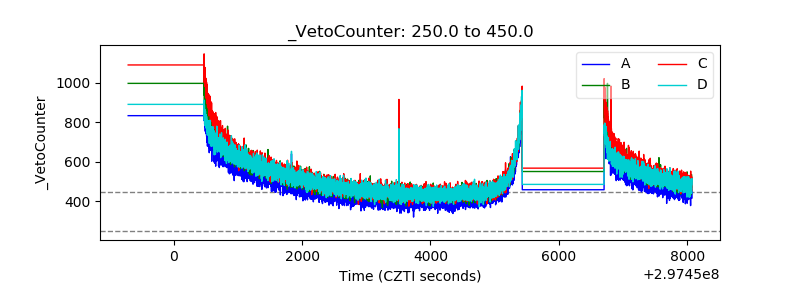 |