| Param | Original file | Final file |
|---|---|---|
| Filename | modeM0/AS1A05_160T01_9000002970_19933cztM0_level2.evt | modeM0/AS1A05_160T01_9000002970_19933cztM0_level2_quad_clean.evt |
| Size (bytes) | 518,699,520 | 90,783,360 |
| Size | 494.7 MB | 86.6 MB |
| Events in quadrant A | 3,305,277 | 587,572 |
| Events in quadrant B | 3,482,333 | 592,386 |
| Events in quadrant C | 3,906,383 | 563,371 |
| Events in quadrant D | 4,579,394 | 557,886 |
| Mode SS | |||
|---|---|---|---|
| Quadrant | BADHDUFLAG | Total packets | Discarded packets |
| A | 0 | 134 | 0 |
| B | 0 | 134 | 0 |
| C | 0 | 134 | 0 |
| D | 0 | 134 | 0 |
| Mode M0 | |||
|---|---|---|---|
| Quadrant | BADHDUFLAG | Total packets | Discarded packets |
| A | 0 | 13809 | 2 |
| B | 0 | 14473 | 2 |
| C | 0 | 15746 | 2 |
| D | 0 | 17907 | 2 |
| Mode M9 | |||
|---|---|---|---|
| Quadrant | BADHDUFLAG | Total packets | Discarded packets |
| A | 0 | 24 | 0 |
| B | 0 | 24 | 0 |
| C | 0 | 24 | 0 |
| D | 0 | 24 | 0 |
| Quadrant | Total seconds | Saturated seconds | Saturation percentage |
|---|---|---|---|
| A | 6417 | 117 | 1.823282% |
| B | 6417 | 151 | 2.353125% |
| C | 6417 | 245 | 3.817983% |
| D | 6417 | 256 | 3.989403% |
Noise dominated data is calculated using 1-second bins in cleaned event files. If a bin has >2000 counts, and if more than 50% of those come from <1% of pixels, then it is considered to be noise-dominated and hence unusable.
| Quadrant | # 1 sec bins | Bins with >0 counts | Bins with >2000 counts | High rate bins dominated by noise | Noise dominated (total time) | Noise dominated (detector-on time) | Marked lightcurve |
|---|---|---|---|---|---|---|---|
| A | 8862 | 6418 | 0 | 0 | 0.00% | 0.00% | 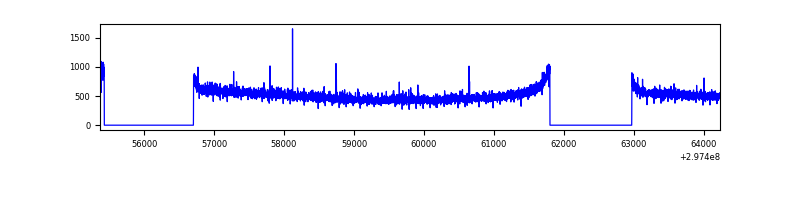 |
| B | 8862 | 6417 | 8 | 8 | 0.09% | 0.12% | 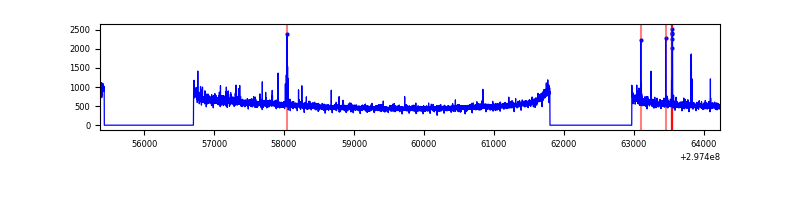 |
| C | 8862 | 6417 | 28 | 28 | 0.32% | 0.44% | 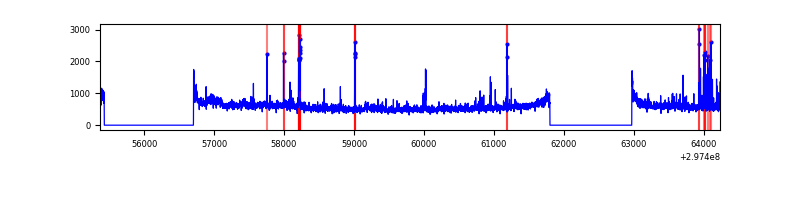 |
| D | 8862 | 6417 | 146 | 146 | 1.65% | 2.28% | 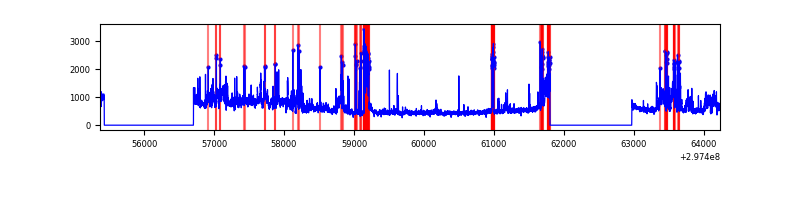 |
Top three noisy pixels from each quadrant. If the there are fewer than three noisy pixels in the level2.evt file, extra rows are filled as -1
| Pixel properties | Quadrant properties | ||||||
|---|---|---|---|---|---|---|---|
| Quadrant | DetID | PixID | Counts | Sigma | Mean | Median | Sigma |
| A | 3 | 1 | 11819 | 63.61 | 856 | 838 | 172.6 |
| A | 0 | 226 | 7436 | 38.22 | 856 | 838 | 172.6 |
| A | 3 | 137 | 6425 | 32.37 | 856 | 838 | 172.6 |
| B | 0 | 197 | 51982 | 310.33 | 853 | 830 | 164.8 |
| B | 7 | 220 | 42582 | 253.3 | 853 | 830 | 164.8 |
| B | 0 | 189 | 27555 | 162.14 | 853 | 830 | 164.8 |
| C | 3 | 233 | 313497 | 1623.7 | 822 | 829 | 192.6 |
| C | 4 | 254 | 151741 | 783.7 | 822 | 829 | 192.6 |
| C | 14 | 238 | 128254 | 661.73 | 822 | 829 | 192.6 |
| D | 1 | 52 | 1027415 | 5094.28 | 832 | 811 | 201.5 |
| D | 7 | 38 | 322826 | 1597.92 | 832 | 811 | 201.5 |
| D | 7 | 238 | 43771 | 213.18 | 832 | 811 | 201.5 |
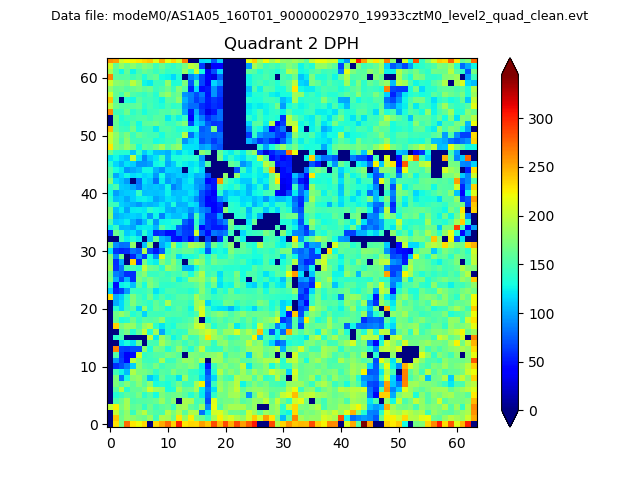
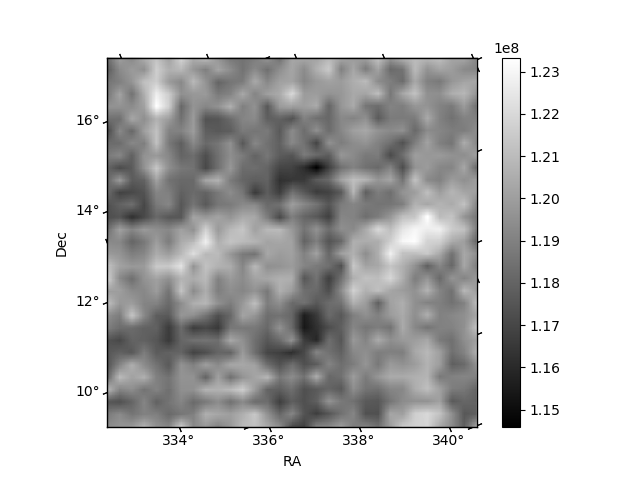
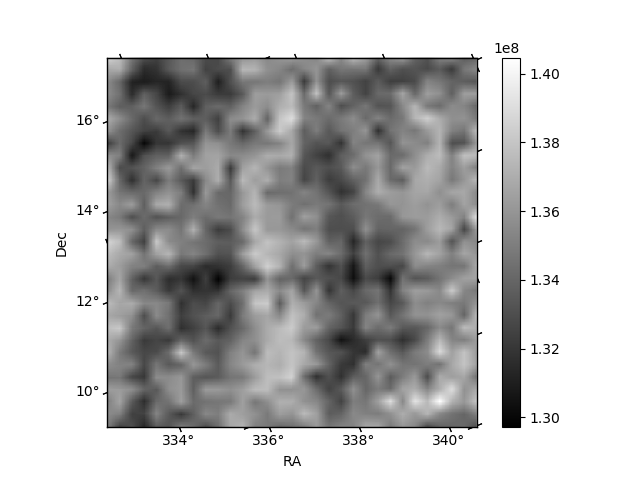
Histogram calculated using DETX and DETY for each event in the final _common_clean file
| Quadrant A | 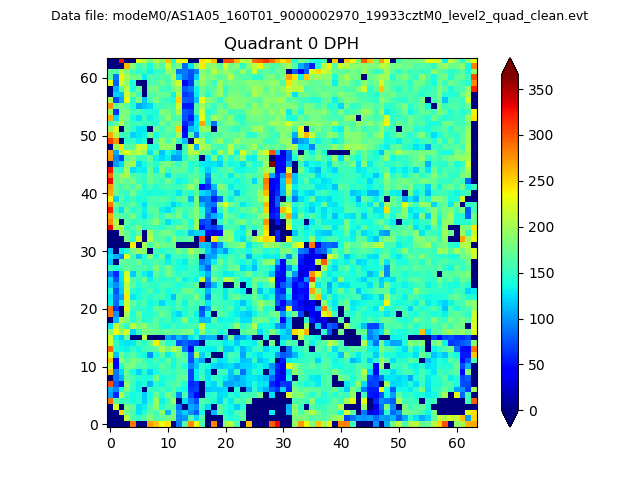 |
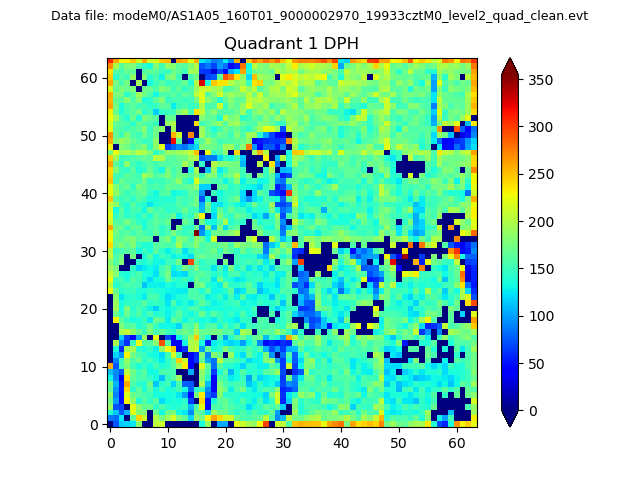 |
Quadrant B |
|---|---|---|---|
| Quadrant D | 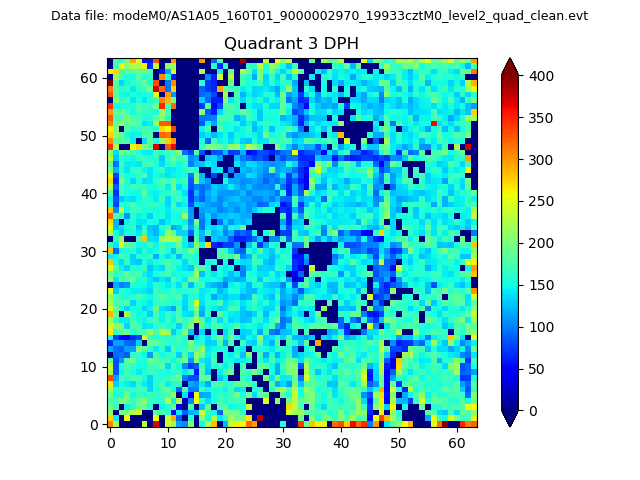 |
 |
Quadrant C |
| Plot type | Count rate plots | Images |
|---|---|---|
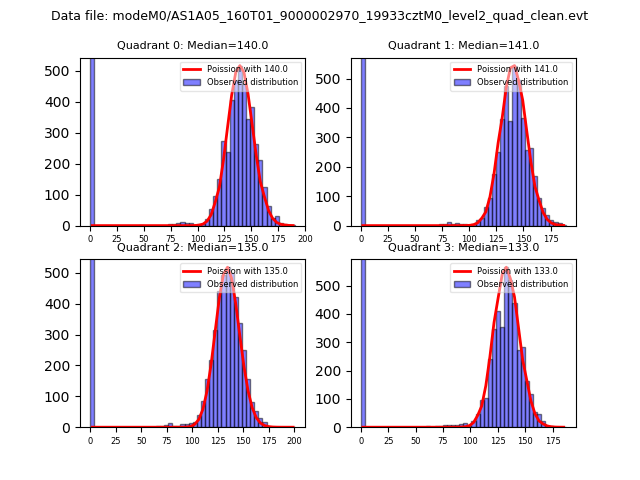
| Comparison with Poisson distribution Blue bars denote a histogram of data divided into 1 sec bins. Red curve is a Poisson curve with rate = median count rate of data. |
 |
 |
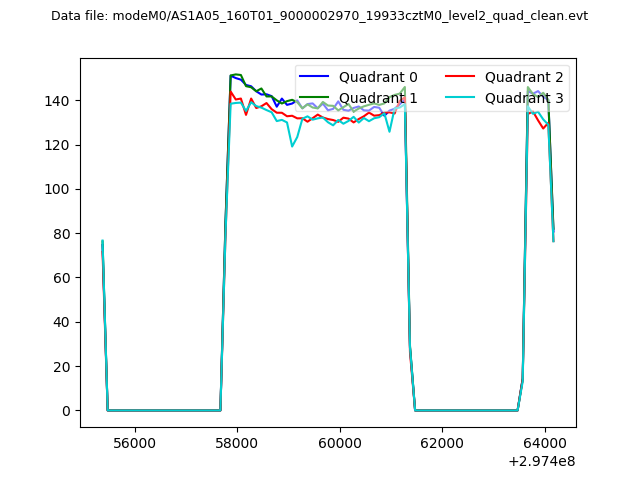
| Quadrant-wise count rates Data is divided into 100 sec bins |
 |
|
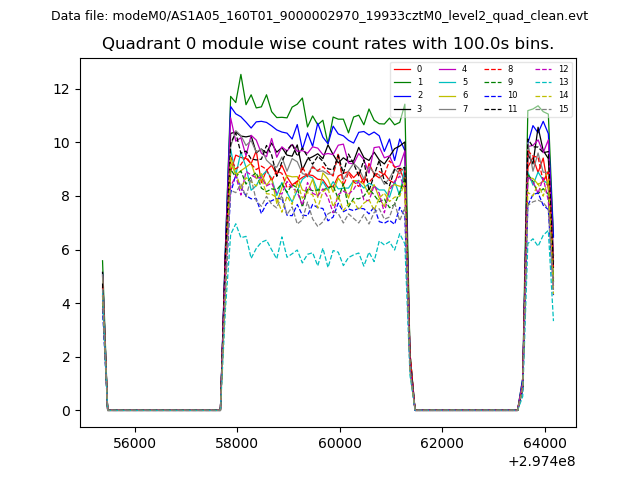
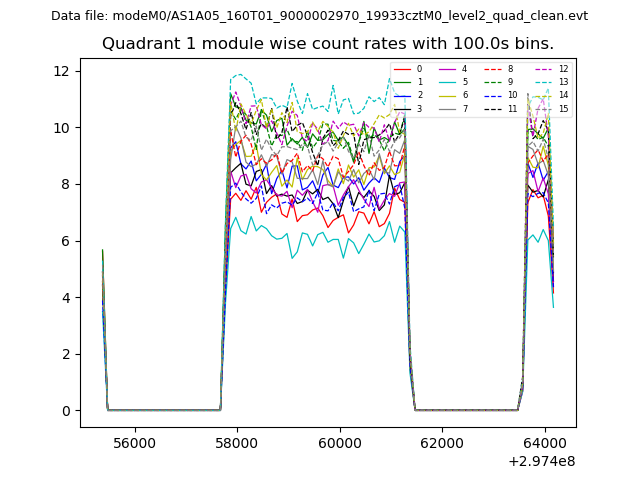
| Module-wise count rates for Quadrant A Data is divided into 100 sec bins |
 |
 |
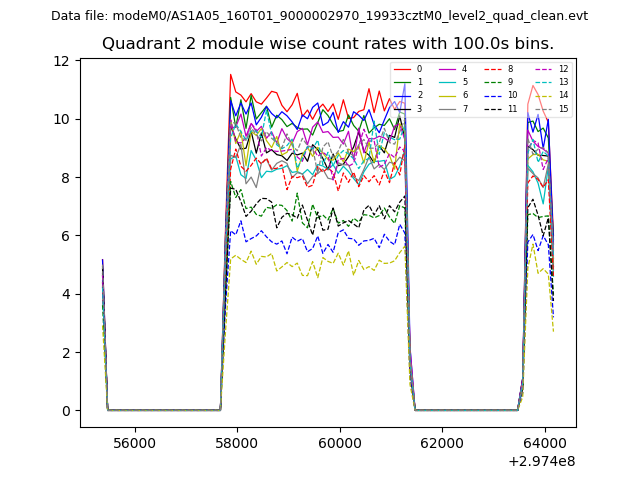
| Module-wise count rates for Quadrant B Data is divided into 100 sec bins |
 |
 |
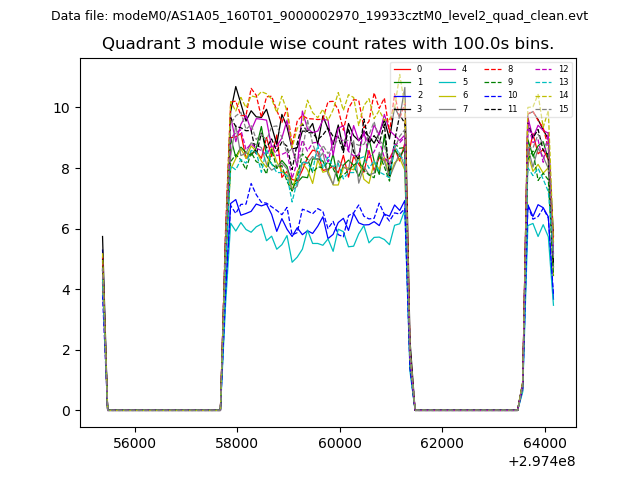
| Module-wise count rates for Quadrant C Data is divided into 100 sec bins |
 |
 |
| Module-wise count rates for Quadrant D Data is divided into 100 sec bins |
 |
 |
| Parameter | Plot |
|---|---|
| CZT HV Monitor |  |
| D_VDD | 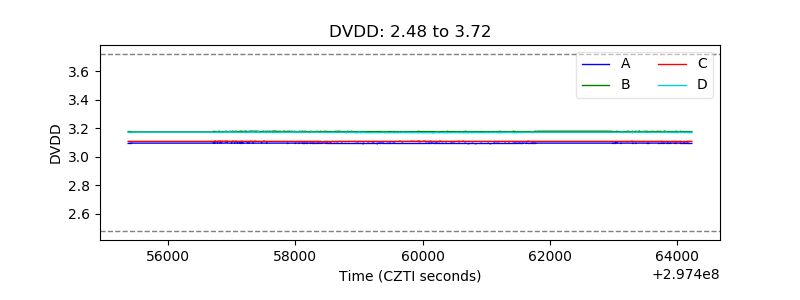 |
| Temperature 1 | 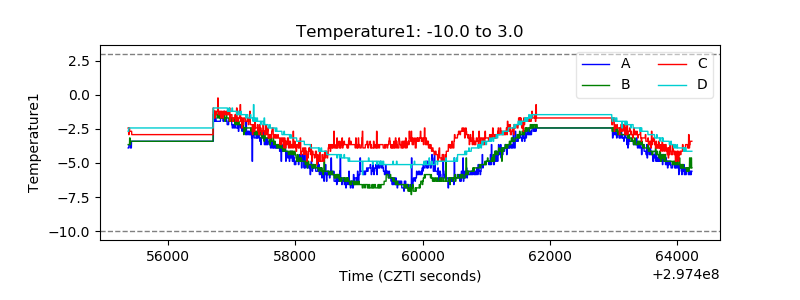 |
| Veto HV Monitor | 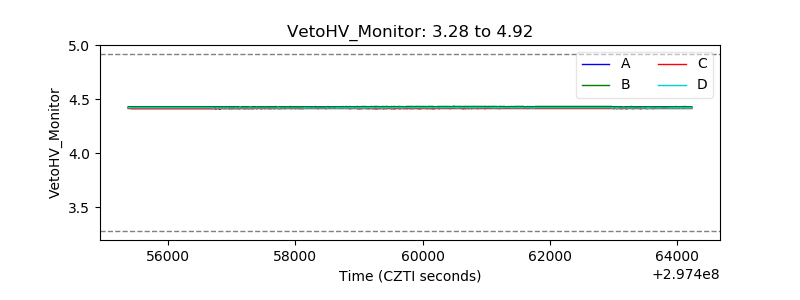 |
| Veto LLD | 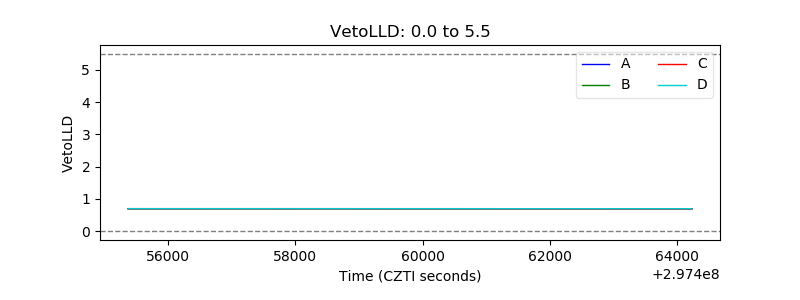 |
| Alpha Counter | 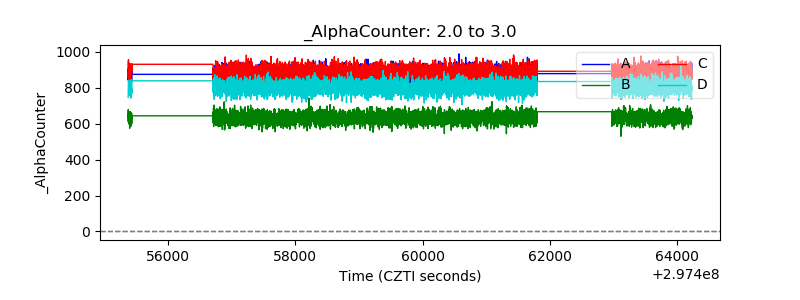 |
| _CPM_Rate |  |
| CZT Counter | 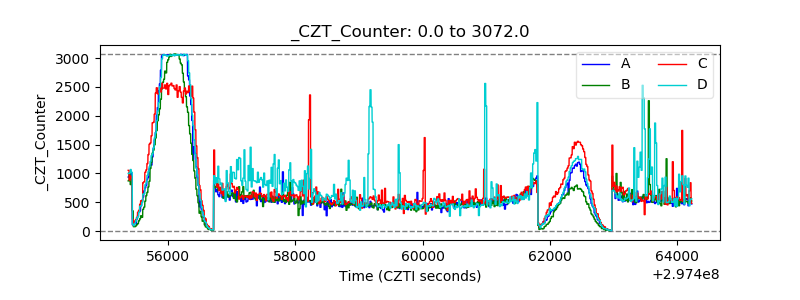 |
| +2.5 Volts monitor |  |
| +5 Volts monitor |  |
| _ROLL_ROT | 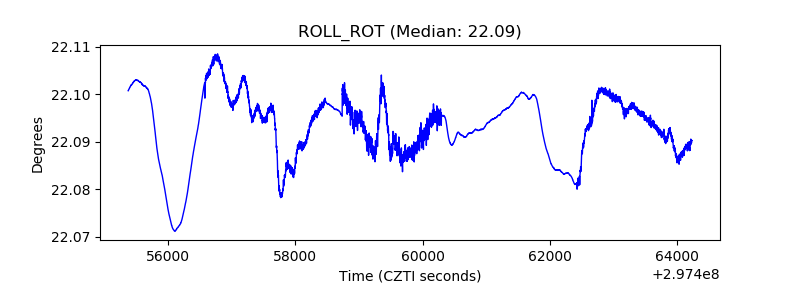 |
| _Roll_DEC | 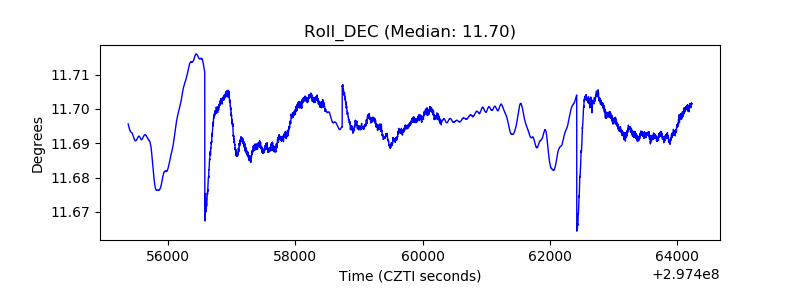 |
| _Roll_RA | 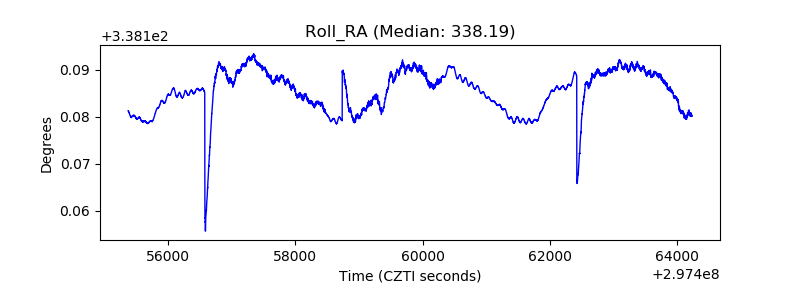 |
| Veto Counter | 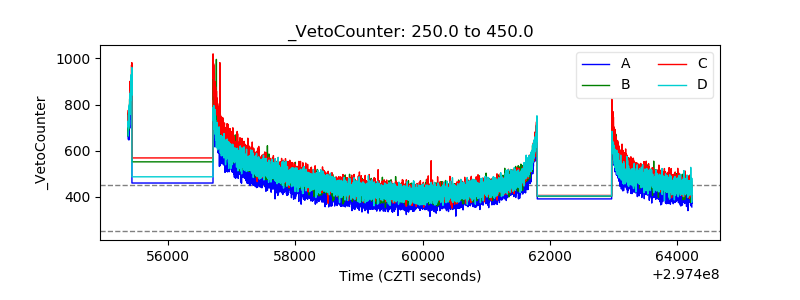 |