| Param | Original file | Final file |
|---|---|---|
| Filename | modeM0/AS1A05_160T01_9000002970_19934cztM0_level2.evt | modeM0/AS1A05_160T01_9000002970_19934cztM0_level2_quad_clean.evt |
| Size (bytes) | 578,747,520 | 93,646,080 |
| Size | 551.9 MB | 89.3 MB |
| Events in quadrant A | 3,473,773 | 604,667 |
| Events in quadrant B | 3,771,618 | 605,061 |
| Events in quadrant C | 4,970,006 | 572,343 |
| Events in quadrant D | 4,841,223 | 569,690 |
| Mode SS | |||
|---|---|---|---|
| Quadrant | BADHDUFLAG | Total packets | Discarded packets |
| A | 0 | 144 | 0 |
| B | 0 | 144 | 0 |
| C | 0 | 144 | 0 |
| D | 0 | 144 | 0 |
| Mode M0 | |||
|---|---|---|---|
| Quadrant | BADHDUFLAG | Total packets | Discarded packets |
| A | 0 | 14715 | 2 |
| B | 0 | 15719 | 2 |
| C | 0 | 19632 | 2 |
| D | 0 | 19071 | 2 |
| Mode M9 | |||
|---|---|---|---|
| Quadrant | BADHDUFLAG | Total packets | Discarded packets |
| A | 0 | 19 | 0 |
| B | 0 | 19 | 0 |
| C | 0 | 19 | 0 |
| D | 0 | 19 | 0 |
| Quadrant | Total seconds | Saturated seconds | Saturation percentage |
|---|---|---|---|
| A | 6947 | 96 | 1.381891% |
| B | 6947 | 189 | 2.720599% |
| C | 6948 | 356 | 5.123777% |
| D | 6948 | 209 | 3.008060% |
Noise dominated data is calculated using 1-second bins in cleaned event files. If a bin has >2000 counts, and if more than 50% of those come from <1% of pixels, then it is considered to be noise-dominated and hence unusable.
| Quadrant | # 1 sec bins | Bins with >0 counts | Bins with >2000 counts | High rate bins dominated by noise | Noise dominated (total time) | Noise dominated (detector-on time) | Marked lightcurve |
|---|---|---|---|---|---|---|---|
| A | 8907 | 6948 | 0 | 0 | 0.00% | 0.00% | 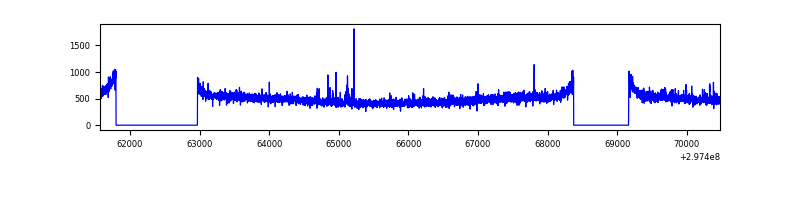 |
| B | 8907 | 6948 | 29 | 29 | 0.33% | 0.42% | 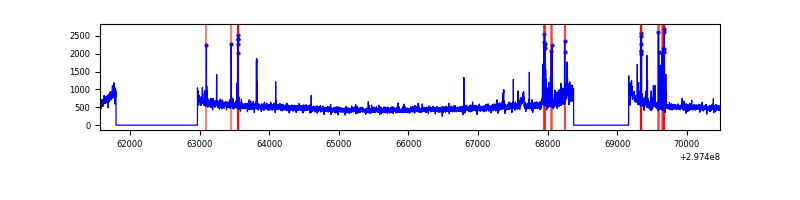 |
| C | 8908 | 6948 | 68 | 68 | 0.76% | 0.98% | 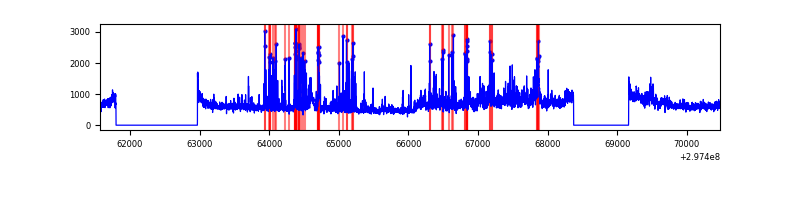 |
| D | 8908 | 6948 | 74 | 74 | 0.83% | 1.07% | 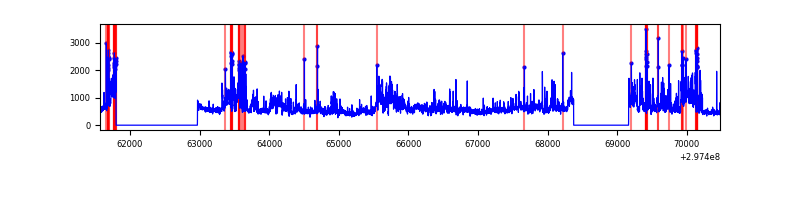 |
Top three noisy pixels from each quadrant. If the there are fewer than three noisy pixels in the level2.evt file, extra rows are filled as -1
| Pixel properties | Quadrant properties | ||||||
|---|---|---|---|---|---|---|---|
| Quadrant | DetID | PixID | Counts | Sigma | Mean | Median | Sigma |
| A | 3 | 1 | 25720 | 137.18 | 891 | 873 | 181.1 |
| A | 5 | 16 | 19893 | 105.01 | 891 | 873 | 181.1 |
| A | 0 | 226 | 7676 | 37.56 | 891 | 873 | 181.1 |
| B | 7 | 220 | 174500 | 1022.71 | 887 | 866 | 169.8 |
| B | 0 | 189 | 35818 | 205.87 | 887 | 866 | 169.8 |
| B | 0 | 197 | 24986 | 142.07 | 887 | 866 | 169.8 |
| C | 3 | 233 | 801514 | 4031.43 | 849 | 855 | 198.6 |
| C | 4 | 254 | 538156 | 2705.39 | 849 | 855 | 198.6 |
| C | 9 | 221 | 142355 | 712.47 | 849 | 855 | 198.6 |
| D | 1 | 52 | 1445177 | 6834.55 | 864 | 839 | 211.3 |
| D | 7 | 38 | 93746 | 439.63 | 864 | 839 | 211.3 |
| D | 2 | 234 | 39917 | 184.92 | 864 | 839 | 211.3 |
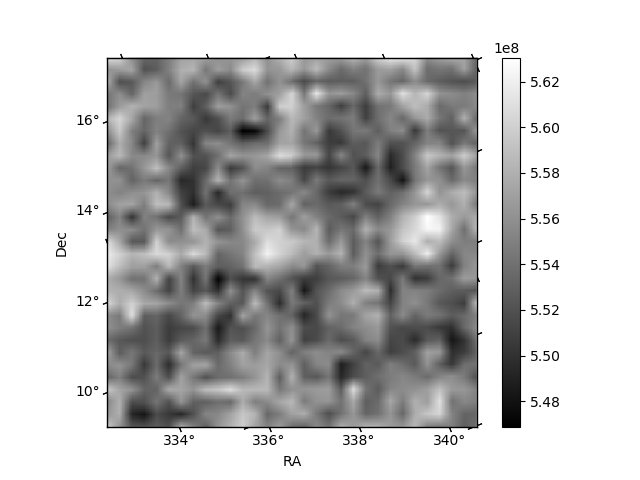
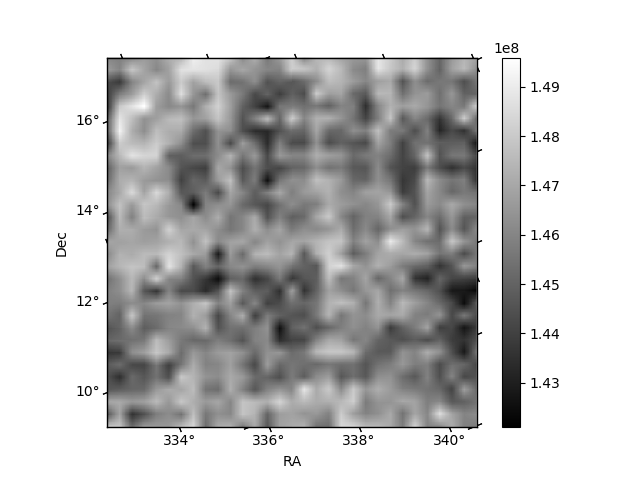
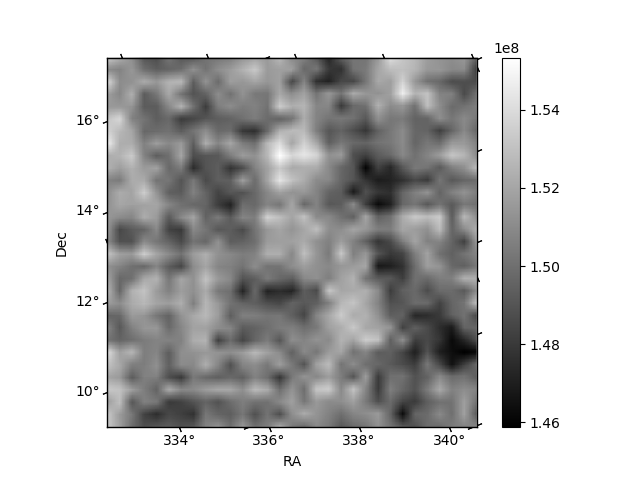
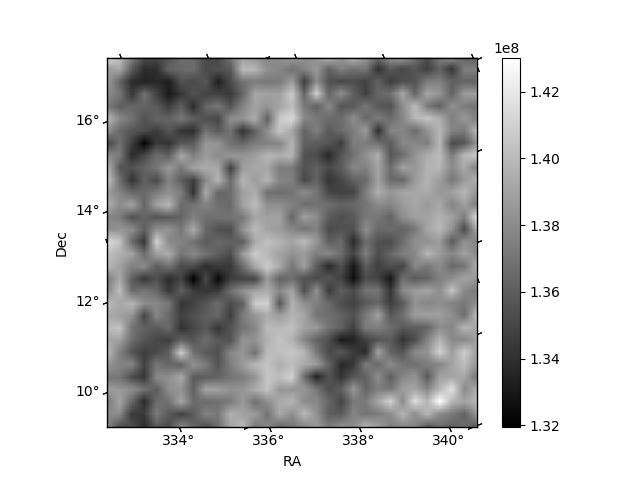
Histogram calculated using DETX and DETY for each event in the final _common_clean file
| Quadrant A | 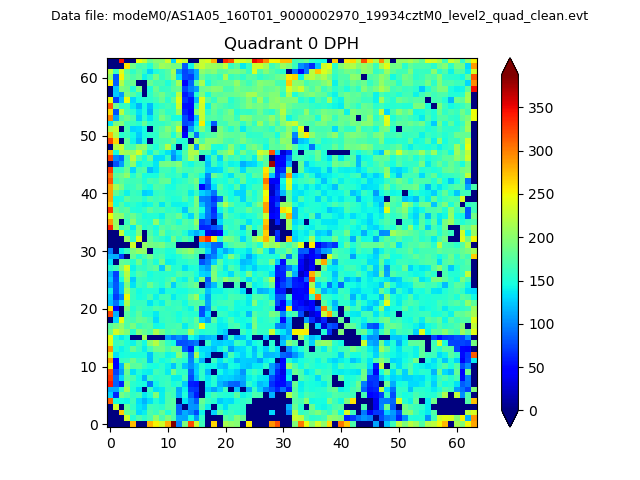 |
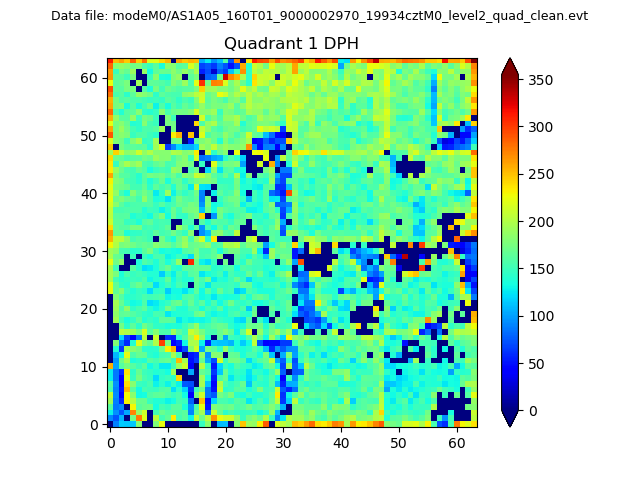 |
Quadrant B |
|---|---|---|---|
| Quadrant D | 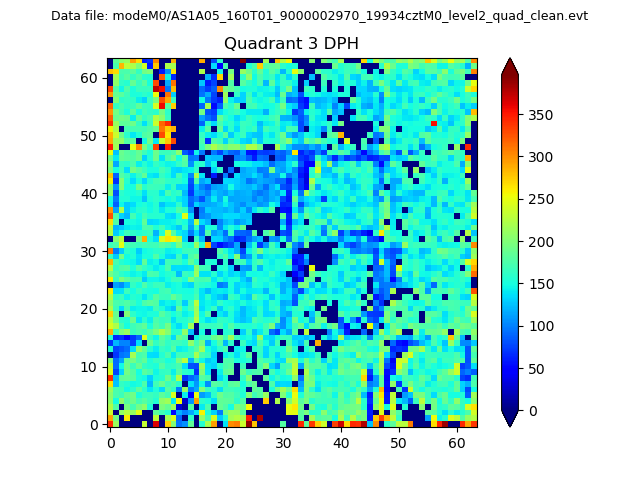 |
 |
Quadrant C |
| Plot type | Count rate plots | Images |
|---|---|---|
| Comparison with Poisson distribution Blue bars denote a histogram of data divided into 1 sec bins. Red curve is a Poisson curve with rate = median count rate of data. |
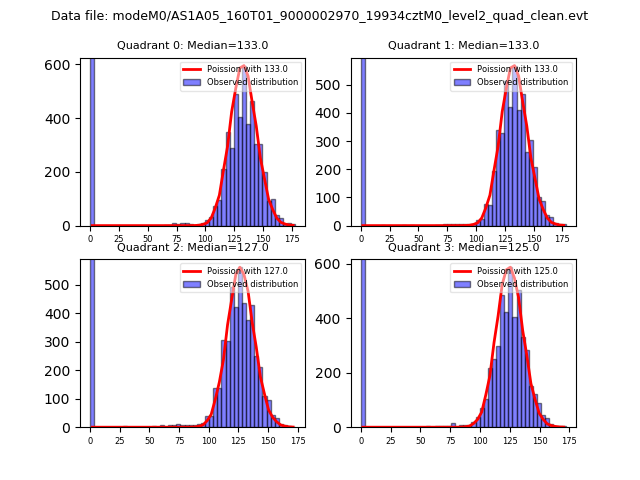 |
 |
| Quadrant-wise count rates Data is divided into 100 sec bins |
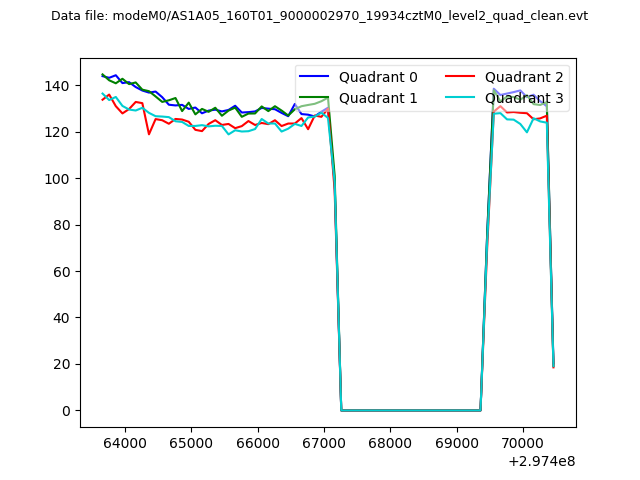 |
|
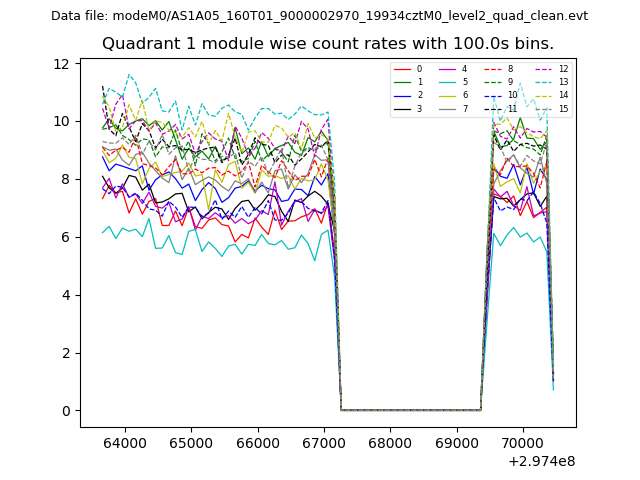
| Module-wise count rates for Quadrant A Data is divided into 100 sec bins |
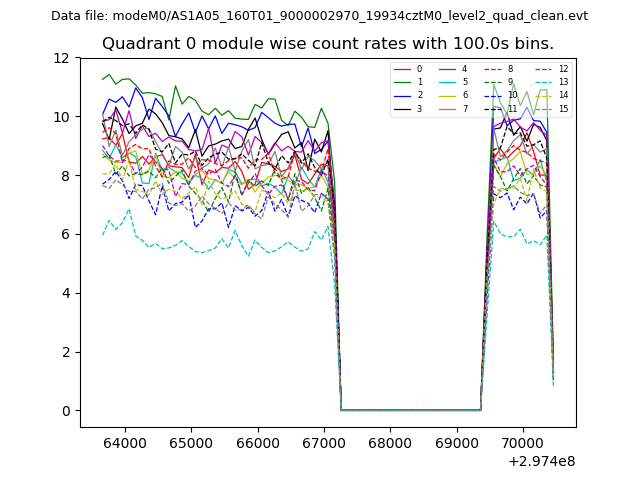 |
 |
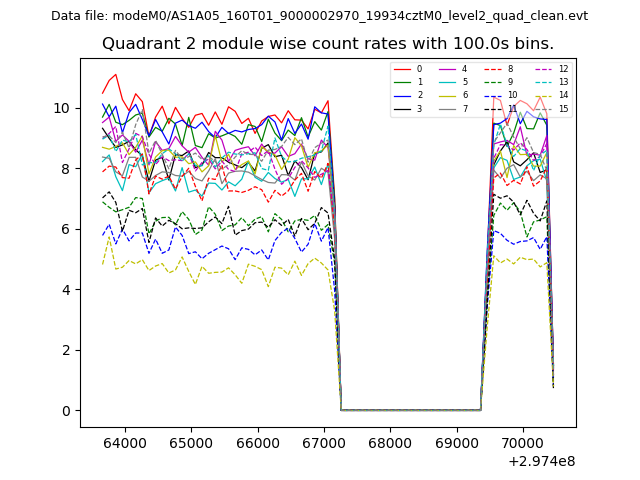
| Module-wise count rates for Quadrant B Data is divided into 100 sec bins |
 |
 |
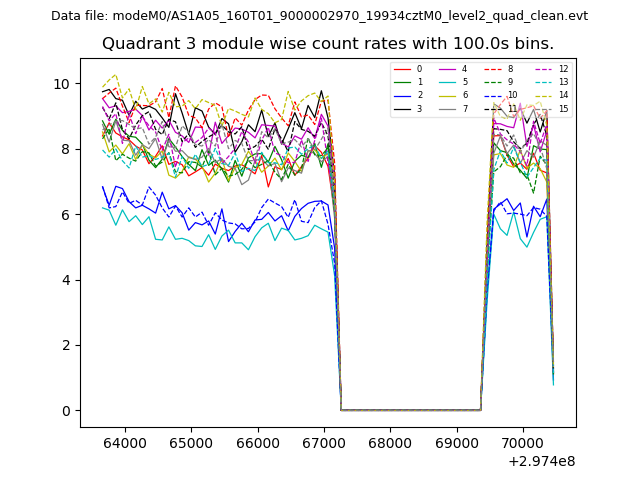
| Module-wise count rates for Quadrant C Data is divided into 100 sec bins |
 |
 |
| Module-wise count rates for Quadrant D Data is divided into 100 sec bins |
 |
 |
| Parameter | Plot |
|---|---|
| CZT HV Monitor | 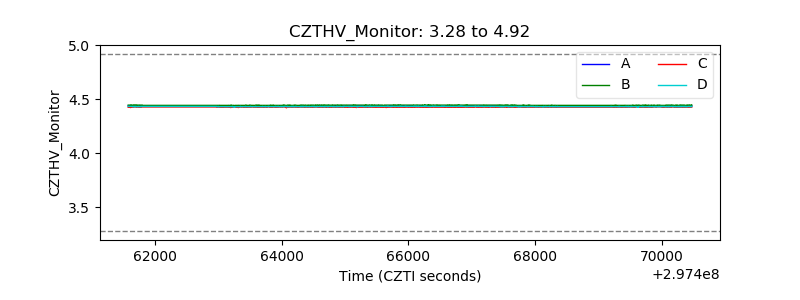 |
| D_VDD | 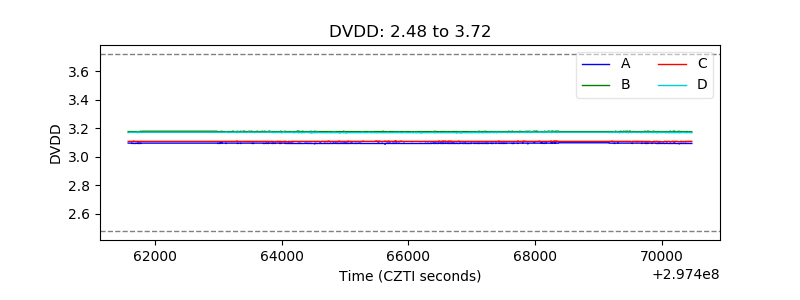 |
| Temperature 1 | 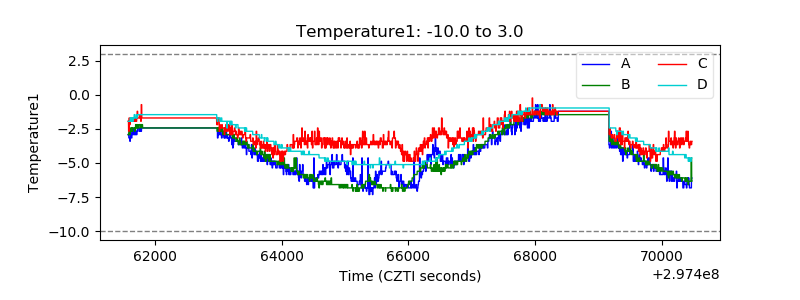 |
| Veto HV Monitor | 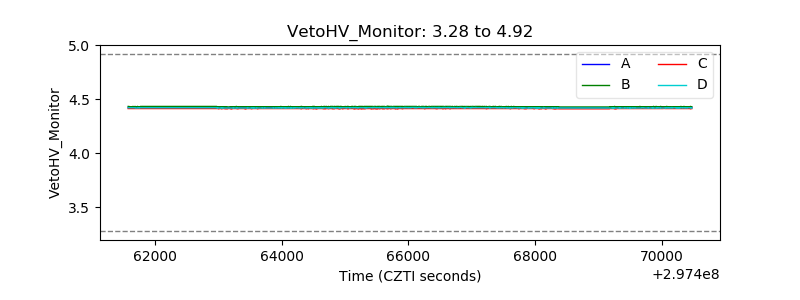 |
| Veto LLD | 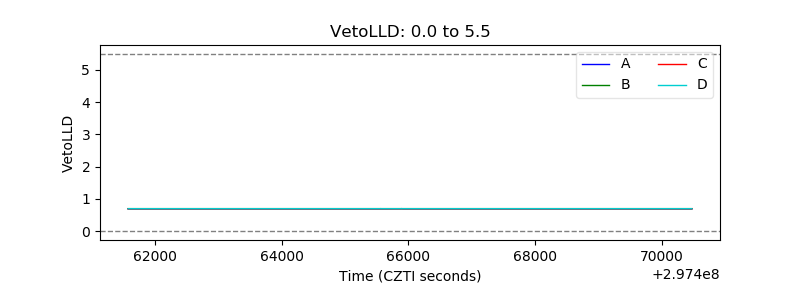 |
| Alpha Counter | 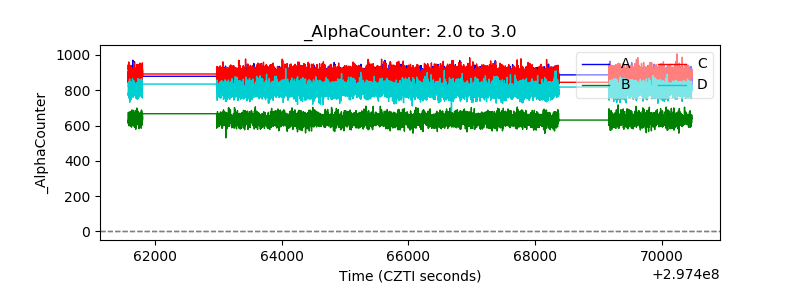 |
| _CPM_Rate | 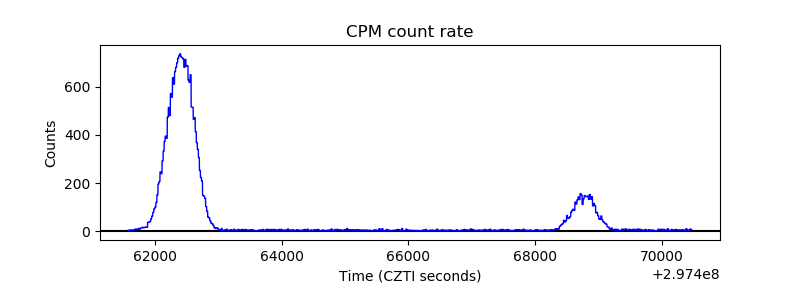 |
| CZT Counter | 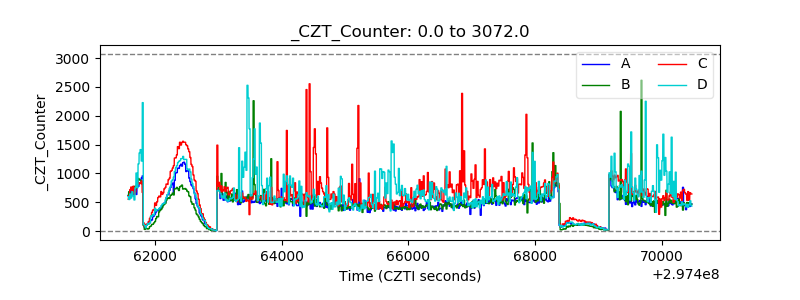 |
| +2.5 Volts monitor |  |
| +5 Volts monitor |  |
| _ROLL_ROT | 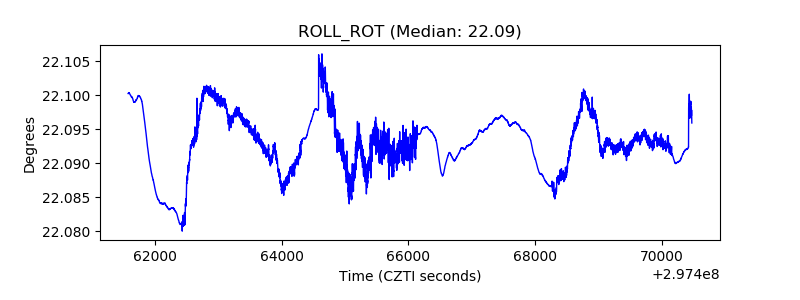 |
| _Roll_DEC | 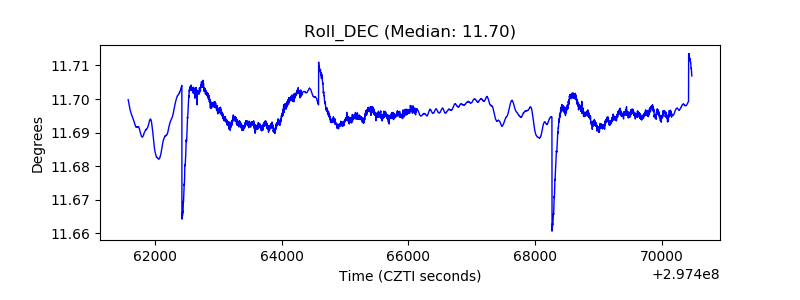 |
| _Roll_RA | 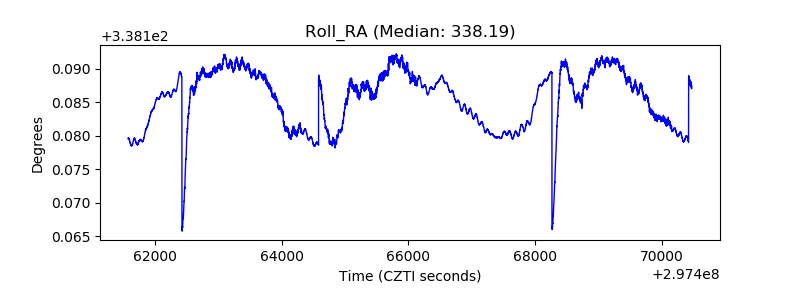 |
| Veto Counter | 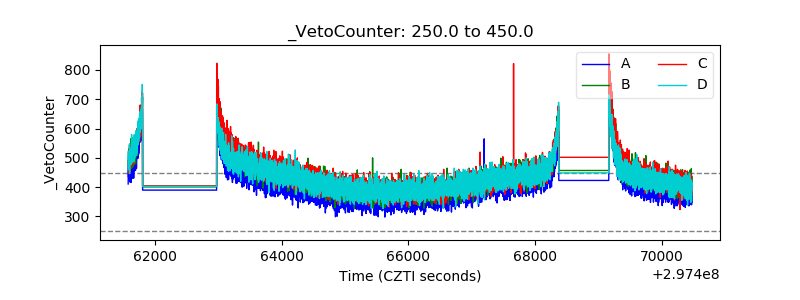 |