| Param | Original file | Final file |
|---|---|---|
| Filename | modeM0/AS1A05_160T01_9000002970_19935cztM0_level2.evt | modeM0/AS1A05_160T01_9000002970_19935cztM0_level2_quad_clean.evt |
| Size (bytes) | 633,510,720 | 101,292,480 |
| Size | 604.2 MB | 96.6 MB |
| Events in quadrant A | 3,788,107 | 654,614 |
| Events in quadrant B | 4,116,077 | 652,173 |
| Events in quadrant C | 5,895,751 | 617,243 |
| Events in quadrant D | 4,870,901 | 614,320 |
| Mode SS | |||
|---|---|---|---|
| Quadrant | BADHDUFLAG | Total packets | Discarded packets |
| A | 0 | 156 | 0 |
| B | 0 | 156 | 0 |
| C | 0 | 156 | 0 |
| D | 0 | 156 | 0 |
| Mode M0 | |||
|---|---|---|---|
| Quadrant | BADHDUFLAG | Total packets | Discarded packets |
| A | 0 | 16201 | 2 |
| B | 0 | 17260 | 3 |
| C | 0 | 23030 | 2 |
| D | 0 | 19539 | 2 |
| Mode M9 | |||
|---|---|---|---|
| Quadrant | BADHDUFLAG | Total packets | Discarded packets |
| A | 0 | 13 | 0 |
| B | 0 | 13 | 0 |
| C | 0 | 13 | 0 |
| D | 0 | 13 | 0 |
| Quadrant | Total seconds | Saturated seconds | Saturation percentage |
|---|---|---|---|
| A | 7608 | 66 | 0.867508% |
| B | 7608 | 199 | 2.615668% |
| C | 7608 | 529 | 6.953207% |
| D | 7608 | 193 | 2.536803% |
Noise dominated data is calculated using 1-second bins in cleaned event files. If a bin has >2000 counts, and if more than 50% of those come from <1% of pixels, then it is considered to be noise-dominated and hence unusable.
| Quadrant | # 1 sec bins | Bins with >0 counts | Bins with >2000 counts | High rate bins dominated by noise | Noise dominated (total time) | Noise dominated (detector-on time) | Marked lightcurve |
|---|---|---|---|---|---|---|---|
| A | 8873 | 7608 | 0 | 0 | 0.00% | 0.00% | 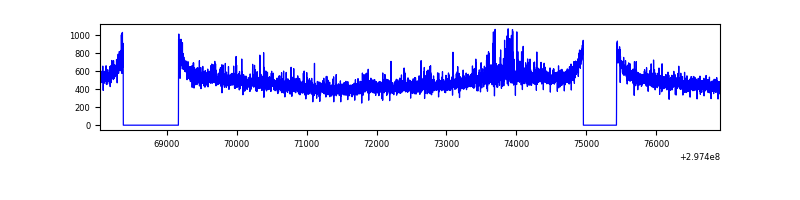 |
| B | 8873 | 7610 | 33 | 33 | 0.37% | 0.43% | 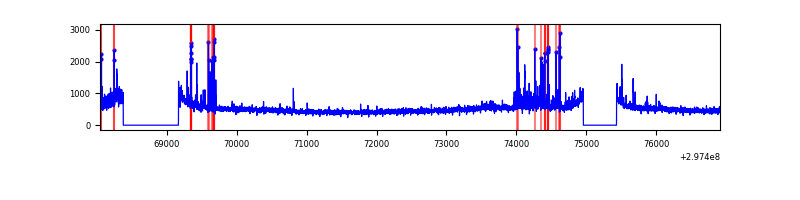 |
| C | 8873 | 7609 | 193 | 193 | 2.18% | 2.54% | 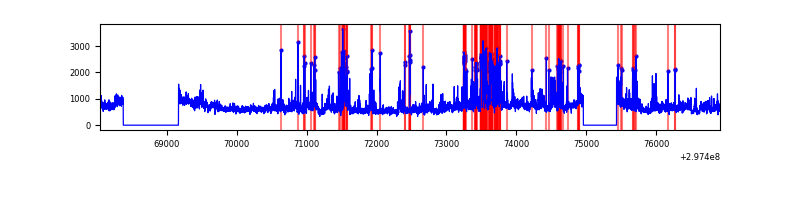 |
| D | 8873 | 7609 | 86 | 86 | 0.97% | 1.13% | 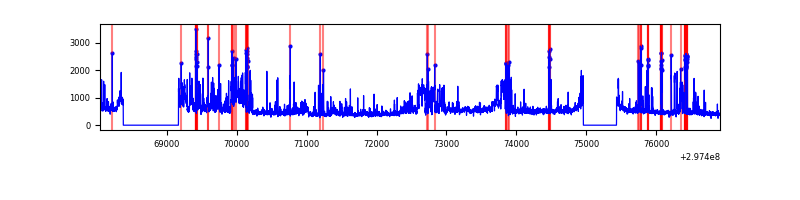 |
Top three noisy pixels from each quadrant. If the there are fewer than three noisy pixels in the level2.evt file, extra rows are filled as -1
| Pixel properties | Quadrant properties | ||||||
|---|---|---|---|---|---|---|---|
| Quadrant | DetID | PixID | Counts | Sigma | Mean | Median | Sigma |
| A | 3 | 1 | 117979 | 603.76 | 952 | 932 | 193.9 |
| A | 0 | 226 | 8313 | 38.07 | 952 | 932 | 193.9 |
| A | 3 | 137 | 7588 | 34.33 | 952 | 932 | 193.9 |
| B | 7 | 220 | 242352 | 1326.51 | 948 | 924 | 182.0 |
| B | 0 | 189 | 38276 | 205.23 | 948 | 924 | 182.0 |
| B | 0 | 197 | 35463 | 189.77 | 948 | 924 | 182.0 |
| C | 3 | 233 | 1264459 | 5959.37 | 897 | 903 | 212.0 |
| C | 4 | 254 | 911045 | 4292.55 | 897 | 903 | 212.0 |
| C | 14 | 238 | 135856 | 636.49 | 897 | 903 | 212.0 |
| D | 1 | 52 | 1270120 | 5542.06 | 924 | 896 | 229.0 |
| D | 9 | 1 | 56112 | 241.1 | 924 | 896 | 229.0 |
| D | 2 | 234 | 37048 | 157.86 | 924 | 896 | 229.0 |
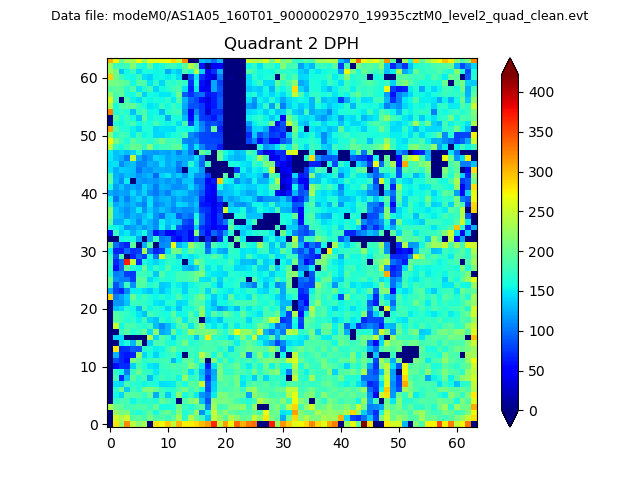
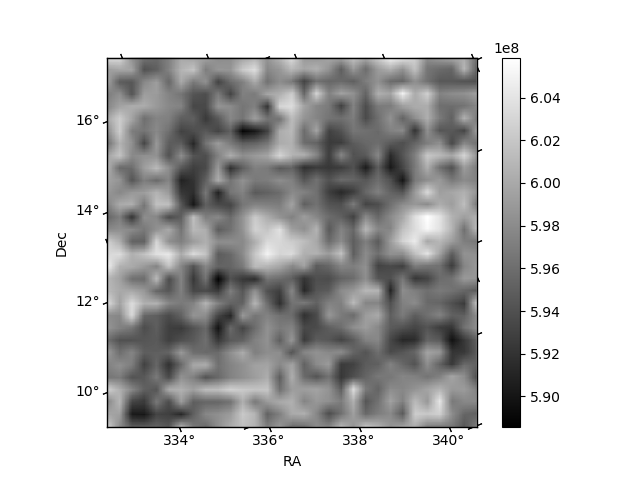
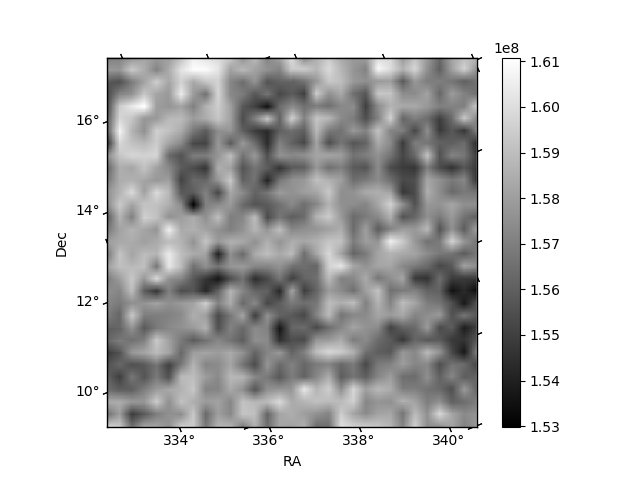
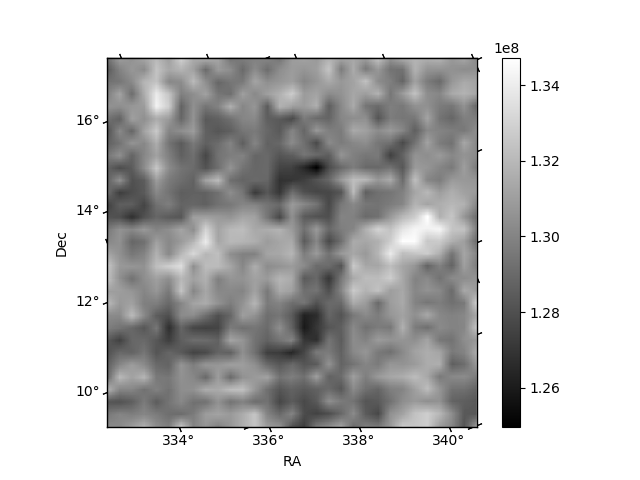
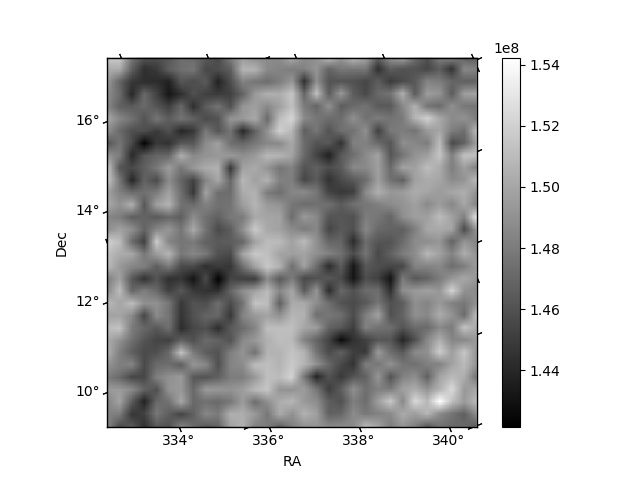
Histogram calculated using DETX and DETY for each event in the final _common_clean file
| Quadrant A | 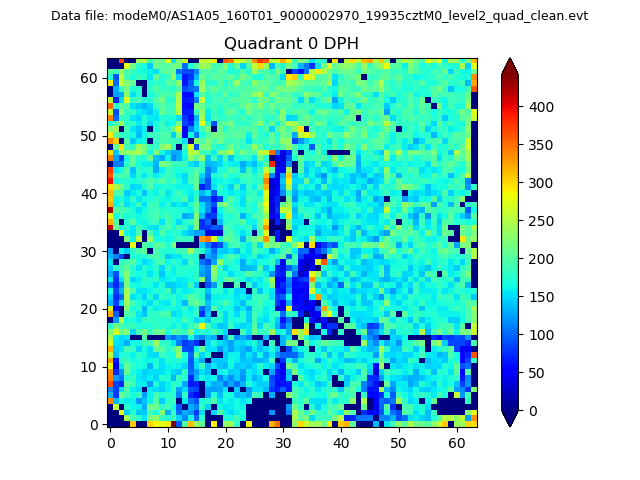 |
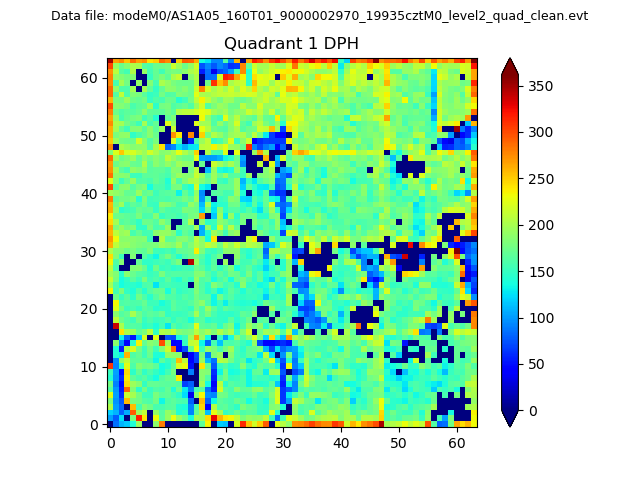 |
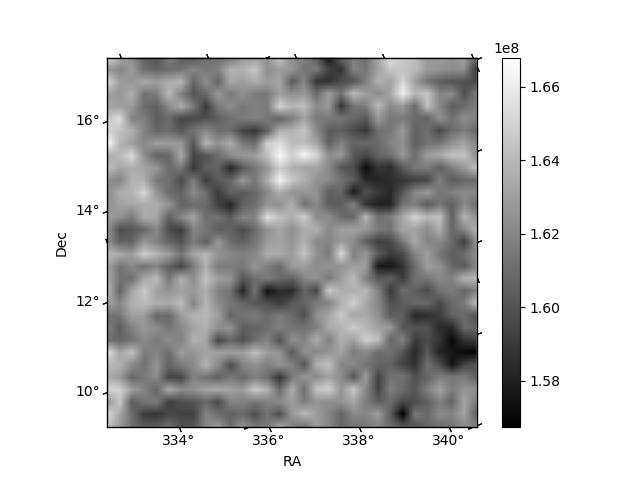
Quadrant B |
|---|---|---|---|
| Quadrant D | 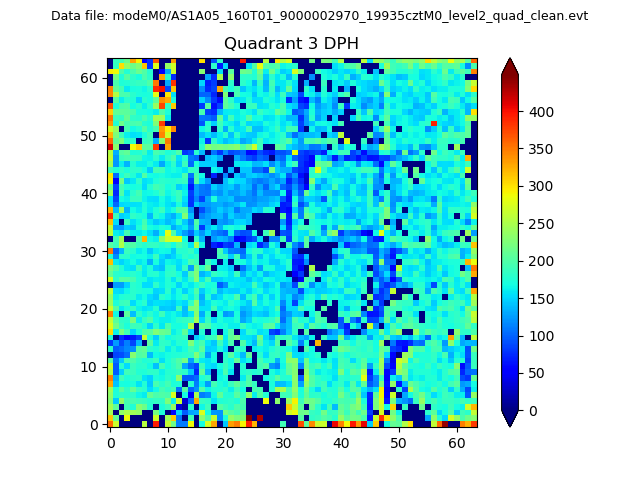 |
 |
Quadrant C |
| Plot type | Count rate plots | Images |
|---|---|---|
| Comparison with Poisson distribution Blue bars denote a histogram of data divided into 1 sec bins. Red curve is a Poisson curve with rate = median count rate of data. |
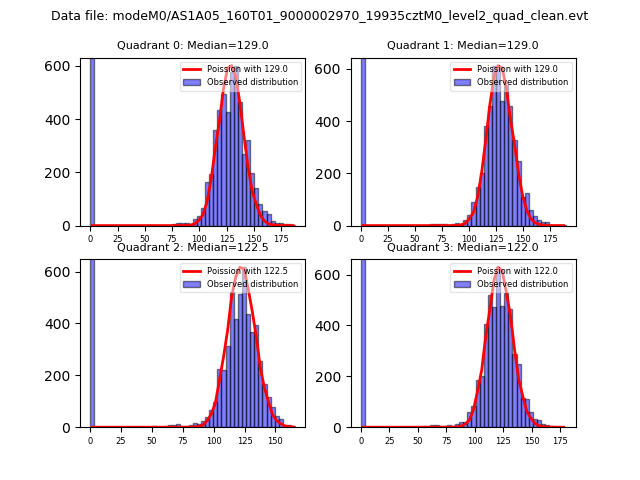 |
 |
| Quadrant-wise count rates Data is divided into 100 sec bins |
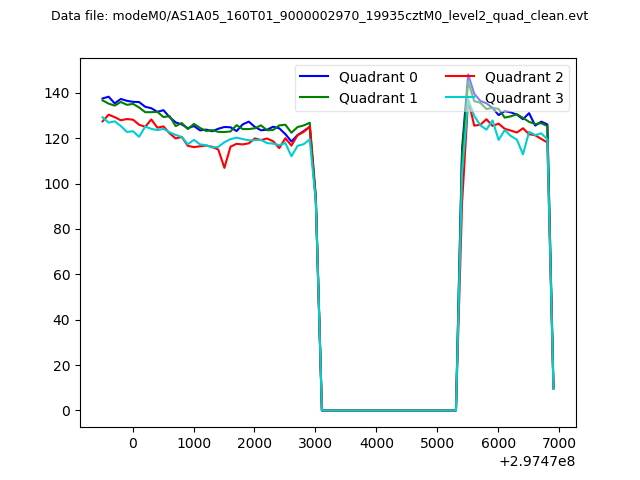 |
|
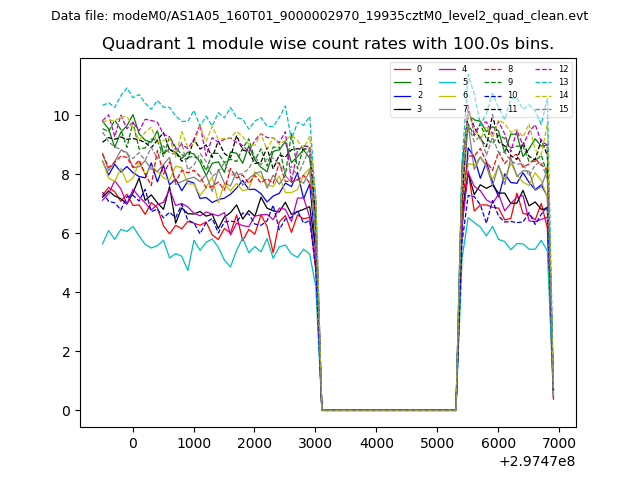
| Module-wise count rates for Quadrant A Data is divided into 100 sec bins |
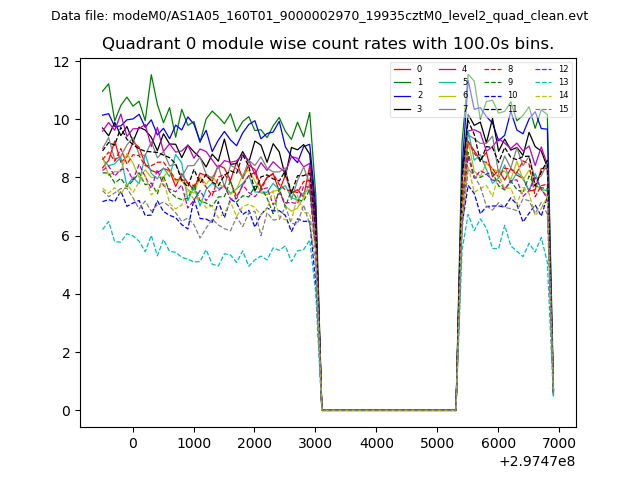 |
 |
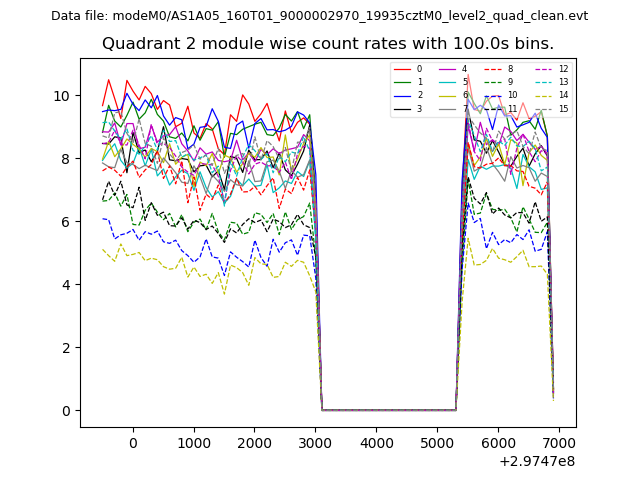
| Module-wise count rates for Quadrant B Data is divided into 100 sec bins |
 |
 |
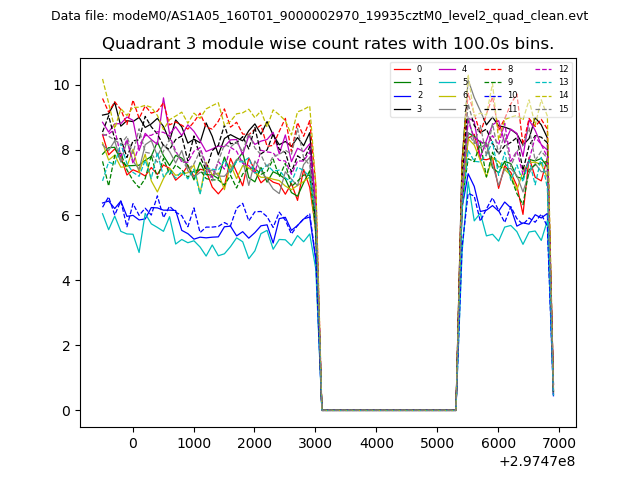
| Module-wise count rates for Quadrant C Data is divided into 100 sec bins |
 |
 |
| Module-wise count rates for Quadrant D Data is divided into 100 sec bins |
 |
 |
| Parameter | Plot |
|---|---|
| CZT HV Monitor | 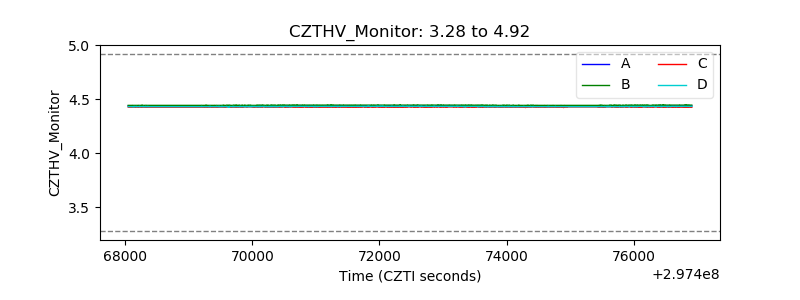 |
| D_VDD | 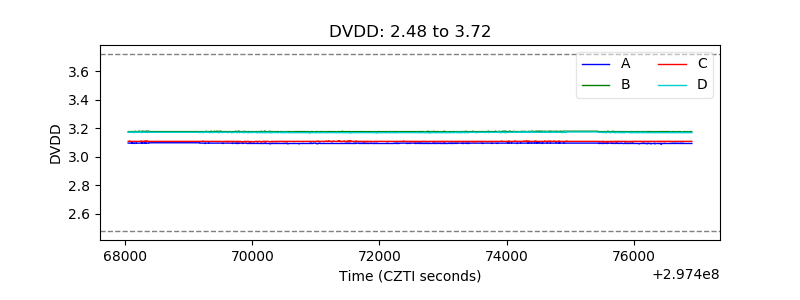 |
| Temperature 1 |  |
| Veto HV Monitor | 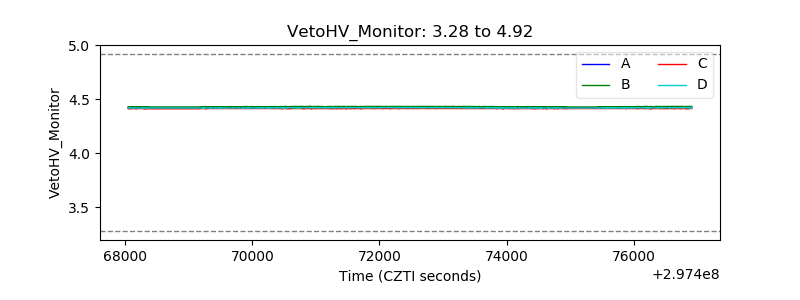 |
| Veto LLD | 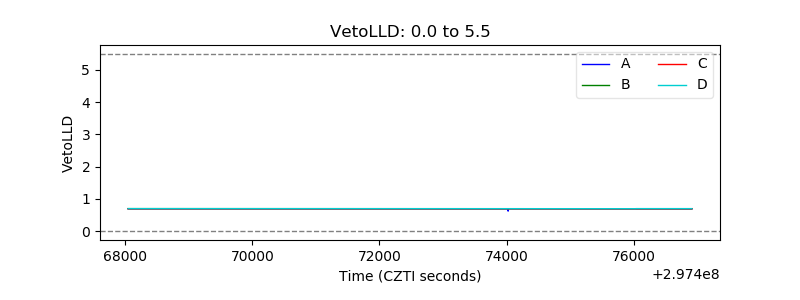 |
| Alpha Counter | 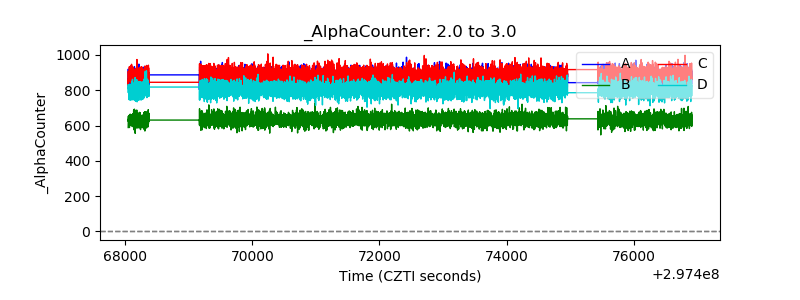 |
| _CPM_Rate | 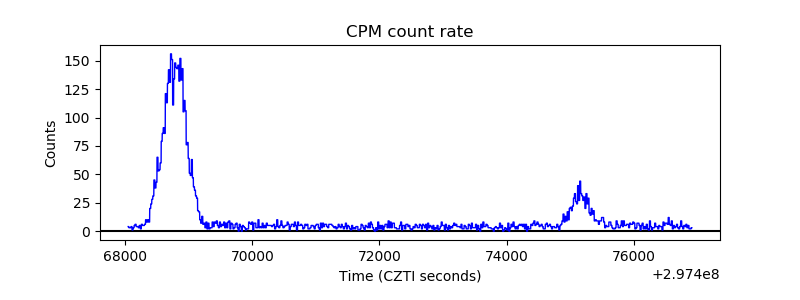 |
| CZT Counter | 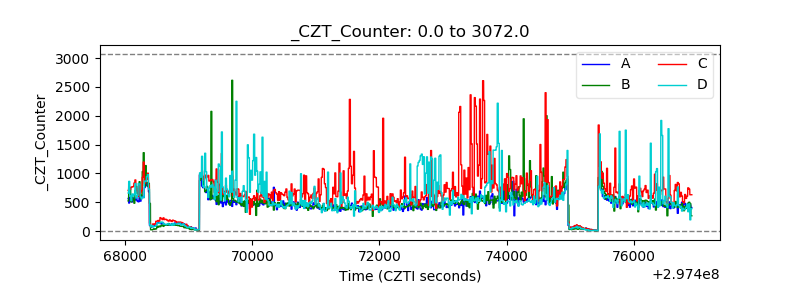 |
| +2.5 Volts monitor |  |
| +5 Volts monitor |  |
| _ROLL_ROT | 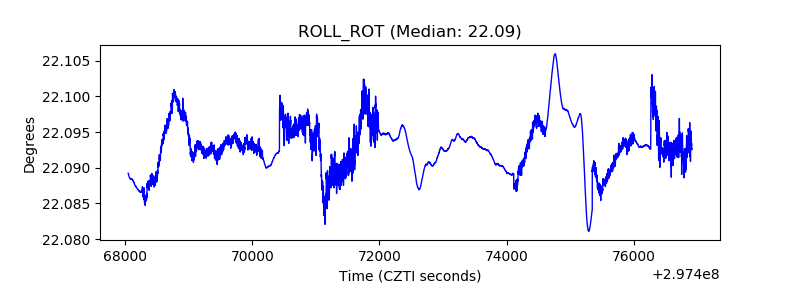 |
| _Roll_DEC | 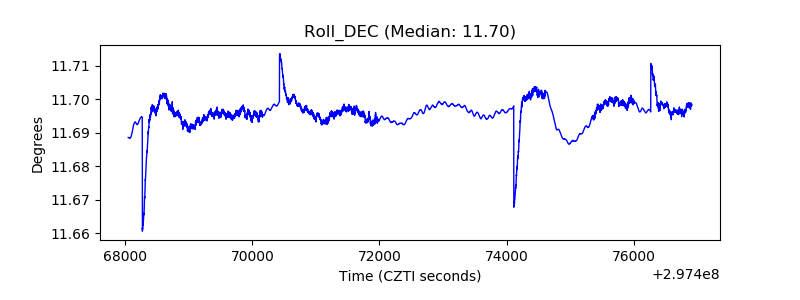 |
| _Roll_RA | 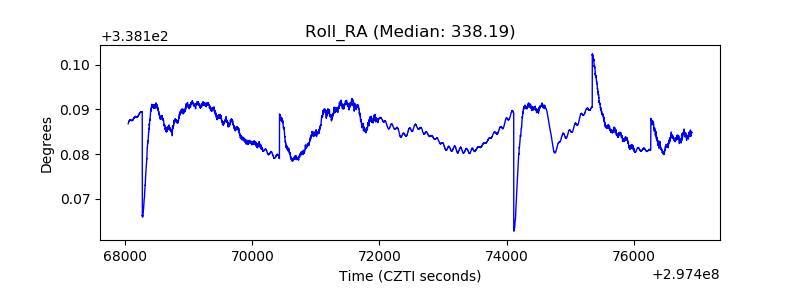 |
| Veto Counter | 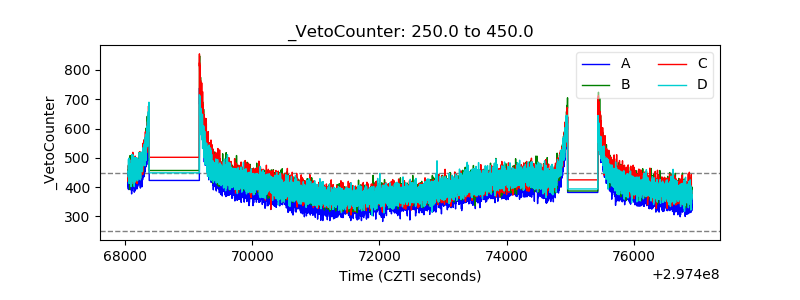 |