| Param | Original file | Final file |
|---|---|---|
| Filename | modeM0/AS1A05_160T01_9000002970_19937cztM0_level2.evt | modeM0/AS1A05_160T01_9000002970_19937cztM0_level2_quad_clean.evt |
| Size (bytes) | 691,200,000 | 104,869,440 |
| Size | 659.2 MB | 100.0 MB |
| Events in quadrant A | 3,771,083 | 702,129 |
| Events in quadrant B | 4,055,823 | 702,041 |
| Events in quadrant C | 8,337,121 | 557,381 |
| Events in quadrant D | 4,232,219 | 663,052 |
| Mode SS | |||
|---|---|---|---|
| Quadrant | BADHDUFLAG | Total packets | Discarded packets |
| A | 0 | 164 | 0 |
| B | 0 | 164 | 0 |
| C | 0 | 164 | 0 |
| D | 0 | 164 | 0 |
| Mode M0 | |||
|---|---|---|---|
| Quadrant | BADHDUFLAG | Total packets | Discarded packets |
| A | 0 | 16576 | 2 |
| B | 0 | 17392 | 2 |
| C | 0 | 30290 | 2 |
| D | 0 | 18059 | 2 |
| Mode M9 | |||
|---|---|---|---|
| Quadrant | BADHDUFLAG | Total packets | Discarded packets |
| A | 0 | 6 | 0 |
| B | 0 | 6 | 0 |
| C | 0 | 6 | 0 |
| D | 0 | 6 | 0 |
| Quadrant | Total seconds | Saturated seconds | Saturation percentage |
|---|---|---|---|
| A | 7912 | 77 | 0.973205% |
| B | 7913 | 163 | 2.059901% |
| C | 7913 | 2172 | 27.448502% |
| D | 7913 | 158 | 1.996714% |
Noise dominated data is calculated using 1-second bins in cleaned event files. If a bin has >2000 counts, and if more than 50% of those come from <1% of pixels, then it is considered to be noise-dominated and hence unusable.
| Quadrant | # 1 sec bins | Bins with >0 counts | Bins with >2000 counts | High rate bins dominated by noise | Noise dominated (total time) | Noise dominated (detector-on time) | Marked lightcurve |
|---|---|---|---|---|---|---|---|
| A | 8567 | 7913 | 0 | 0 | 0.00% | 0.00% | 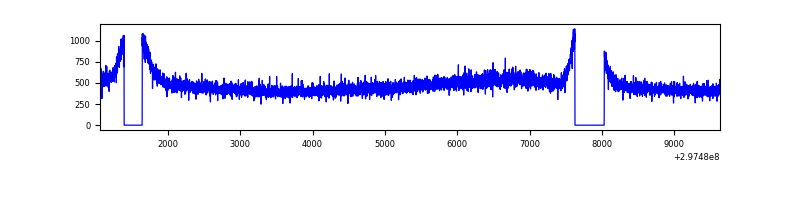 |
| B | 8568 | 7913 | 10 | 10 | 0.12% | 0.13% | 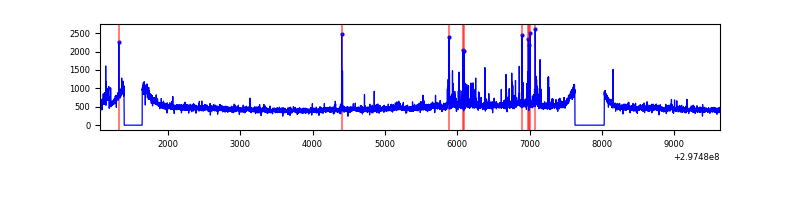 |
| C | 8568 | 7913 | 1074 | 1074 | 12.54% | 13.57% | 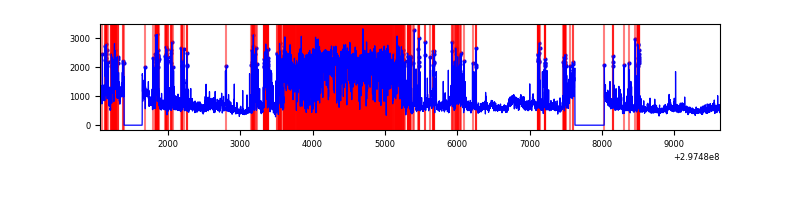 |
| D | 8568 | 7915 | 117 | 117 | 1.37% | 1.48% | 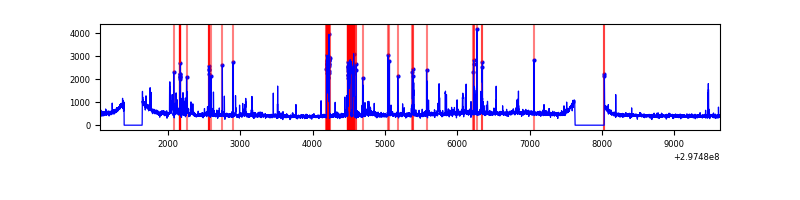 |
Top three noisy pixels from each quadrant. If the there are fewer than three noisy pixels in the level2.evt file, extra rows are filled as -1
| Pixel properties | Quadrant properties | ||||||
|---|---|---|---|---|---|---|---|
| Quadrant | DetID | PixID | Counts | Sigma | Mean | Median | Sigma |
| A | 3 | 1 | 13672 | 63.24 | 976 | 955 | 201.1 |
| A | 0 | 226 | 8316 | 36.61 | 976 | 955 | 201.1 |
| A | 3 | 137 | 7866 | 34.37 | 976 | 955 | 201.1 |
| B | 7 | 220 | 93096 | 490.17 | 973 | 949 | 188.0 |
| B | 0 | 197 | 43259 | 225.07 | 973 | 949 | 188.0 |
| B | 0 | 189 | 31112 | 160.45 | 973 | 949 | 188.0 |
| C | 4 | 254 | 3992199 | 20898.08 | 804 | 809 | 191.0 |
| C | 3 | 233 | 929786 | 4863.93 | 804 | 809 | 191.0 |
| C | 14 | 238 | 121610 | 632.49 | 804 | 809 | 191.0 |
| D | 1 | 52 | 591276 | 2534.15 | 947 | 920 | 233.0 |
| D | 2 | 234 | 38488 | 161.26 | 947 | 920 | 233.0 |
| D | 12 | 1 | 18294 | 74.58 | 947 | 920 | 233.0 |
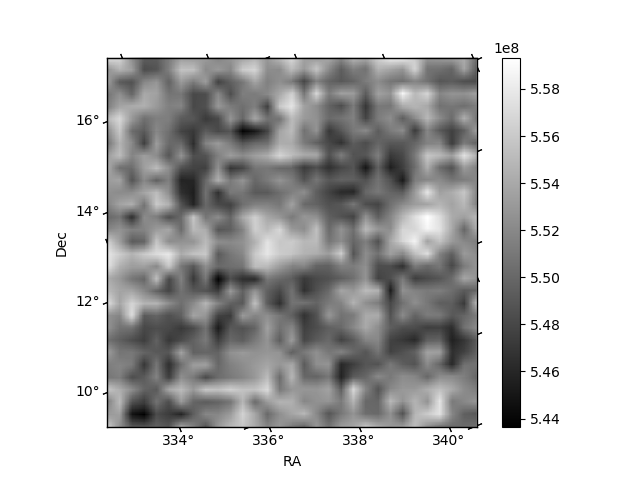
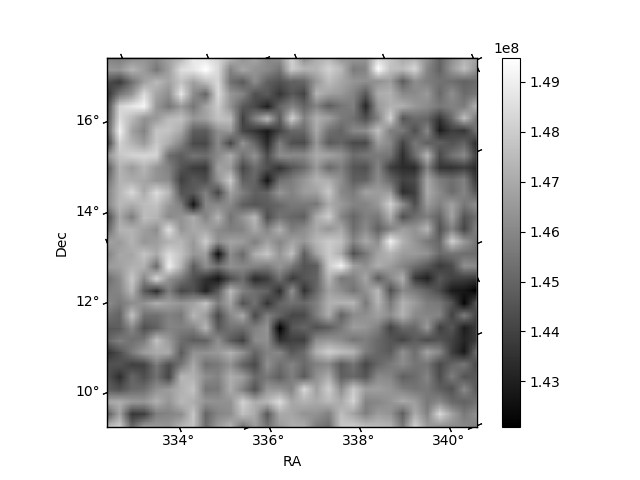
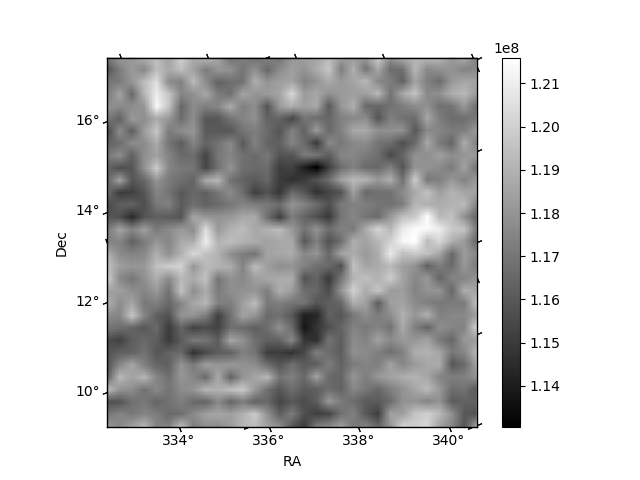
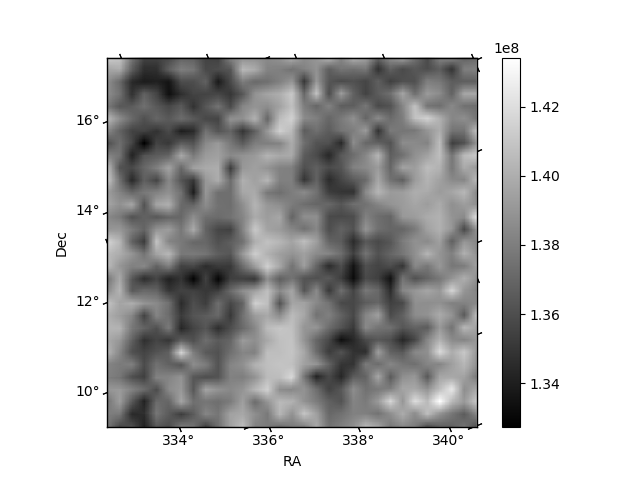
Histogram calculated using DETX and DETY for each event in the final _common_clean file
| Quadrant A | 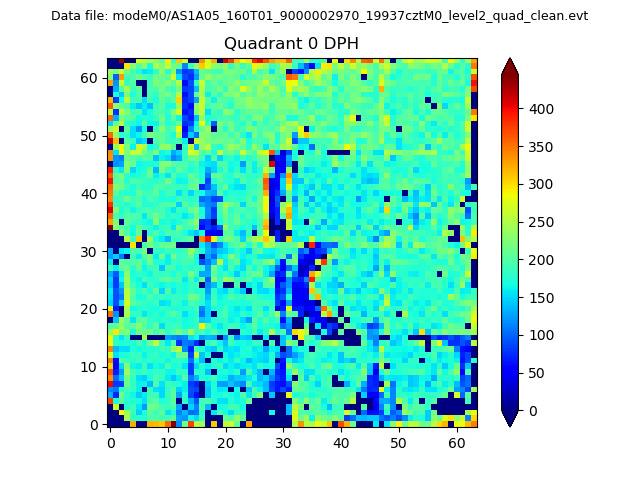 |
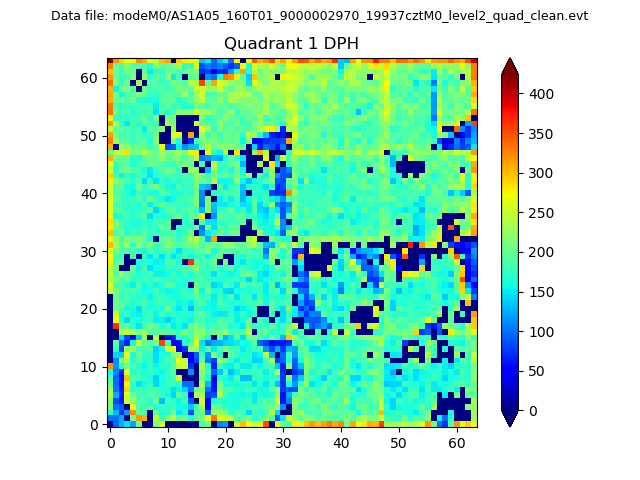 |
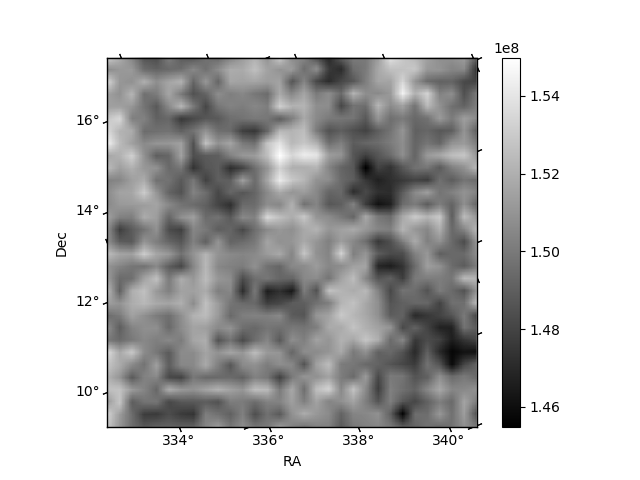
Quadrant B |
|---|---|---|---|
| Quadrant D | 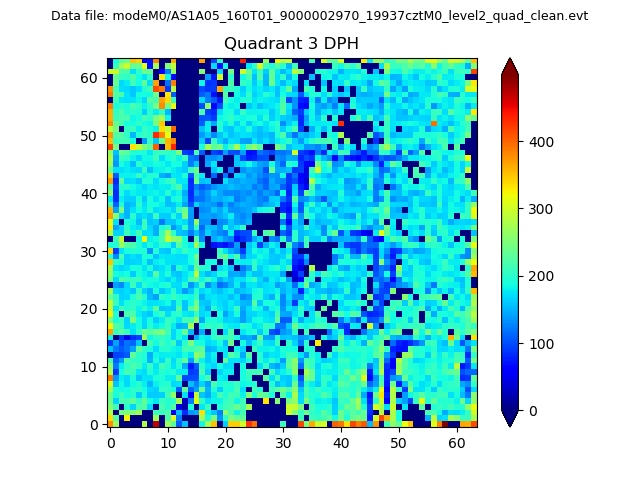 |
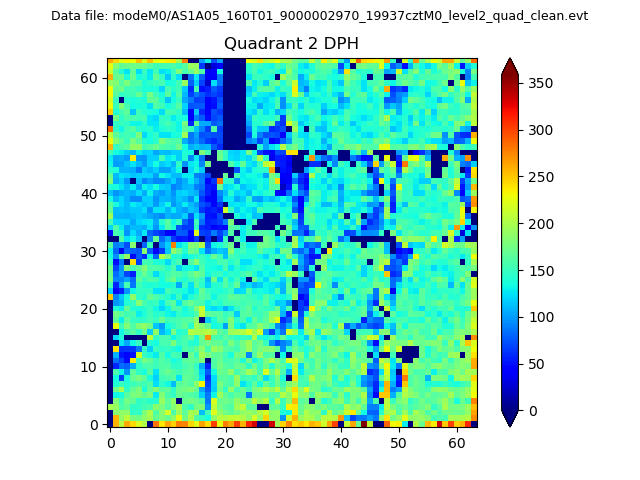 |
Quadrant C |
| Plot type | Count rate plots | Images |
|---|---|---|
| Comparison with Poisson distribution Blue bars denote a histogram of data divided into 1 sec bins. Red curve is a Poisson curve with rate = median count rate of data. |
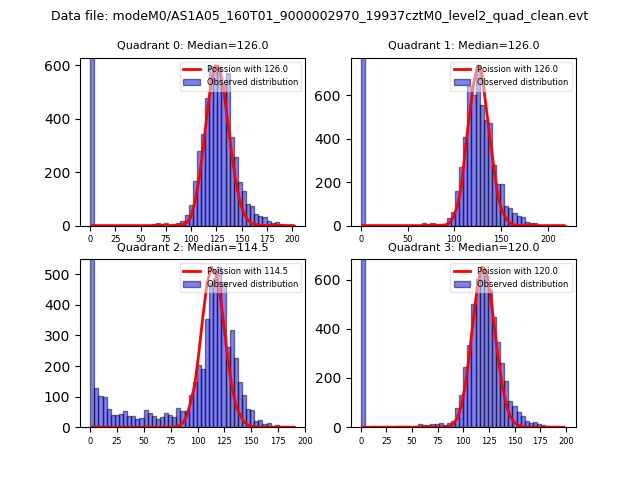 |
 |
| Quadrant-wise count rates Data is divided into 100 sec bins |
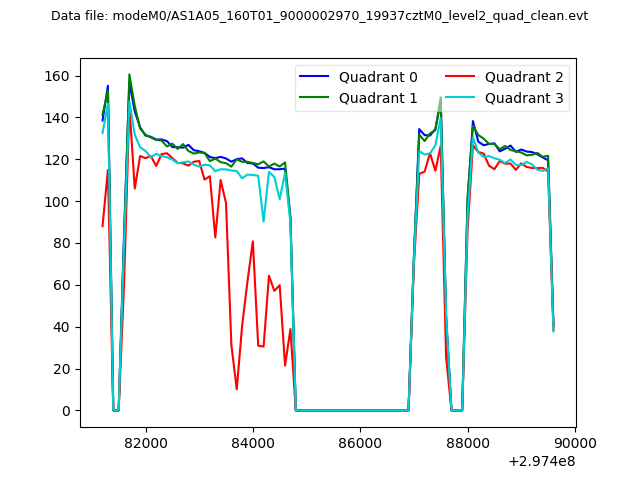 |
|
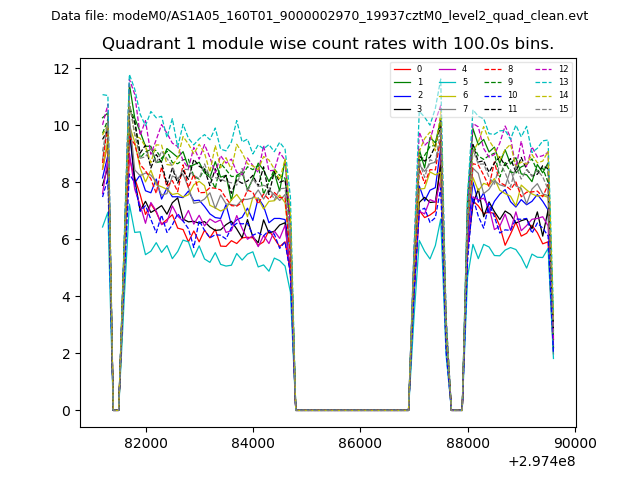
| Module-wise count rates for Quadrant A Data is divided into 100 sec bins |
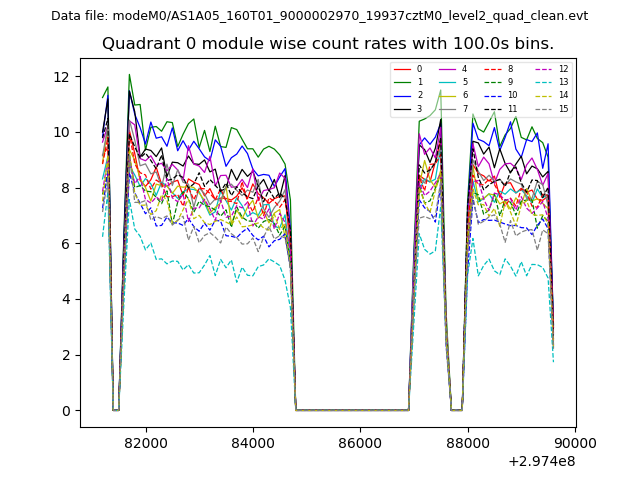 |
 |
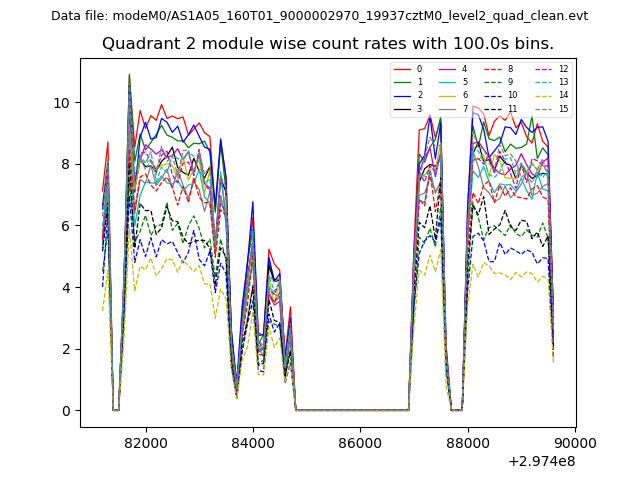
| Module-wise count rates for Quadrant B Data is divided into 100 sec bins |
 |
 |
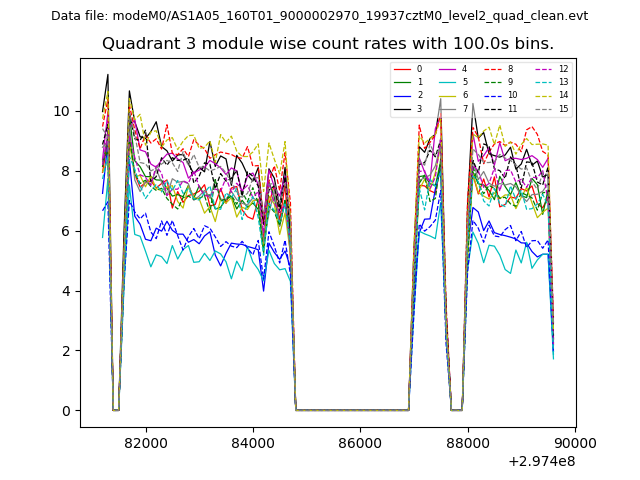
| Module-wise count rates for Quadrant C Data is divided into 100 sec bins |
 |
 |
| Module-wise count rates for Quadrant D Data is divided into 100 sec bins |
 |
 |
| Parameter | Plot |
|---|---|
| CZT HV Monitor | 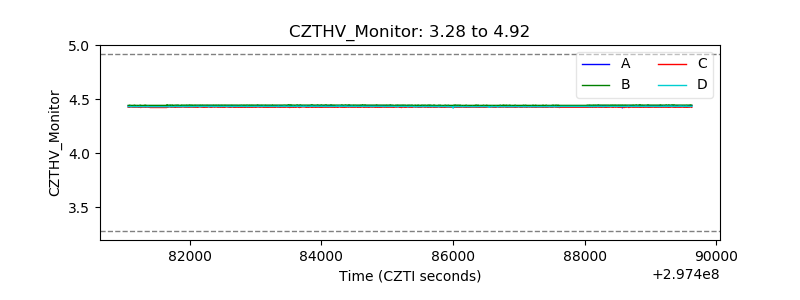 |
| D_VDD | 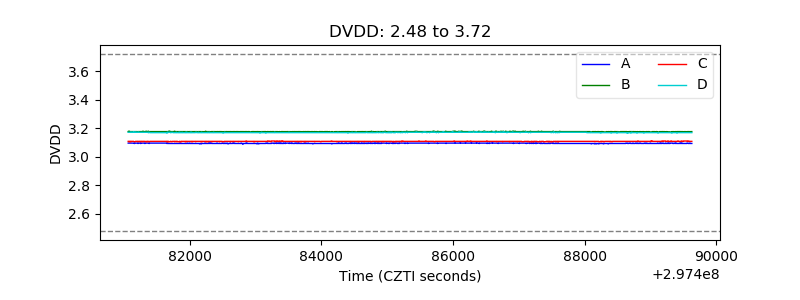 |
| Temperature 1 | 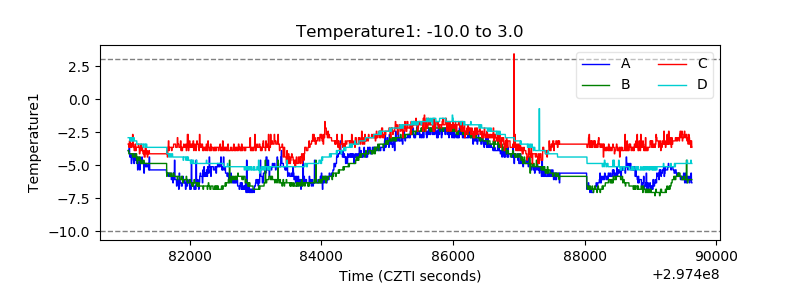 |
| Veto HV Monitor | 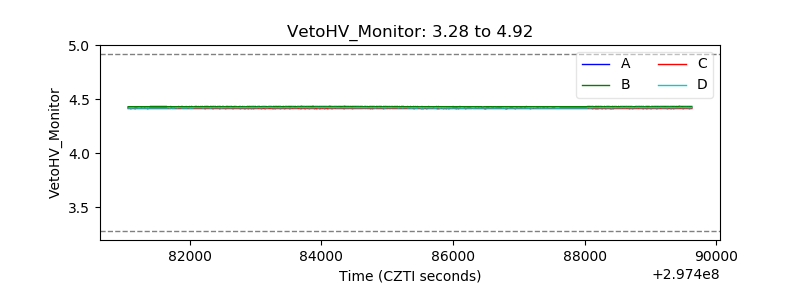 |
| Veto LLD | 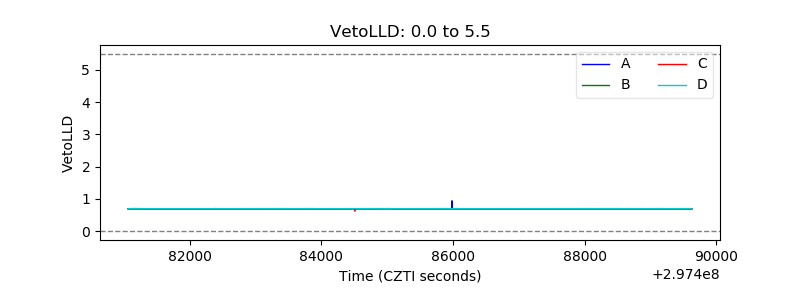 |
| Alpha Counter | 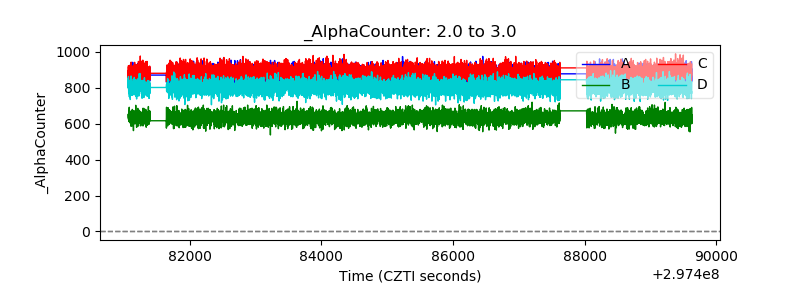 |
| _CPM_Rate | 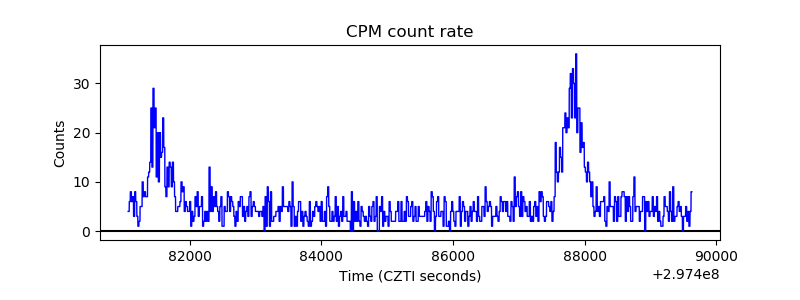 |
| CZT Counter | 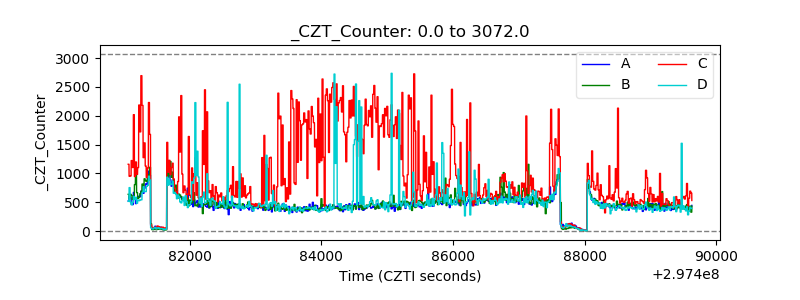 |
| +2.5 Volts monitor |  |
| +5 Volts monitor |  |
| _ROLL_ROT | 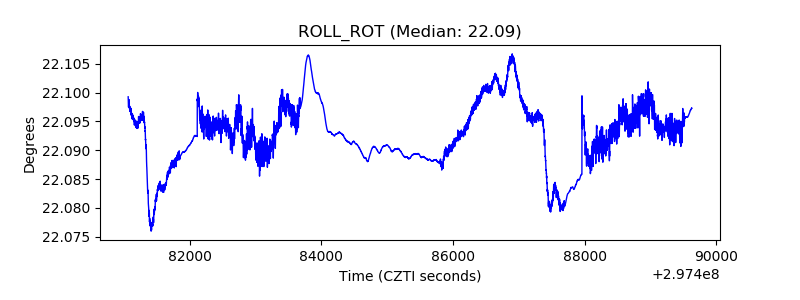 |
| _Roll_DEC |  |
| _Roll_RA | 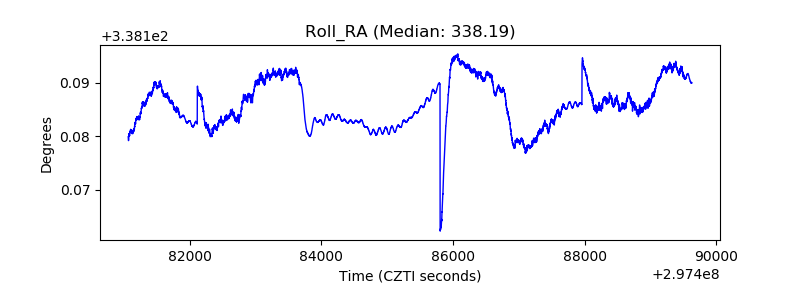 |
| Veto Counter | 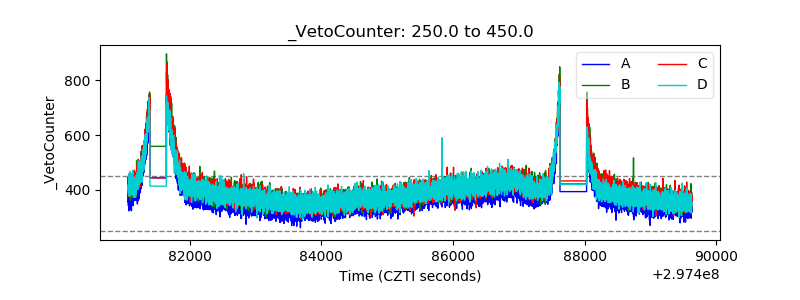 |