| Param | Original file | Final file |
|---|---|---|
| Filename | modeM0/AS1A05_160T01_9000002970_19939cztM0_level2.evt | modeM0/AS1A05_160T01_9000002970_19939cztM0_level2_quad_clean.evt |
| Size (bytes) | 851,230,080 | 159,344,640 |
| Size | 811.8 MB | 152.0 MB |
| Events in quadrant A | 5,782,371 | 1,013,326 |
| Events in quadrant B | 6,013,370 | 1,015,808 |
| Events in quadrant C | 7,302,858 | 965,936 |
| Events in quadrant D | 5,831,365 | 963,510 |
| Mode SS | |||
|---|---|---|---|
| Quadrant | BADHDUFLAG | Total packets | Discarded packets |
| A | 0 | 256 | 0 |
| B | 0 | 256 | 0 |
| C | 0 | 256 | 0 |
| D | 0 | 256 | 0 |
| Mode M0 | |||
|---|---|---|---|
| Quadrant | BADHDUFLAG | Total packets | Discarded packets |
| A | 0 | 25484 | 2 |
| B | 0 | 26003 | 2 |
| C | 0 | 29969 | 2 |
| D | 0 | 26034 | 2 |
| Mode M9 | |||
|---|---|---|---|
| Quadrant | BADHDUFLAG | Total packets | Discarded packets |
| A | 0 | 13 | 0 |
| B | 0 | 13 | 0 |
| C | 0 | 13 | 0 |
| D | 0 | 13 | 0 |
| Quadrant | Total seconds | Saturated seconds | Saturation percentage |
|---|---|---|---|
| A | 12542 | 75 | 0.597991% |
| B | 12542 | 102 | 0.813267% |
| C | 12543 | 215 | 1.714103% |
| D | 12543 | 48 | 0.382684% |
Noise dominated data is calculated using 1-second bins in cleaned event files. If a bin has >2000 counts, and if more than 50% of those come from <1% of pixels, then it is considered to be noise-dominated and hence unusable.
| Quadrant | # 1 sec bins | Bins with >0 counts | Bins with >2000 counts | High rate bins dominated by noise | Noise dominated (total time) | Noise dominated (detector-on time) | Marked lightcurve |
|---|---|---|---|---|---|---|---|
| A | 13812 | 12542 | 0 | 0 | 0.00% | 0.00% | 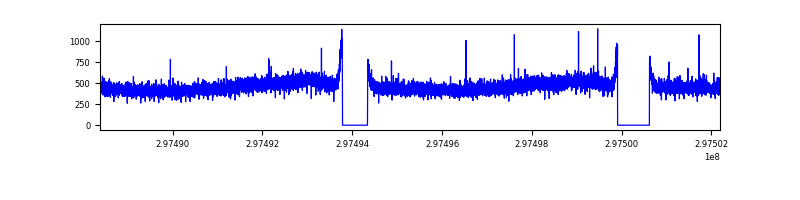 |
| B | 13812 | 12542 | 8 | 8 | 0.06% | 0.06% | 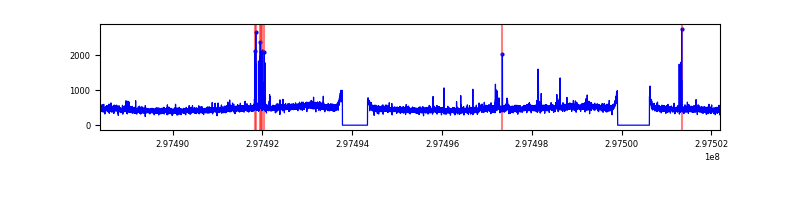 |
| C | 13813 | 12543 | 15 | 15 | 0.11% | 0.12% |  |
| D | 13813 | 12545 | 8 | 8 | 0.06% | 0.06% | 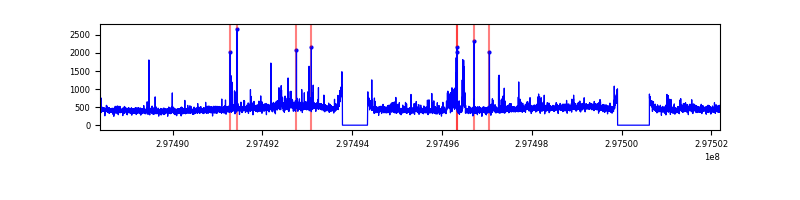 |
Top three noisy pixels from each quadrant. If the there are fewer than three noisy pixels in the level2.evt file, extra rows are filled as -1
| Pixel properties | Quadrant properties | ||||||
|---|---|---|---|---|---|---|---|
| Quadrant | DetID | PixID | Counts | Sigma | Mean | Median | Sigma |
| A | 15 | 191 | 15647 | 47.03 | 1496 | 1464 | 301.6 |
| A | 0 | 226 | 12948 | 38.08 | 1496 | 1464 | 301.6 |
| A | 3 | 137 | 12130 | 35.37 | 1496 | 1464 | 301.6 |
| B | 7 | 220 | 57753 | 197.69 | 1487 | 1449 | 284.8 |
| B | 12 | 111 | 35434 | 119.33 | 1487 | 1449 | 284.8 |
| B | 10 | 247 | 31050 | 103.93 | 1487 | 1449 | 284.8 |
| C | 3 | 233 | 1125853 | 3364.76 | 1426 | 1436 | 334.2 |
| C | 9 | 221 | 274752 | 817.88 | 1426 | 1436 | 334.2 |
| C | 14 | 238 | 219909 | 653.77 | 1426 | 1436 | 334.2 |
| D | 7 | 238 | 122745 | 339.2 | 1457 | 1408 | 357.7 |
| D | 7 | 96 | 75226 | 206.36 | 1457 | 1408 | 357.7 |
| D | 1 | 52 | 71351 | 195.53 | 1457 | 1408 | 357.7 |
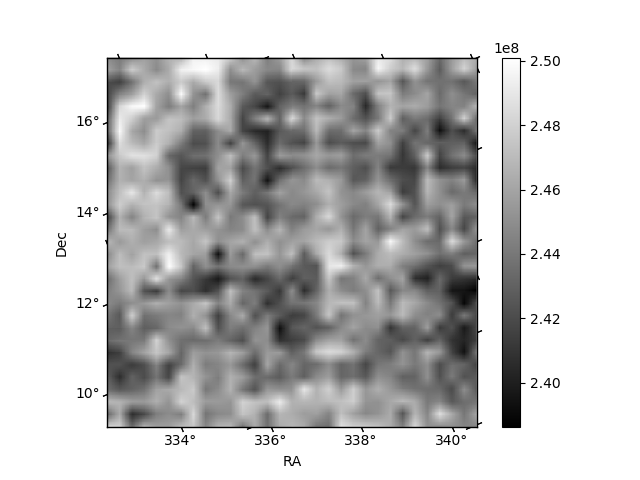
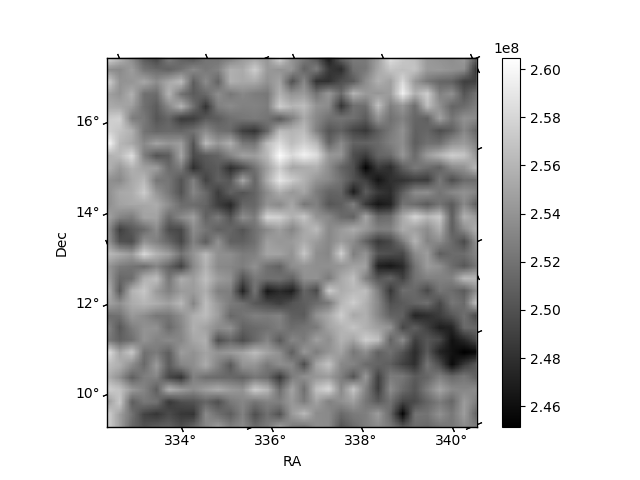
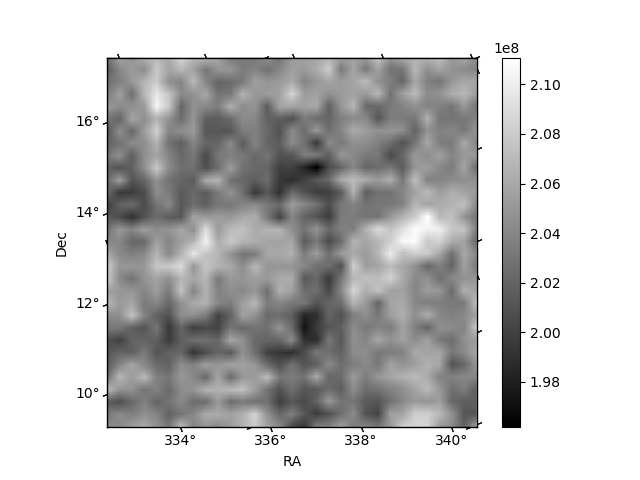
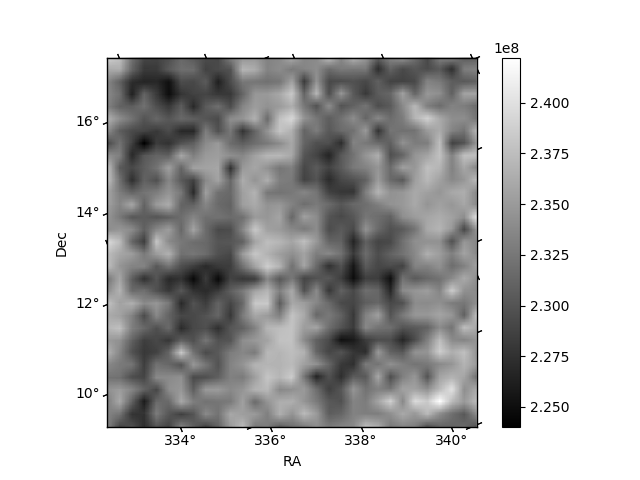
Histogram calculated using DETX and DETY for each event in the final _common_clean file
| Quadrant A | 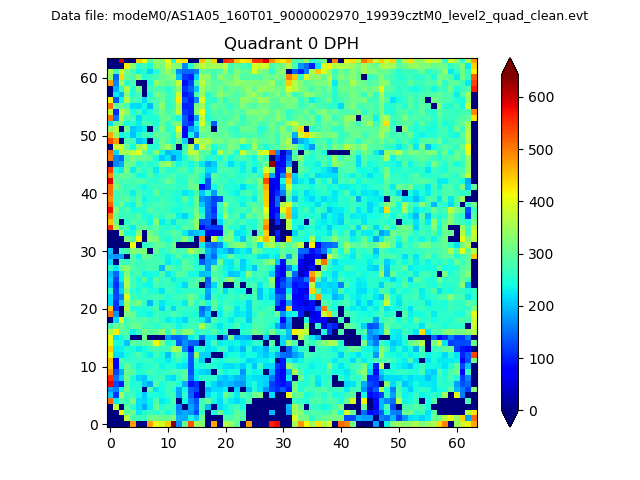 |
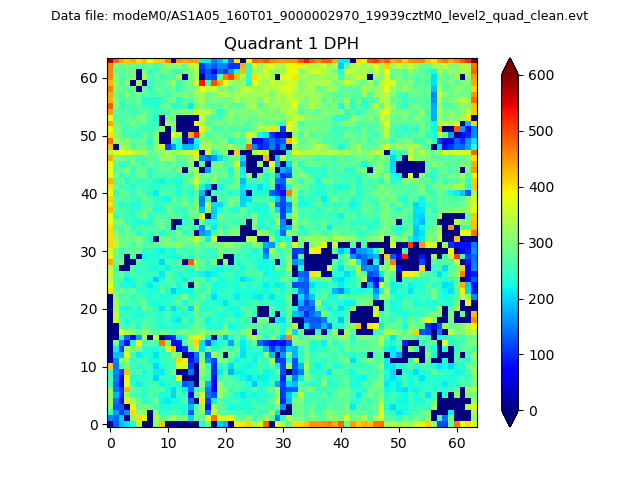 |
Quadrant B |
|---|---|---|---|
| Quadrant D | 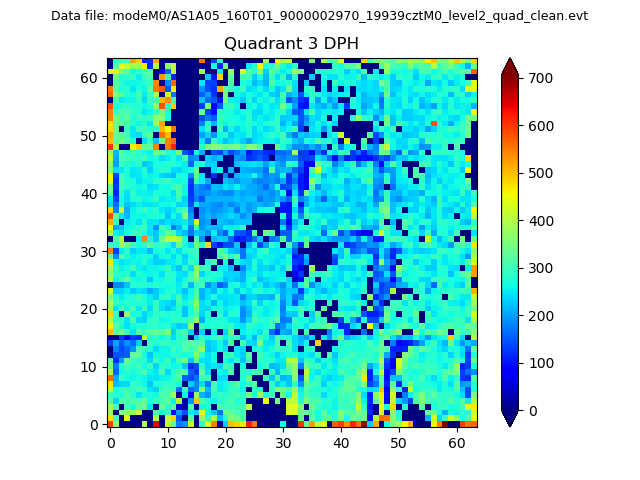 |
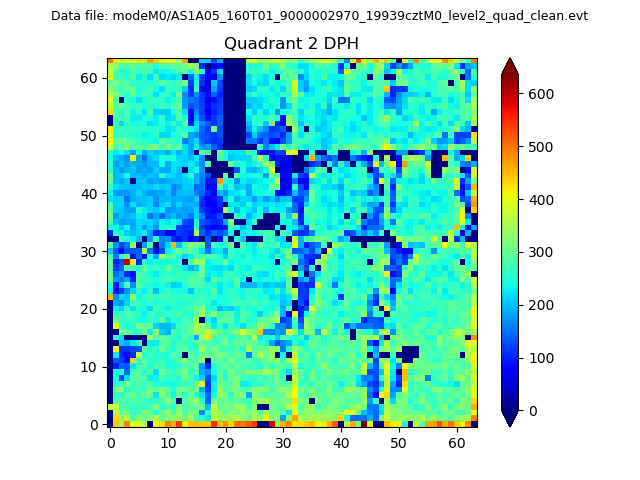 |
Quadrant C |
| Plot type | Count rate plots | Images |
|---|---|---|
| Comparison with Poisson distribution Blue bars denote a histogram of data divided into 1 sec bins. Red curve is a Poisson curve with rate = median count rate of data. |
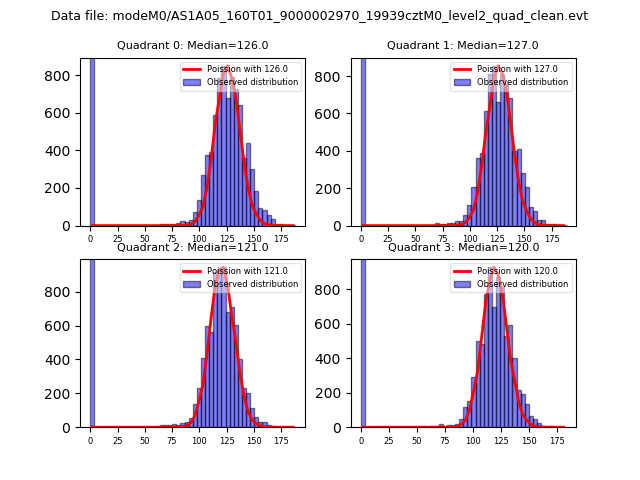 |
 |
| Quadrant-wise count rates Data is divided into 100 sec bins |
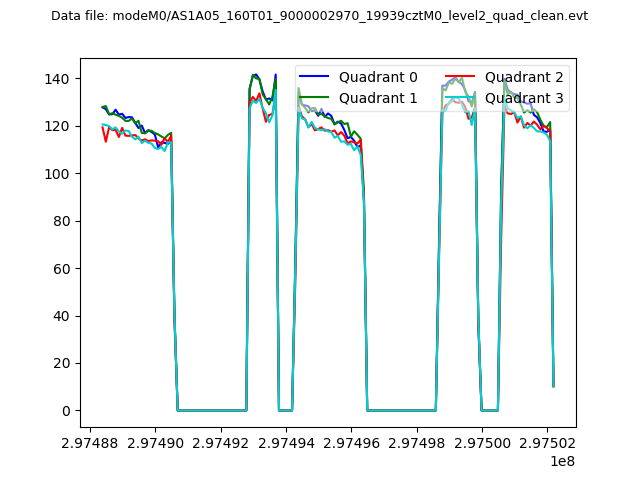 |
|
| Module-wise count rates for Quadrant A Data is divided into 100 sec bins |
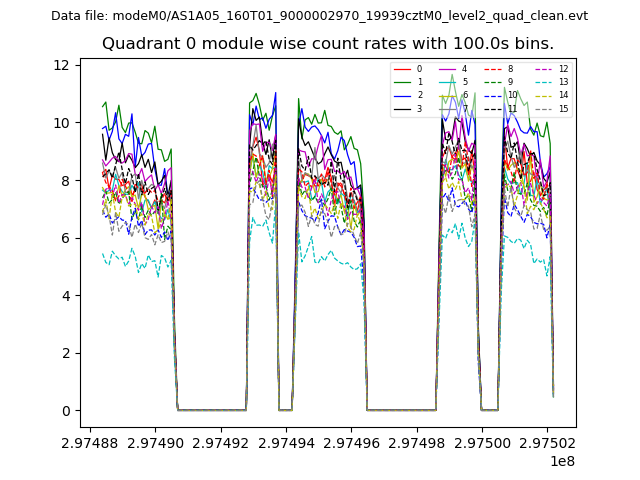 |
 |
| Module-wise count rates for Quadrant B Data is divided into 100 sec bins |
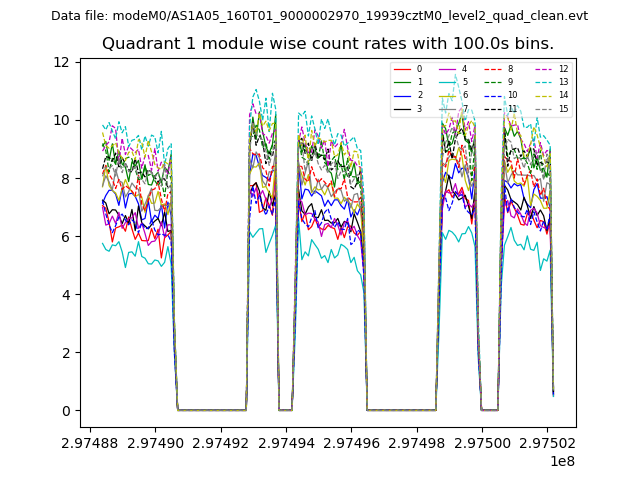 |
 |
| Module-wise count rates for Quadrant C Data is divided into 100 sec bins |
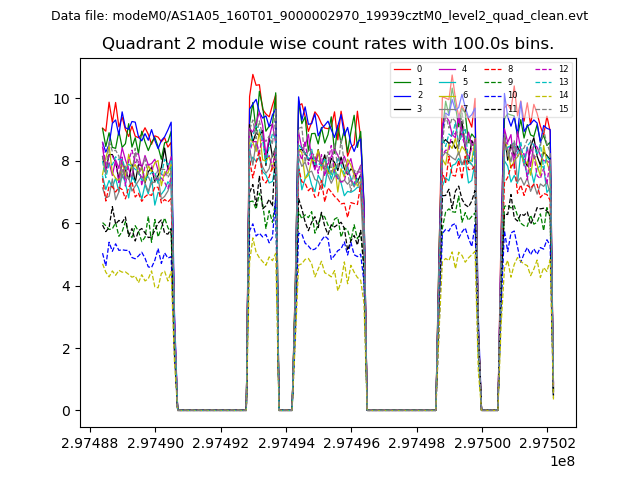 |
 |
| Module-wise count rates for Quadrant D Data is divided into 100 sec bins |
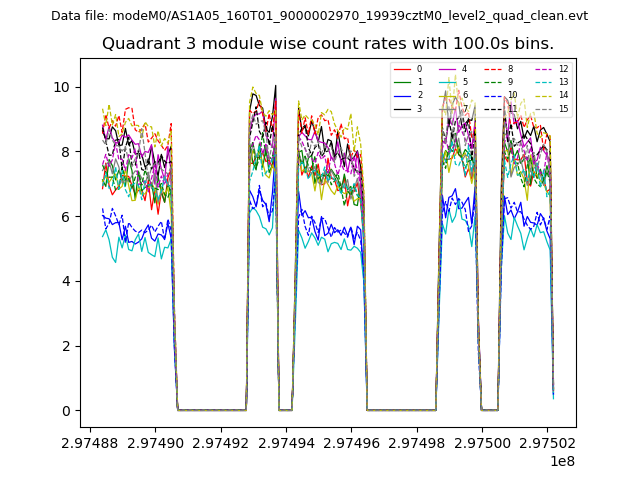 |
 |
| Parameter | Plot |
|---|---|
| CZT HV Monitor | 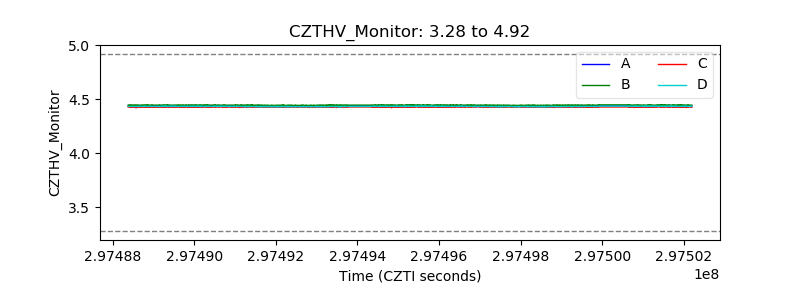 |
| D_VDD | 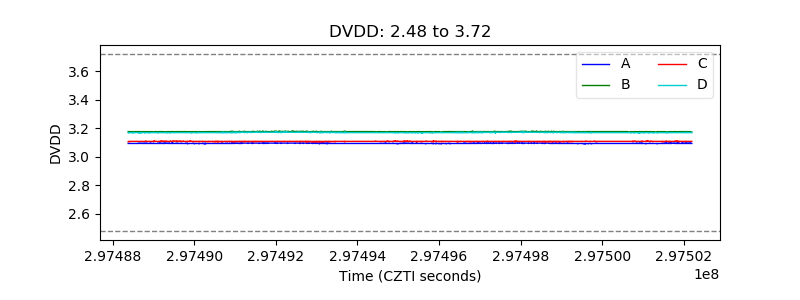 |
| Temperature 1 |  |
| Veto HV Monitor | 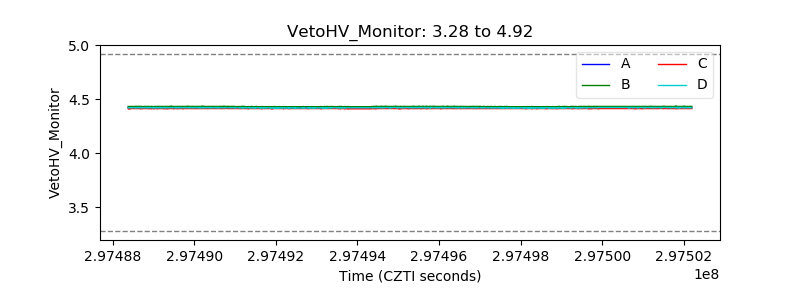 |
| Veto LLD | 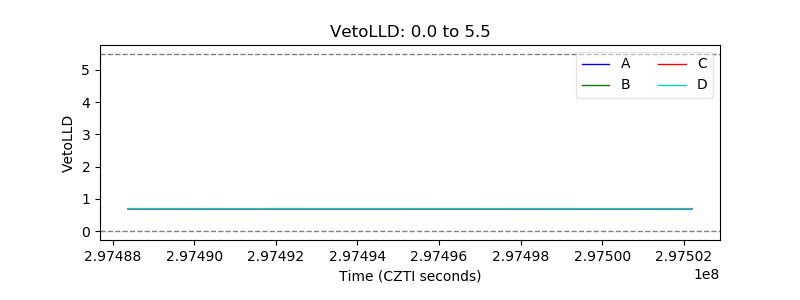 |
| Alpha Counter | 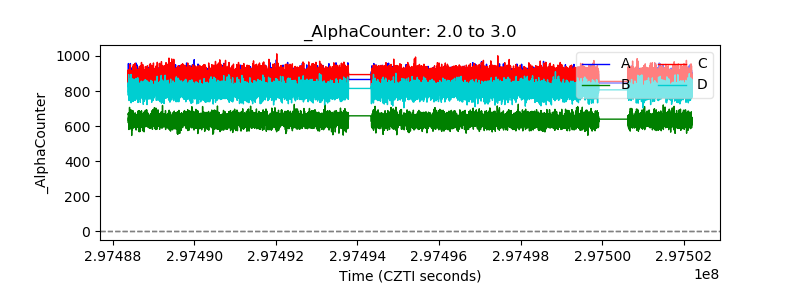 |
| _CPM_Rate | 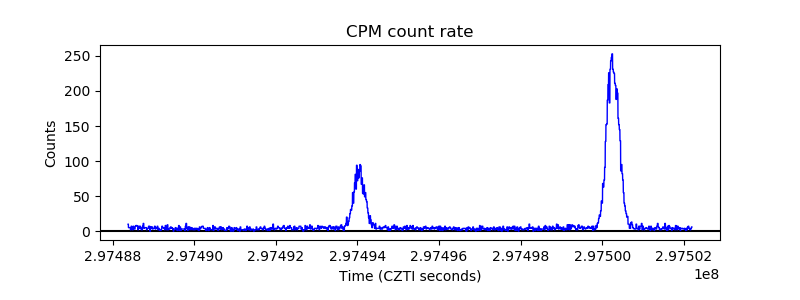 |
| CZT Counter | 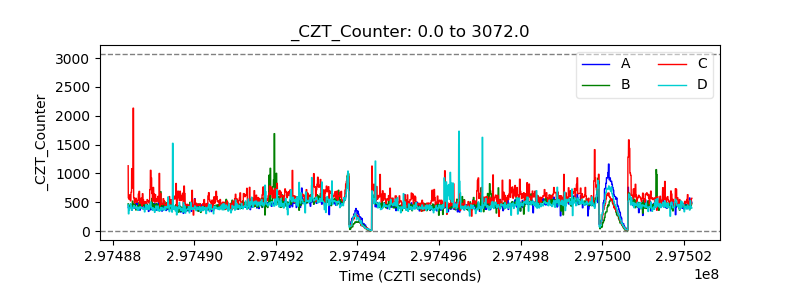 |
| +2.5 Volts monitor | 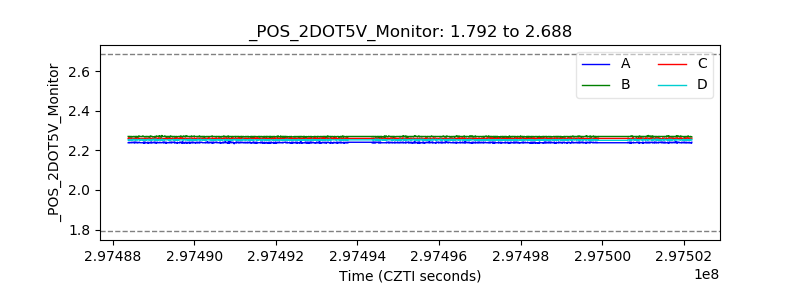 |
| +5 Volts monitor | 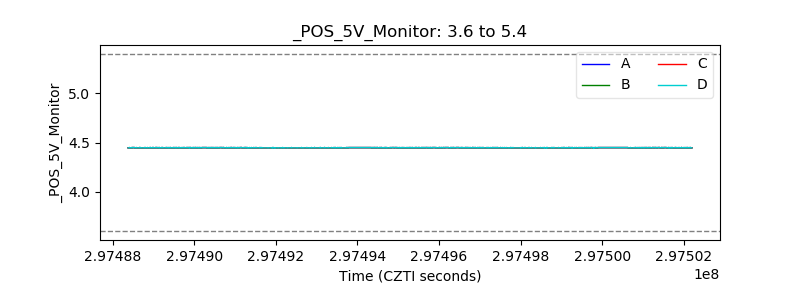 |
| _ROLL_ROT | 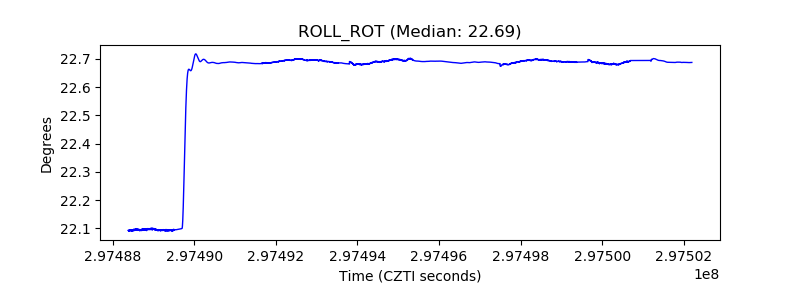 |
| _Roll_DEC | 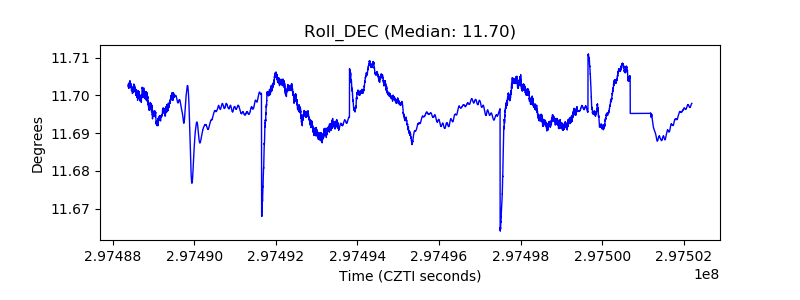 |
| _Roll_RA | 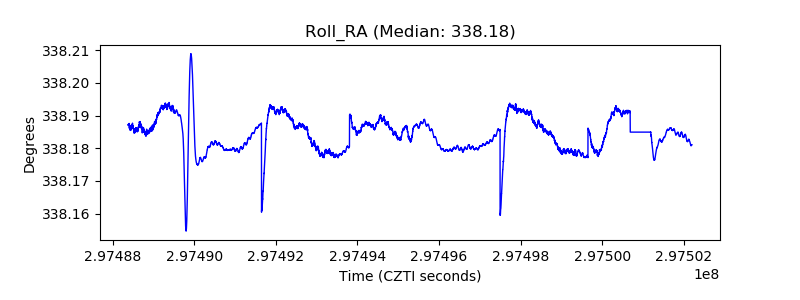 |
| Veto Counter | 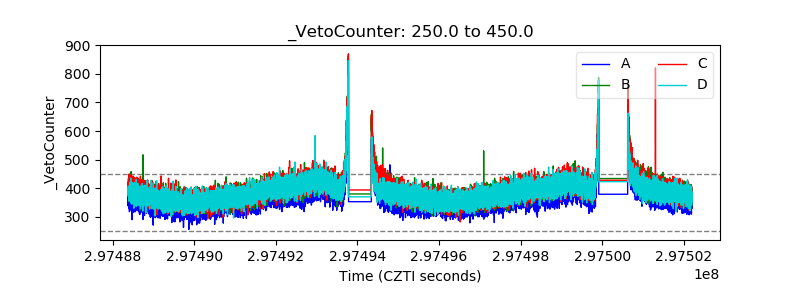 |