| Param | Original file | Final file |
|---|---|---|
| Filename | modeM0/AS1A05_160T01_9000002970_19940cztM0_level2.evt | modeM0/AS1A05_160T01_9000002970_19940cztM0_level2_quad_clean.evt |
| Size (bytes) | 456,995,520 | 83,465,280 |
| Size | 435.8 MB | 79.6 MB |
| Events in quadrant A | 3,110,172 | 531,829 |
| Events in quadrant B | 3,269,773 | 532,112 |
| Events in quadrant C | 3,612,634 | 506,747 |
| Events in quadrant D | 3,400,074 | 497,552 |
| Mode SS | |||
|---|---|---|---|
| Quadrant | BADHDUFLAG | Total packets | Discarded packets |
| A | 0 | 132 | 0 |
| B | 0 | 132 | 0 |
| C | 0 | 132 | 0 |
| D | 0 | 132 | 0 |
| Mode M0 | |||
|---|---|---|---|
| Quadrant | BADHDUFLAG | Total packets | Discarded packets |
| A | 0 | 13392 | 1 |
| B | 0 | 13736 | 2 |
| C | 0 | 14662 | 1 |
| D | 0 | 14503 | 1 |
| Mode M9 | |||
|---|---|---|---|
| Quadrant | BADHDUFLAG | Total packets | Discarded packets |
| A | 0 | 9 | 0 |
| B | 0 | 9 | 0 |
| C | 0 | 9 | 0 |
| D | 0 | 9 | 0 |
| Quadrant | Total seconds | Saturated seconds | Saturation percentage |
|---|---|---|---|
| A | 6589 | 80 | 1.214145% |
| B | 6589 | 92 | 1.396267% |
| C | 6589 | 88 | 1.335559% |
| D | 6589 | 157 | 2.382759% |
Noise dominated data is calculated using 1-second bins in cleaned event files. If a bin has >2000 counts, and if more than 50% of those come from <1% of pixels, then it is considered to be noise-dominated and hence unusable.
| Quadrant | # 1 sec bins | Bins with >0 counts | Bins with >2000 counts | High rate bins dominated by noise | Noise dominated (total time) | Noise dominated (detector-on time) | Marked lightcurve |
|---|---|---|---|---|---|---|---|
| A | 7429 | 6589 | 0 | 0 | 0.00% | 0.00% | 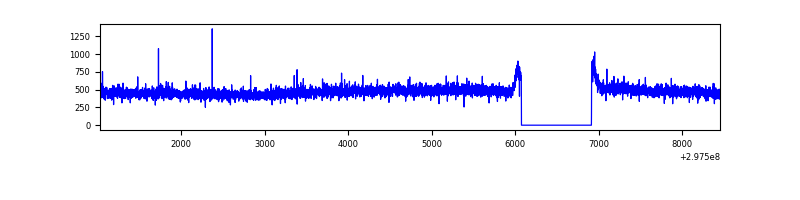 |
| B | 7429 | 6589 | 7 | 7 | 0.09% | 0.11% | 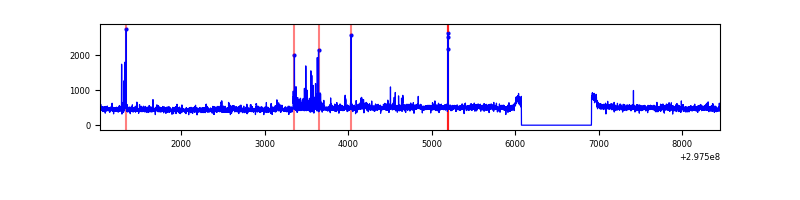 |
| C | 7429 | 6589 | 2 | 2 | 0.03% | 0.03% | 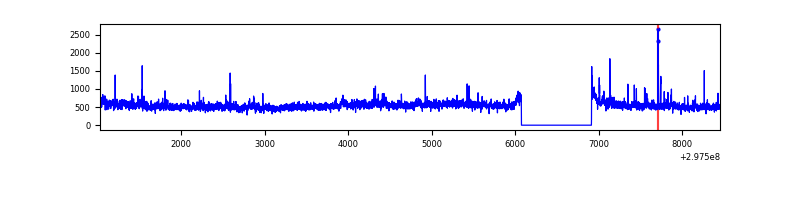 |
| D | 7429 | 6589 | 98 | 98 | 1.32% | 1.49% | 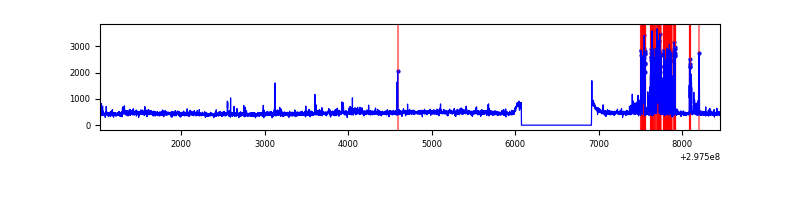 |
Top three noisy pixels from each quadrant. If the there are fewer than three noisy pixels in the level2.evt file, extra rows are filled as -1
| Pixel properties | Quadrant properties | ||||||
|---|---|---|---|---|---|---|---|
| Quadrant | DetID | PixID | Counts | Sigma | Mean | Median | Sigma |
| A | 14 | 238 | 15500 | 91.2 | 804 | 788 | 161.3 |
| A | 0 | 226 | 6677 | 36.5 | 804 | 788 | 161.3 |
| A | 3 | 137 | 6501 | 35.41 | 804 | 788 | 161.3 |
| B | 7 | 220 | 55506 | 360.66 | 793 | 774 | 151.8 |
| B | 0 | 189 | 31774 | 204.28 | 793 | 774 | 151.8 |
| B | 10 | 247 | 24951 | 159.32 | 793 | 774 | 151.8 |
| C | 3 | 233 | 418538 | 2336.9 | 761 | 767 | 178.8 |
| C | 14 | 238 | 116475 | 647.24 | 761 | 767 | 178.8 |
| C | 9 | 221 | 101221 | 561.91 | 761 | 767 | 178.8 |
| D | 1 | 52 | 378766 | 1998.17 | 774 | 751 | 189.2 |
| D | 12 | 254 | 34848 | 180.24 | 774 | 751 | 189.2 |
| D | 7 | 238 | 32563 | 168.16 | 774 | 751 | 189.2 |
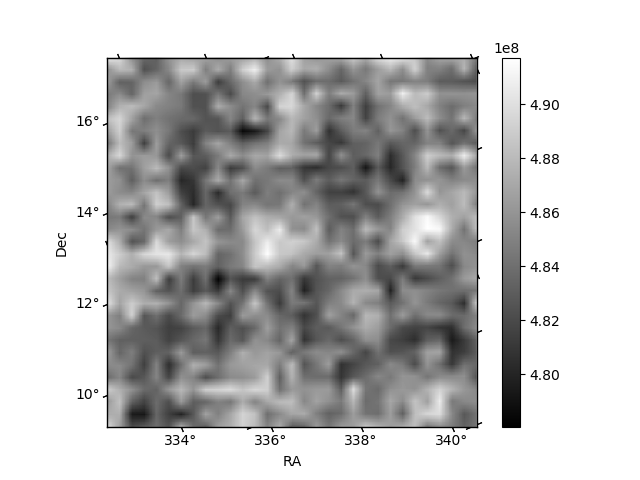
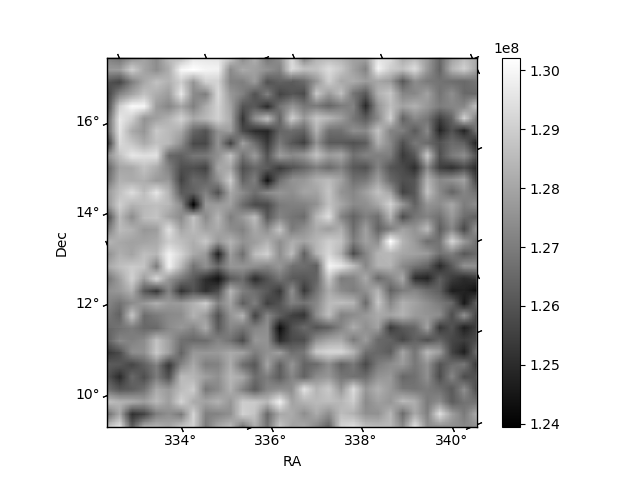
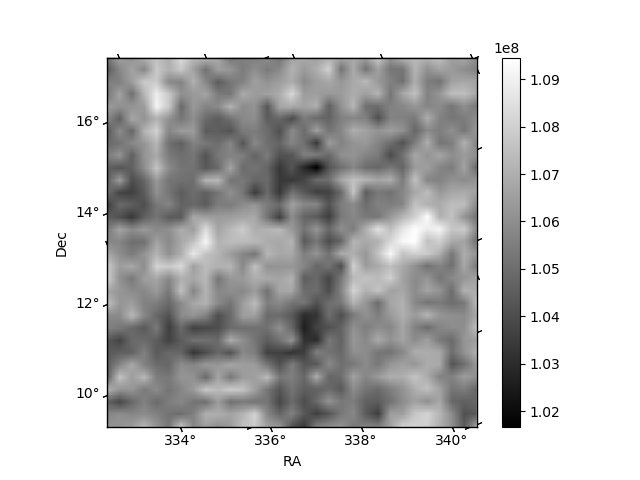
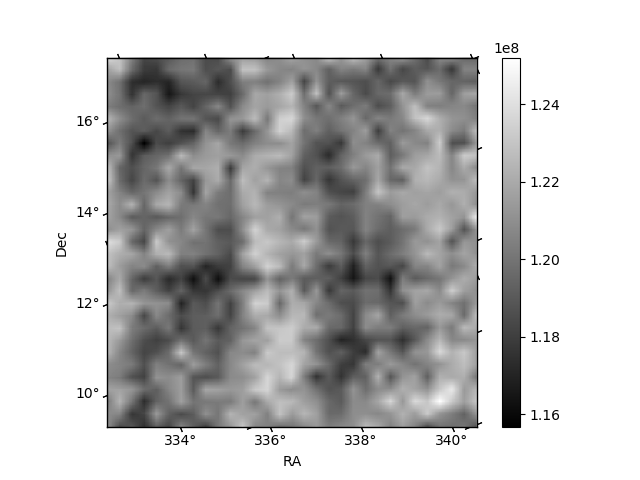
Histogram calculated using DETX and DETY for each event in the final _common_clean file
| Quadrant A | 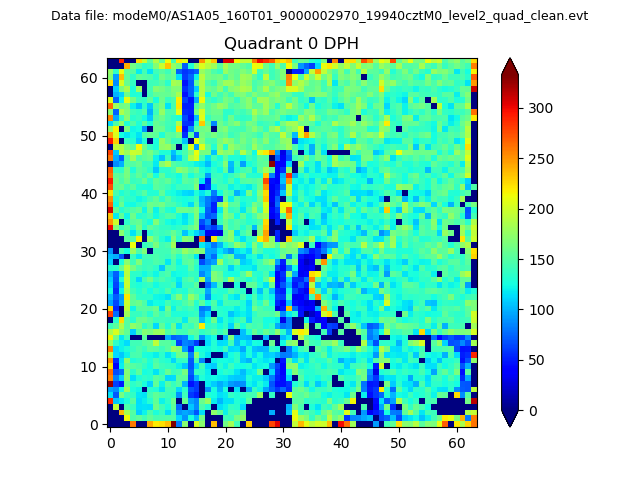 |
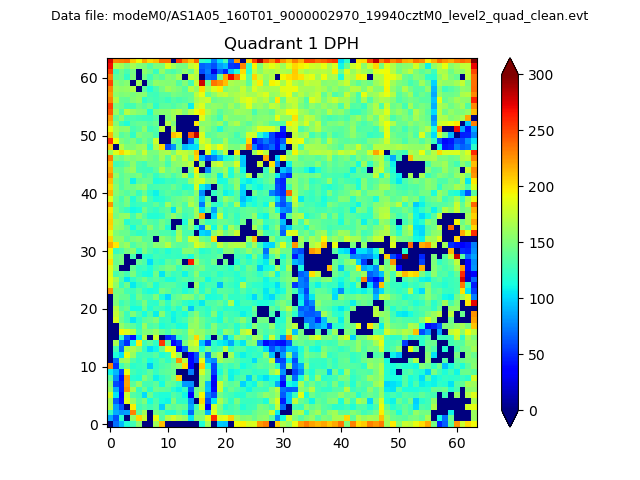 |
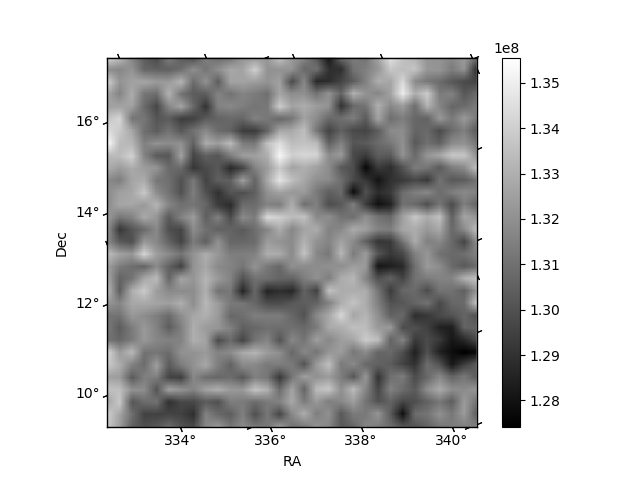
Quadrant B |
|---|---|---|---|
| Quadrant D | 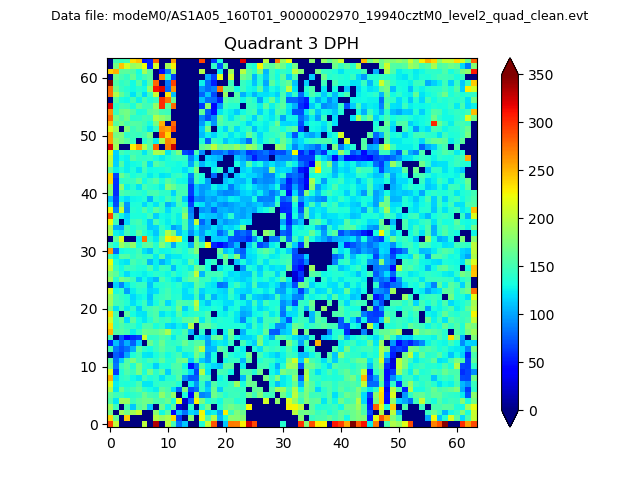 |
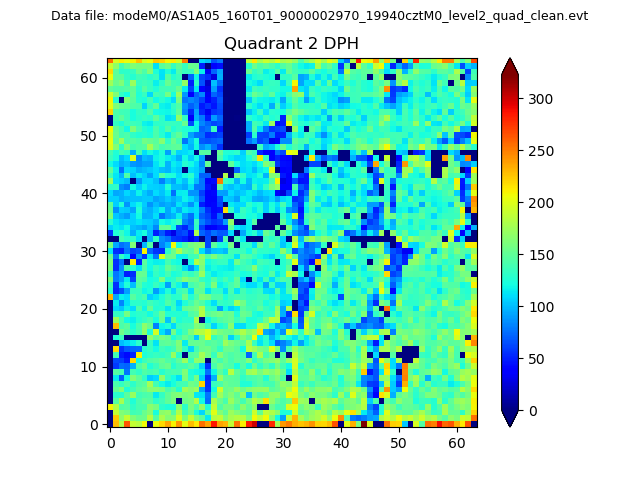 |
Quadrant C |
| Plot type | Count rate plots | Images |
|---|---|---|
| Comparison with Poisson distribution Blue bars denote a histogram of data divided into 1 sec bins. Red curve is a Poisson curve with rate = median count rate of data. |
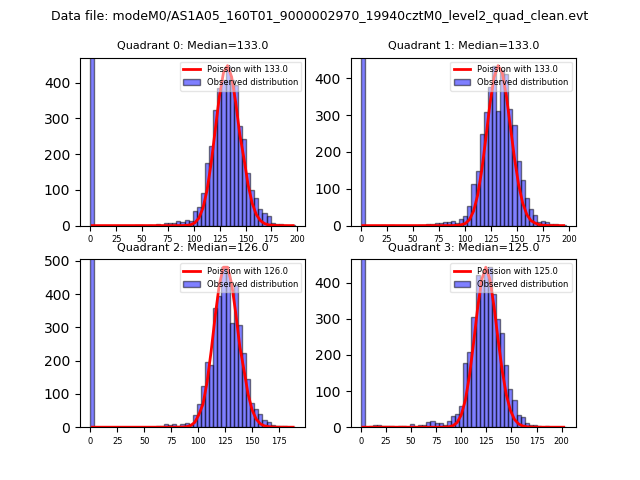 |
 |
| Quadrant-wise count rates Data is divided into 100 sec bins |
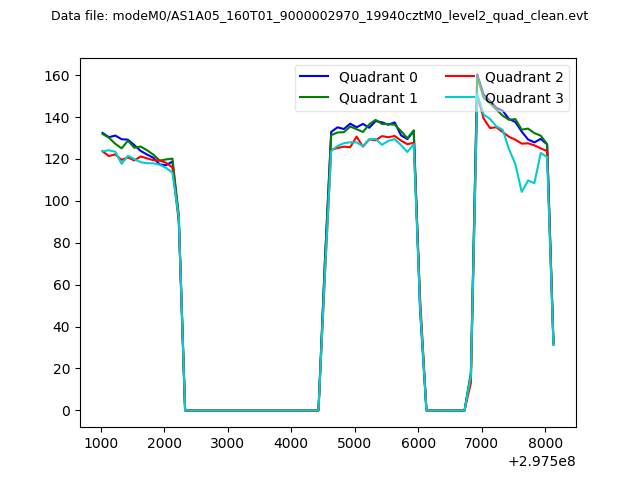 |
|
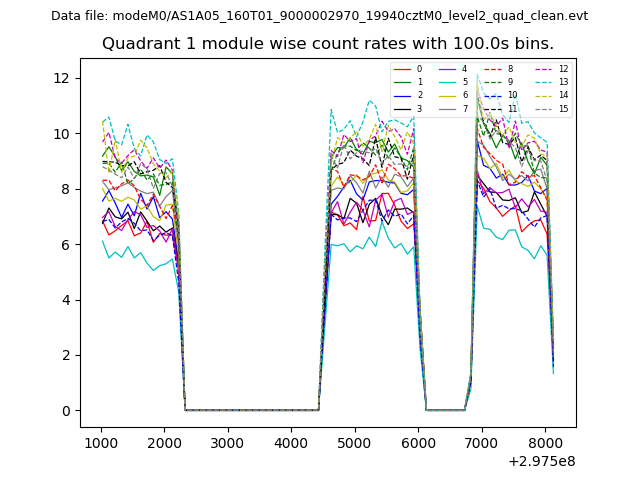
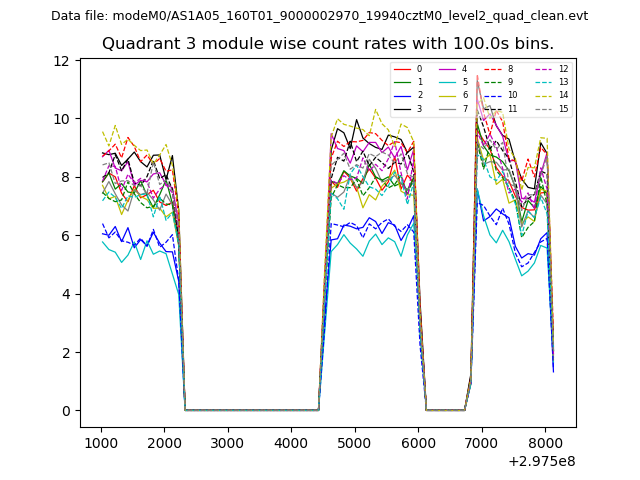
| Module-wise count rates for Quadrant A Data is divided into 100 sec bins |
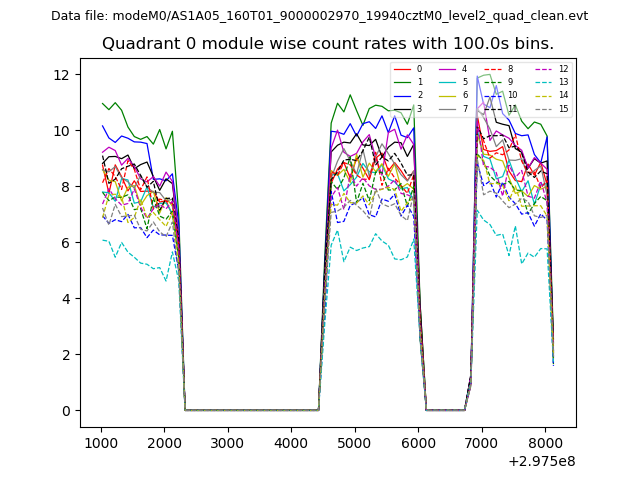 |
 |
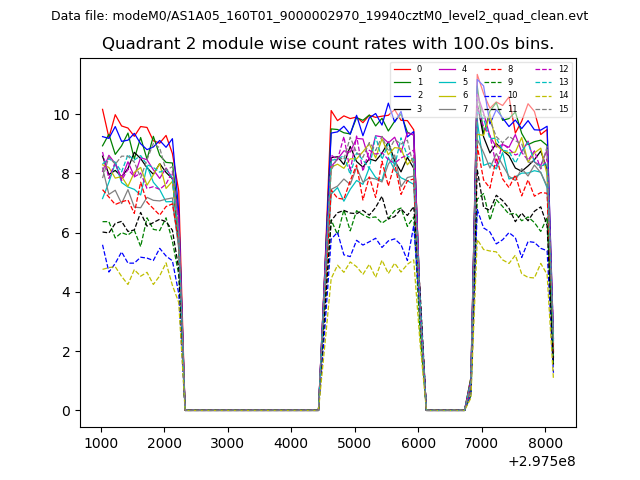
| Module-wise count rates for Quadrant B Data is divided into 100 sec bins |
 |
 |
| Module-wise count rates for Quadrant C Data is divided into 100 sec bins |
 |
 |
| Module-wise count rates for Quadrant D Data is divided into 100 sec bins |
 |
 |
| Parameter | Plot |
|---|---|
| CZT HV Monitor | 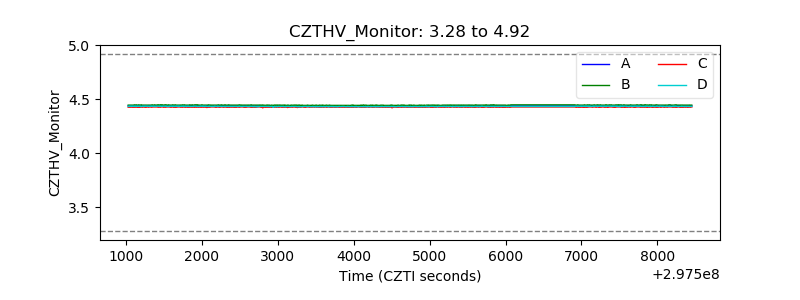 |
| D_VDD | 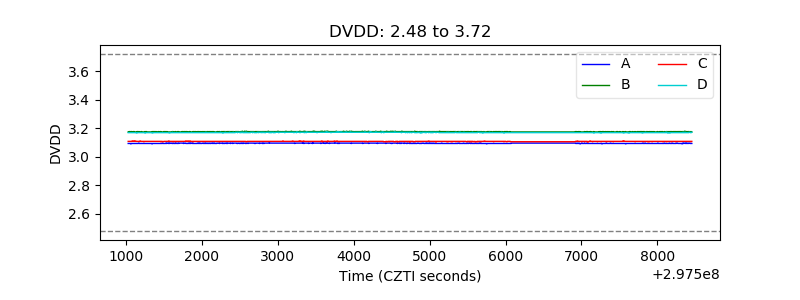 |
| Temperature 1 | 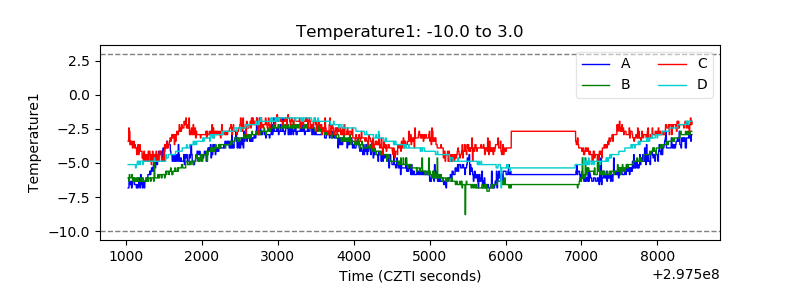 |
| Veto HV Monitor | 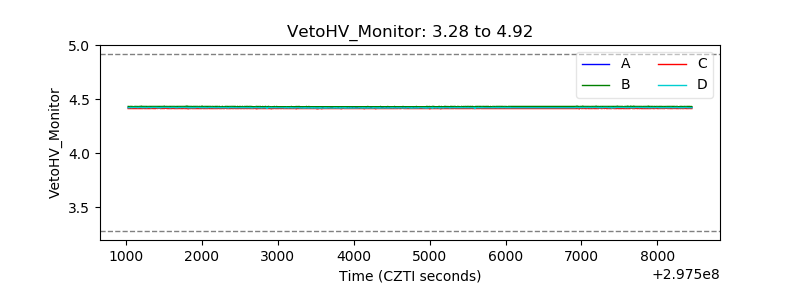 |
| Veto LLD | 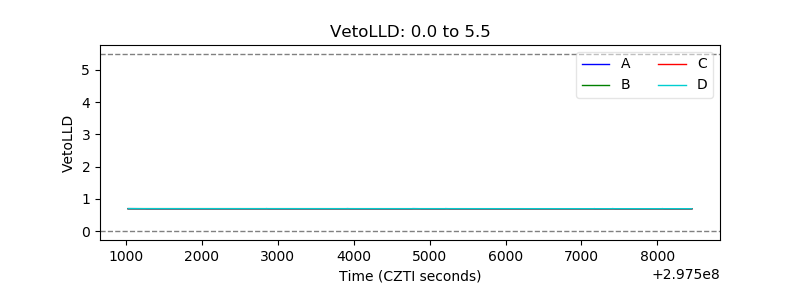 |
| Alpha Counter | 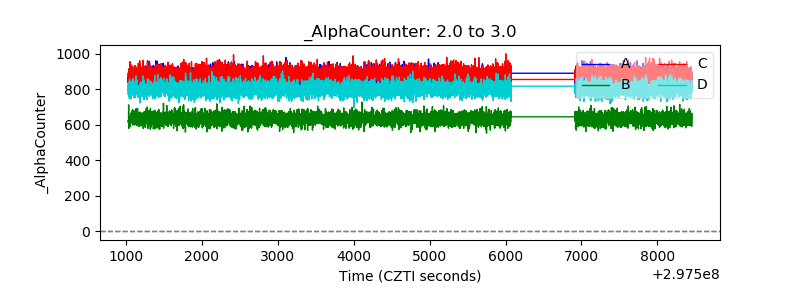 |
| _CPM_Rate | 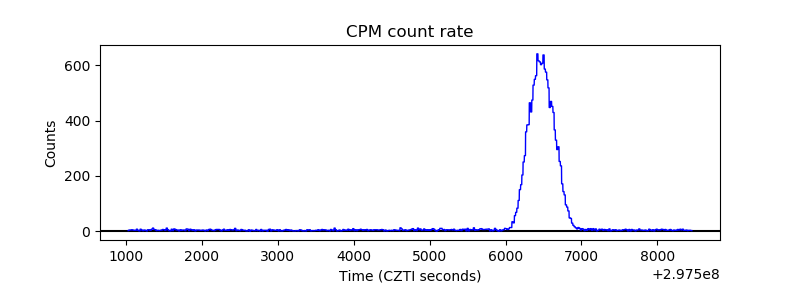 |
| CZT Counter | 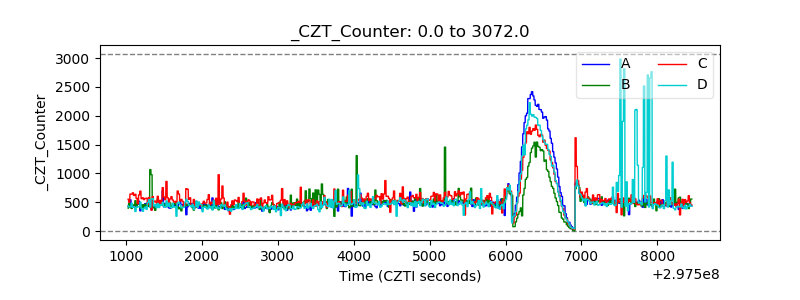 |
| +2.5 Volts monitor |  |
| +5 Volts monitor |  |
| _ROLL_ROT | 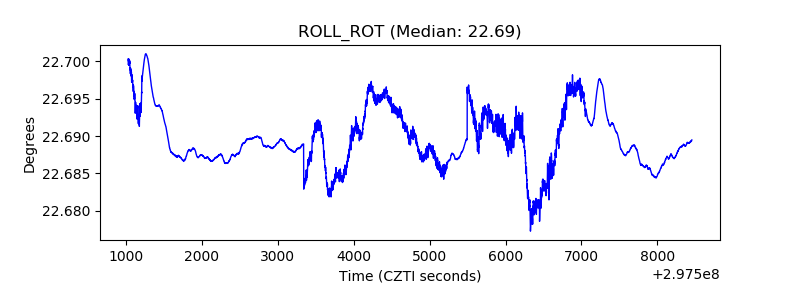 |
| _Roll_DEC |  |
| _Roll_RA | 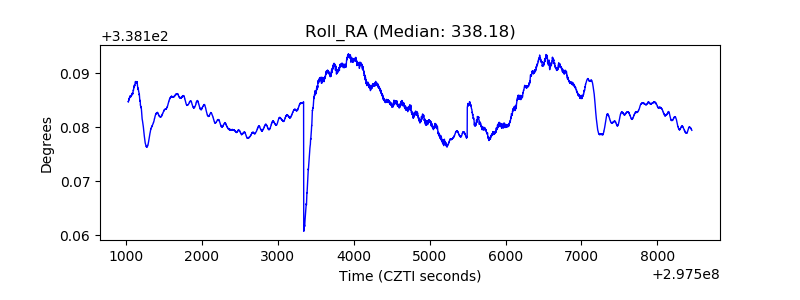 |
| Veto Counter | 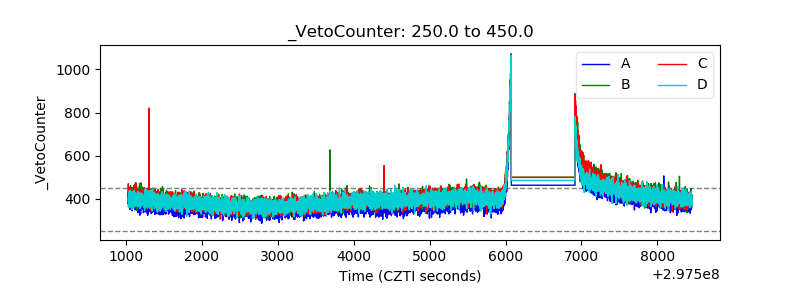 |