| Param | Original file | Final file |
|---|---|---|
| Filename | modeM0/AS1A05_160T01_9000002970_19945cztM0_level2.evt | modeM0/AS1A05_160T01_9000002970_19945cztM0_level2_quad_clean.evt |
| Size (bytes) | 662,232,960 | 66,689,280 |
| Size | 631.6 MB | 63.6 MB |
| Events in quadrant A | 5,537,269 | 405,745 |
| Events in quadrant B | 3,781,947 | 407,327 |
| Events in quadrant C | 4,551,847 | 386,208 |
| Events in quadrant D | 5,757,055 | 378,279 |
| Mode SS | |||
|---|---|---|---|
| Quadrant | BADHDUFLAG | Total packets | Discarded packets |
| A | 0 | 128 | 0 |
| B | 0 | 128 | 0 |
| C | 0 | 128 | 0 |
| D | 0 | 128 | 0 |
| Mode M0 | |||
|---|---|---|---|
| Quadrant | BADHDUFLAG | Total packets | Discarded packets |
| A | 0 | 20719 | 2 |
| B | 0 | 15419 | 2 |
| C | 0 | 17915 | 2 |
| D | 0 | 21312 | 2 |
| Mode M9 | |||
|---|---|---|---|
| Quadrant | BADHDUFLAG | Total packets | Discarded packets |
| A | 0 | 17 | 0 |
| B | 0 | 18 | 0 |
| C | 0 | 18 | 0 |
| D | 0 | 18 | 0 |
| Quadrant | Total seconds | Saturated seconds | Saturation percentage |
|---|---|---|---|
| A | 6326 | 851 | 13.452419% |
| B | 6326 | 142 | 2.244704% |
| C | 6326 | 291 | 4.600063% |
| D | 6326 | 914 | 14.448309% |
Noise dominated data is calculated using 1-second bins in cleaned event files. If a bin has >2000 counts, and if more than 50% of those come from <1% of pixels, then it is considered to be noise-dominated and hence unusable.
| Quadrant | # 1 sec bins | Bins with >0 counts | Bins with >2000 counts | High rate bins dominated by noise | Noise dominated (total time) | Noise dominated (detector-on time) | Marked lightcurve |
|---|---|---|---|---|---|---|---|
| A | 7611 | 6326 | 637 | 637 | 8.37% | 10.07% | 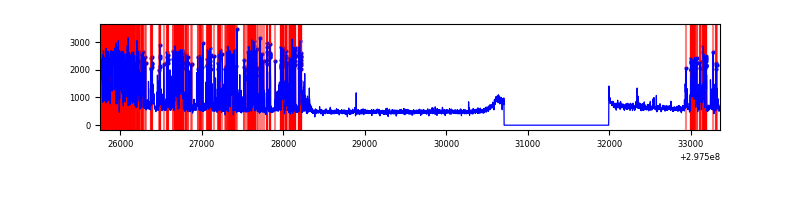 |
| B | 7611 | 6326 | 18 | 18 | 0.24% | 0.28% | 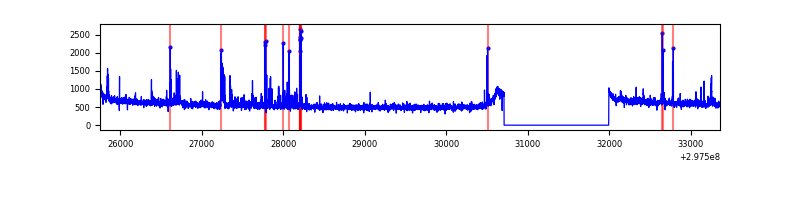 |
| C | 7611 | 6326 | 73 | 73 | 0.96% | 1.15% | 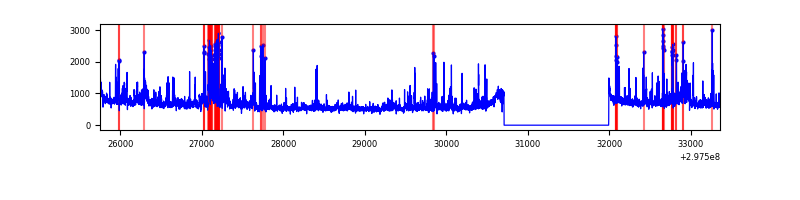 |
| D | 7610 | 6325 | 792 | 792 | 10.41% | 12.52% | 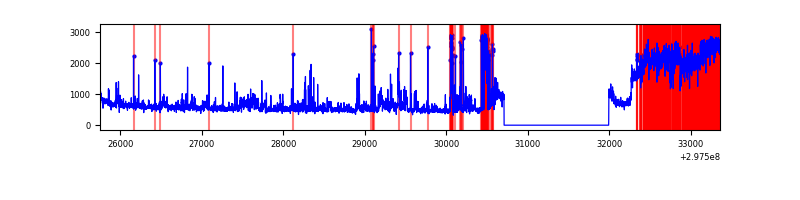 |
Top three noisy pixels from each quadrant. If the there are fewer than three noisy pixels in the level2.evt file, extra rows are filled as -1
| Pixel properties | Quadrant properties | ||||||
|---|---|---|---|---|---|---|---|
| Quadrant | DetID | PixID | Counts | Sigma | Mean | Median | Sigma |
| A | 14 | 238 | 2181687 | 12624.35 | 873 | 860 | 172.7 |
| A | 0 | 226 | 7599 | 39.01 | 873 | 860 | 172.7 |
| A | 3 | 137 | 6371 | 31.9 | 873 | 860 | 172.7 |
| B | 7 | 220 | 65561 | 379.95 | 907 | 888 | 170.2 |
| B | 0 | 190 | 64482 | 373.61 | 907 | 888 | 170.2 |
| B | 0 | 197 | 57668 | 333.58 | 907 | 888 | 170.2 |
| C | 4 | 254 | 523421 | 2609.88 | 868 | 877 | 200.2 |
| C | 3 | 233 | 320037 | 1594.06 | 868 | 877 | 200.2 |
| C | 14 | 238 | 138551 | 687.62 | 868 | 877 | 200.2 |
| D | 1 | 20 | 1724947 | 8373.55 | 861 | 840 | 205.9 |
| D | 1 | 52 | 716066 | 3473.67 | 861 | 840 | 205.9 |
| D | 2 | 234 | 31132 | 147.12 | 861 | 840 | 205.9 |
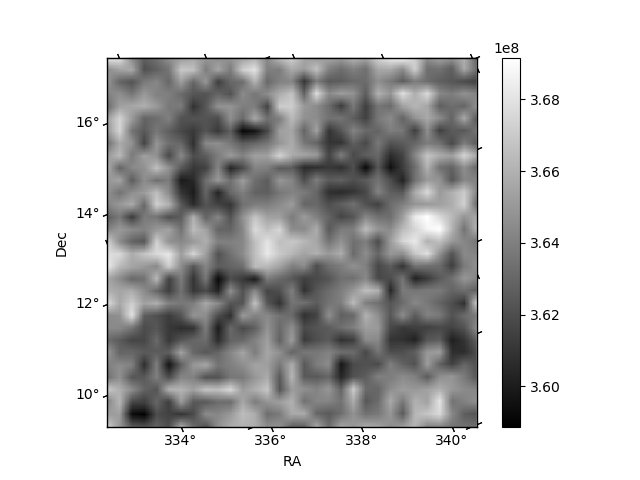
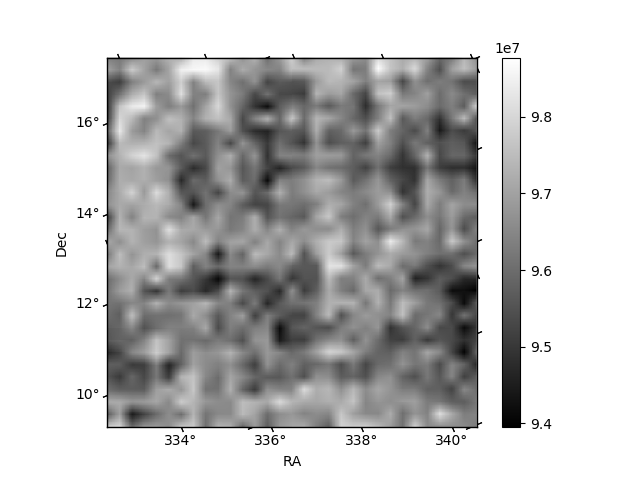
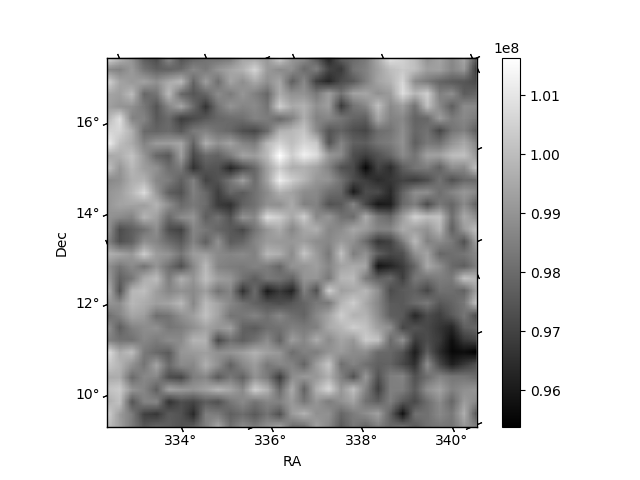
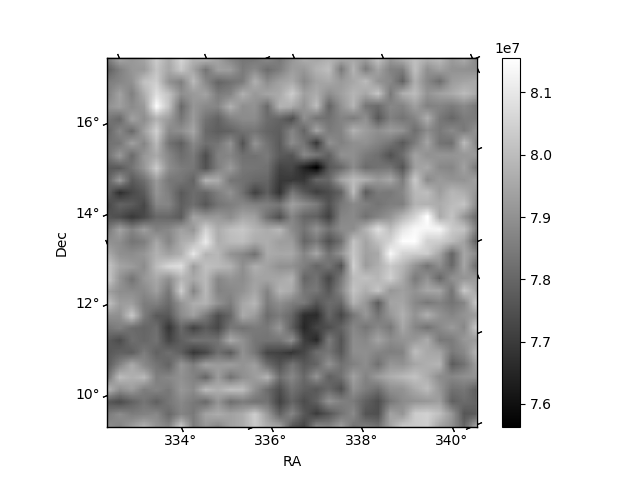
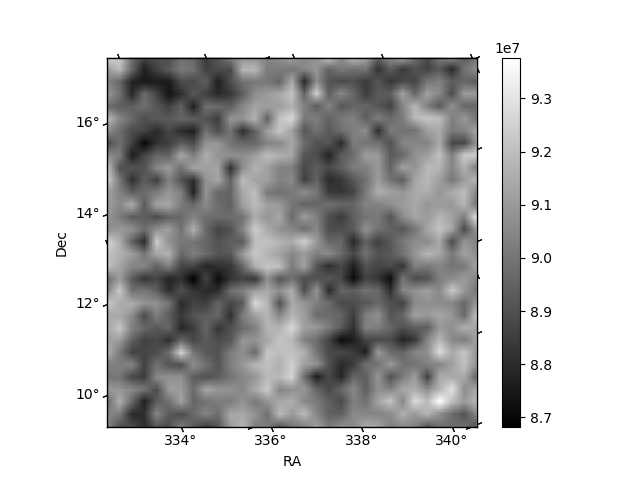
Histogram calculated using DETX and DETY for each event in the final _common_clean file
| Quadrant A | 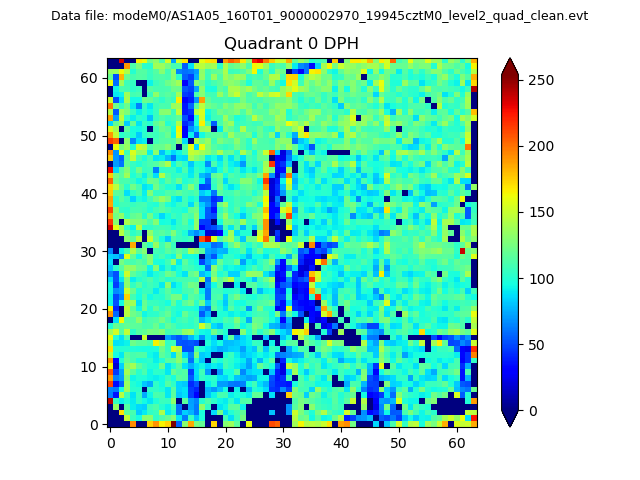 |
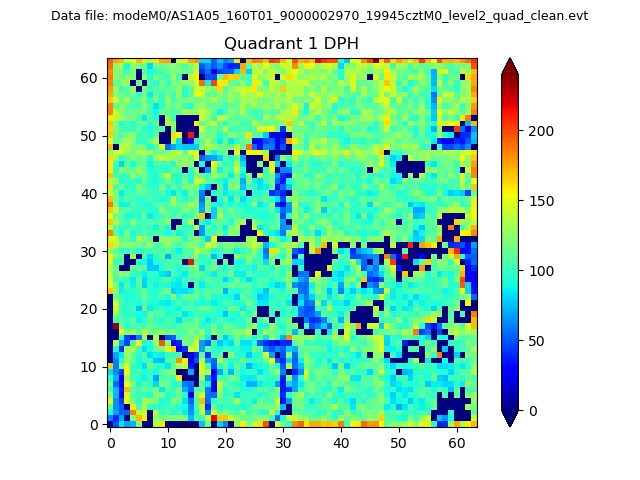 |
Quadrant B |
|---|---|---|---|
| Quadrant D | 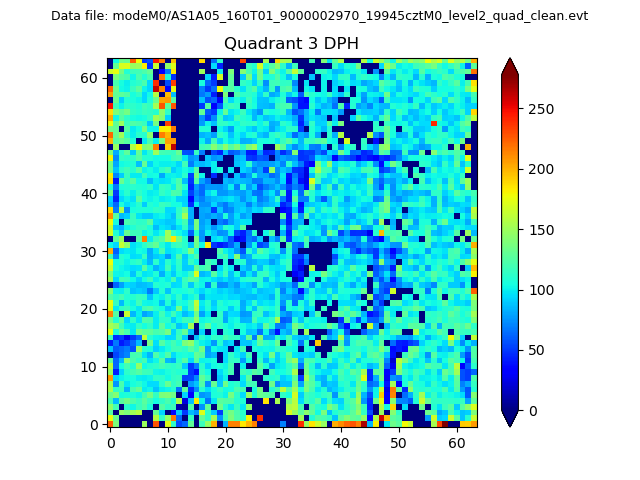 |
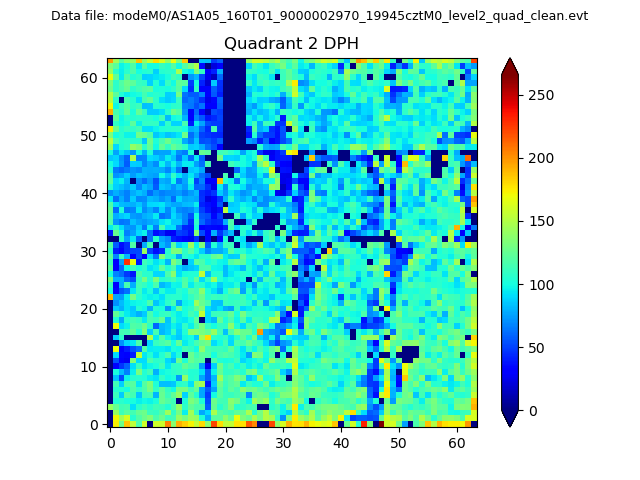 |
Quadrant C |
| Plot type | Count rate plots | Images |
|---|---|---|
| Comparison with Poisson distribution Blue bars denote a histogram of data divided into 1 sec bins. Red curve is a Poisson curve with rate = median count rate of data. |
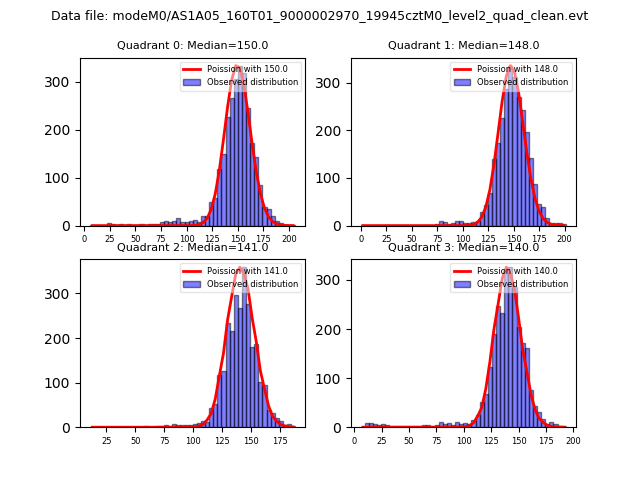 |
 |
| Quadrant-wise count rates Data is divided into 100 sec bins |
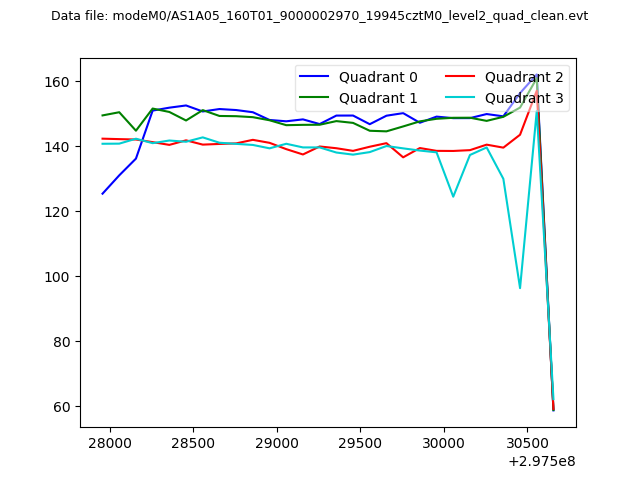 |
|
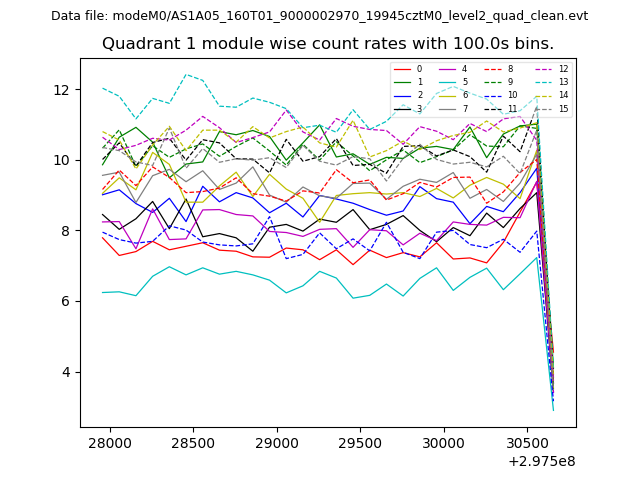
| Module-wise count rates for Quadrant A Data is divided into 100 sec bins |
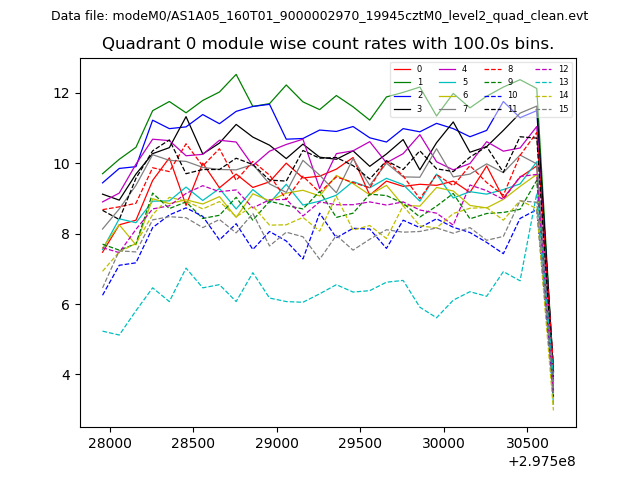 |
 |
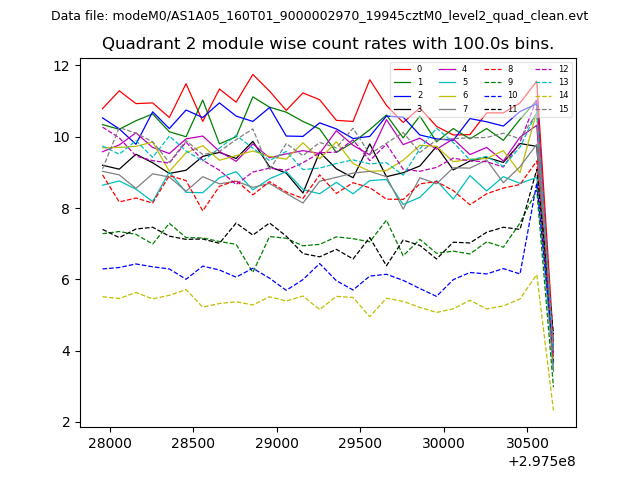
| Module-wise count rates for Quadrant B Data is divided into 100 sec bins |
 |
 |
| Module-wise count rates for Quadrant C Data is divided into 100 sec bins |
 |
 |
| Module-wise count rates for Quadrant D Data is divided into 100 sec bins |
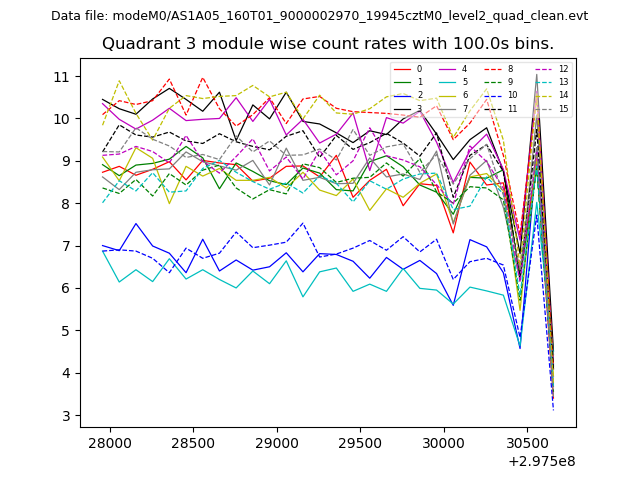 |
 |
| Parameter | Plot |
|---|---|
| CZT HV Monitor | 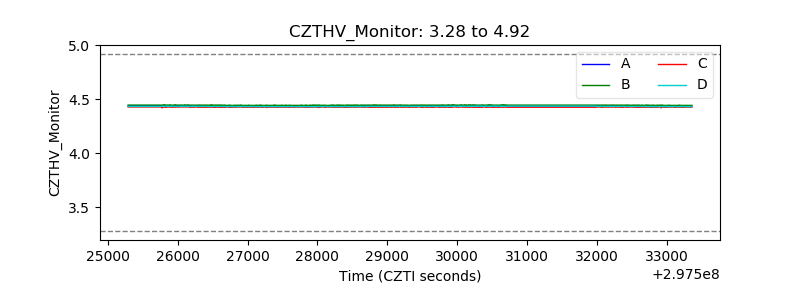 |
| D_VDD |  |
| Temperature 1 |  |
| Veto HV Monitor | 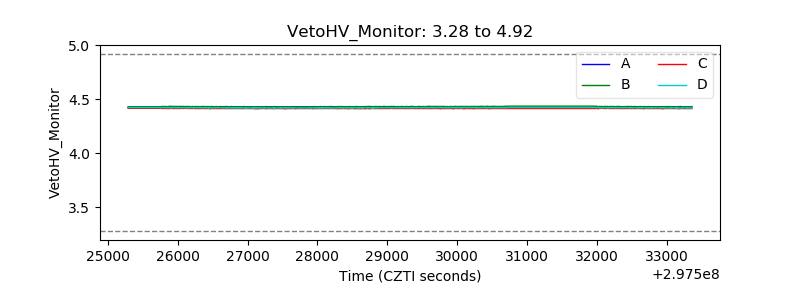 |
| Veto LLD | 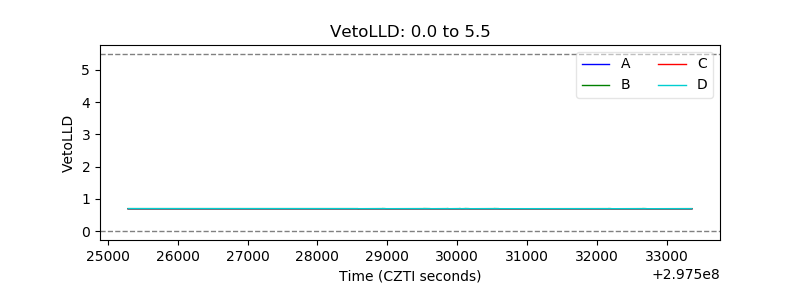 |
| Alpha Counter | 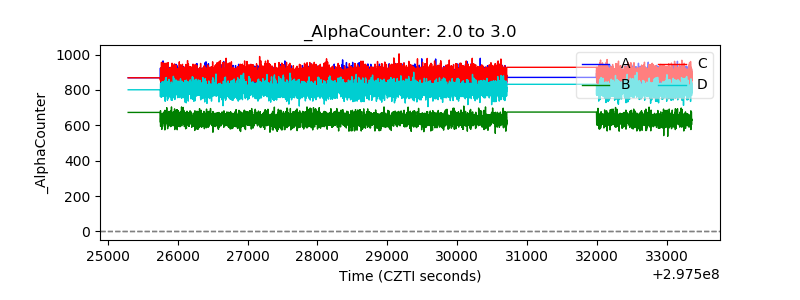 |
| _CPM_Rate | 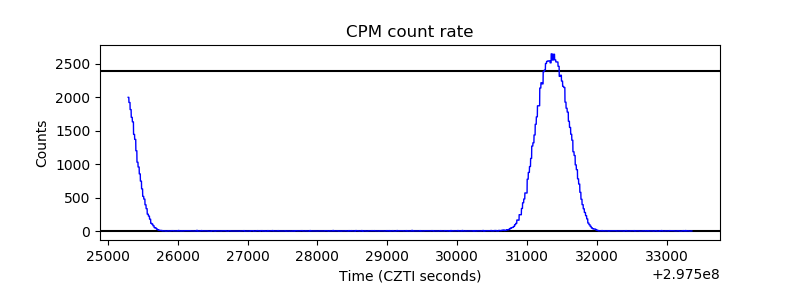 |
| CZT Counter | 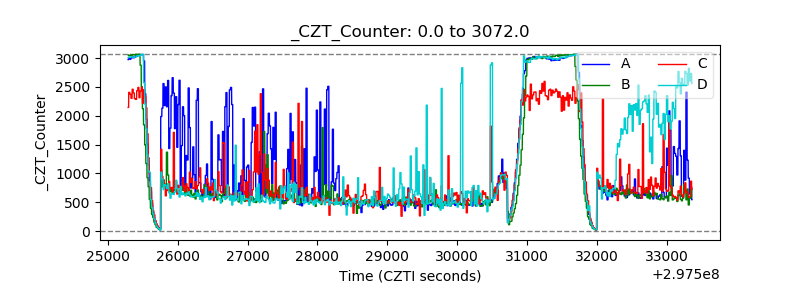 |
| +2.5 Volts monitor | 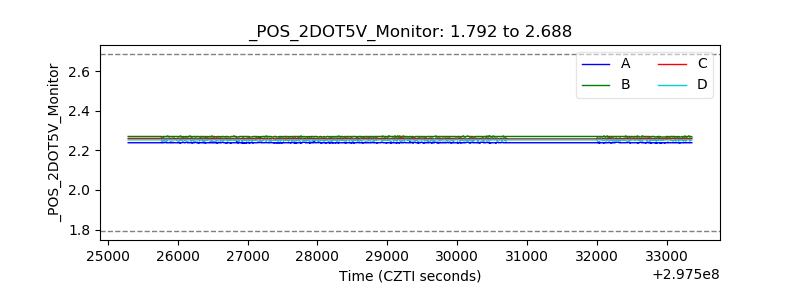 |
| +5 Volts monitor |  |
| _ROLL_ROT | 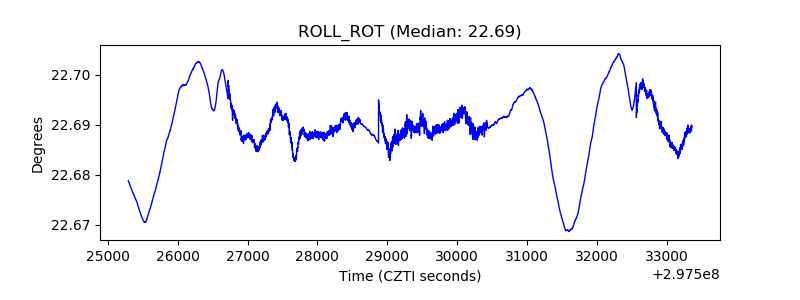 |
| _Roll_DEC | 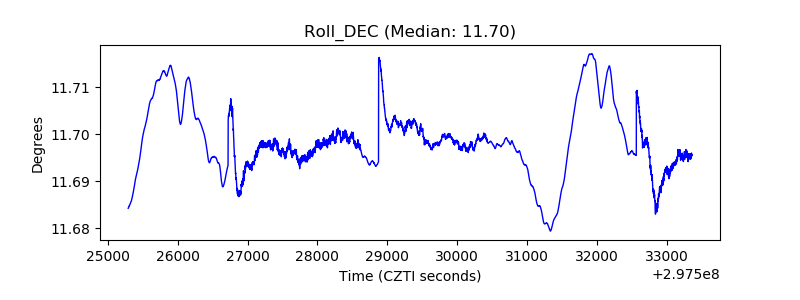 |
| _Roll_RA | 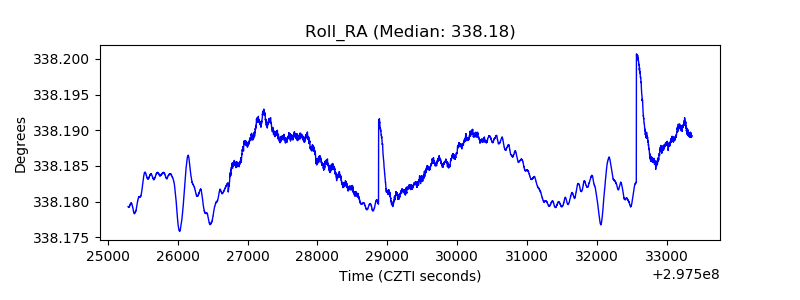 |
| Veto Counter | 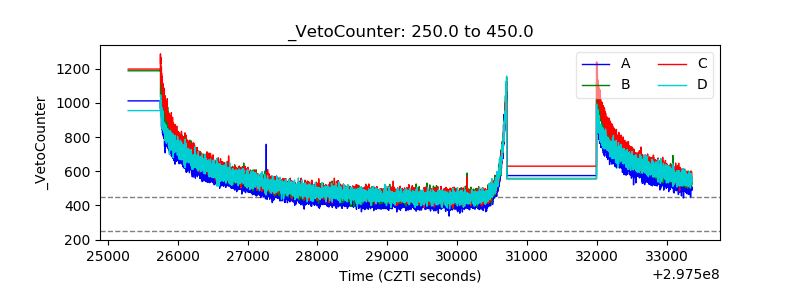 |