| Param | Original file | Final file |
|---|---|---|
| Filename | modeM0/AS1A05_160T01_9000002970_19946cztM0_level2.evt | modeM0/AS1A05_160T01_9000002970_19946cztM0_level2_quad_clean.evt |
| Size (bytes) | 516,257,280 | 73,082,880 |
| Size | 492.3 MB | 69.7 MB |
| Events in quadrant A | 3,437,899 | 468,962 |
| Events in quadrant B | 3,234,217 | 468,258 |
| Events in quadrant C | 3,547,921 | 442,864 |
| Events in quadrant D | 5,035,588 | 441,800 |
| Mode SS | |||
|---|---|---|---|
| Quadrant | BADHDUFLAG | Total packets | Discarded packets |
| A | 0 | 114 | 0 |
| B | 0 | 114 | 0 |
| C | 0 | 114 | 0 |
| D | 0 | 114 | 0 |
| Mode M0 | |||
|---|---|---|---|
| Quadrant | BADHDUFLAG | Total packets | Discarded packets |
| A | 0 | 13760 | 1 |
| B | 0 | 13167 | 1 |
| C | 0 | 14243 | 1 |
| D | 0 | 18538 | 5 |
| Mode M9 | |||
|---|---|---|---|
| Quadrant | BADHDUFLAG | Total packets | Discarded packets |
| A | 0 | 13 | 0 |
| B | 0 | 13 | 0 |
| C | 0 | 13 | 0 |
| D | 0 | 13 | 0 |
| Quadrant | Total seconds | Saturated seconds | Saturation percentage |
|---|---|---|---|
| A | 5589 | 196 | 3.506889% |
| B | 5590 | 126 | 2.254025% |
| C | 5590 | 189 | 3.381038% |
| D | 5589 | 920 | 16.460905% |
Noise dominated data is calculated using 1-second bins in cleaned event files. If a bin has >2000 counts, and if more than 50% of those come from <1% of pixels, then it is considered to be noise-dominated and hence unusable.
| Quadrant | # 1 sec bins | Bins with >0 counts | Bins with >2000 counts | High rate bins dominated by noise | Noise dominated (total time) | Noise dominated (detector-on time) | Marked lightcurve |
|---|---|---|---|---|---|---|---|
| A | 6929 | 5589 | 84 | 84 | 1.21% | 1.50% | 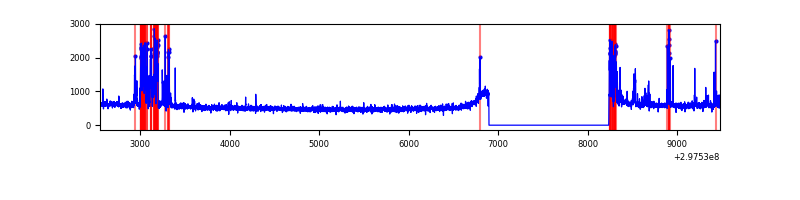 |
| B | 6930 | 5590 | 21 | 21 | 0.30% | 0.38% | 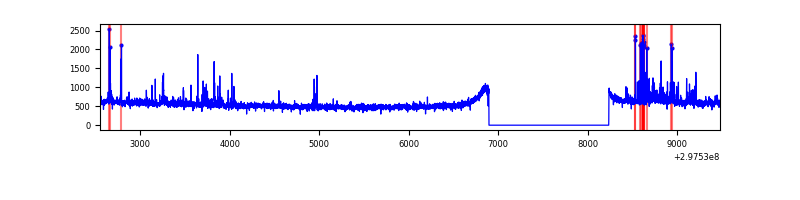 |
| C | 6930 | 5590 | 34 | 34 | 0.49% | 0.61% |  |
| D | 6929 | 5589 | 832 | 832 | 12.01% | 14.89% | 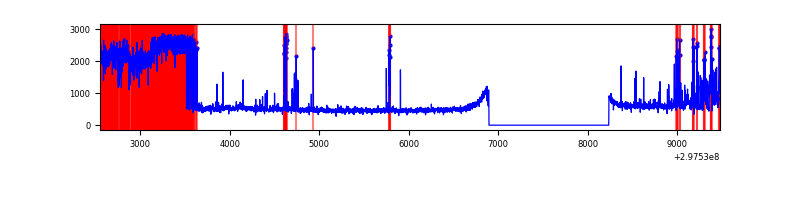 |
Top three noisy pixels from each quadrant. If the there are fewer than three noisy pixels in the level2.evt file, extra rows are filled as -1
| Pixel properties | Quadrant properties | ||||||
|---|---|---|---|---|---|---|---|
| Quadrant | DetID | PixID | Counts | Sigma | Mean | Median | Sigma |
| A | 14 | 238 | 447543 | 2888.94 | 778 | 766 | 154.7 |
| A | 0 | 226 | 6779 | 38.88 | 778 | 766 | 154.7 |
| A | 3 | 137 | 5623 | 31.41 | 778 | 766 | 154.7 |
| B | 7 | 220 | 115928 | 787.23 | 777 | 762 | 146.3 |
| B | 0 | 197 | 35274 | 235.91 | 777 | 762 | 146.3 |
| B | 0 | 190 | 30205 | 201.26 | 777 | 762 | 146.3 |
| C | 4 | 254 | 266189 | 1543.37 | 750 | 759 | 172.0 |
| C | 14 | 238 | 118862 | 686.72 | 750 | 759 | 172.0 |
| C | 3 | 233 | 117979 | 681.59 | 750 | 759 | 172.0 |
| D | 1 | 20 | 1802507 | 10250.63 | 726 | 707 | 175.8 |
| D | 1 | 52 | 409515 | 2325.75 | 726 | 707 | 175.8 |
| D | 2 | 184 | 60238 | 338.68 | 726 | 707 | 175.8 |
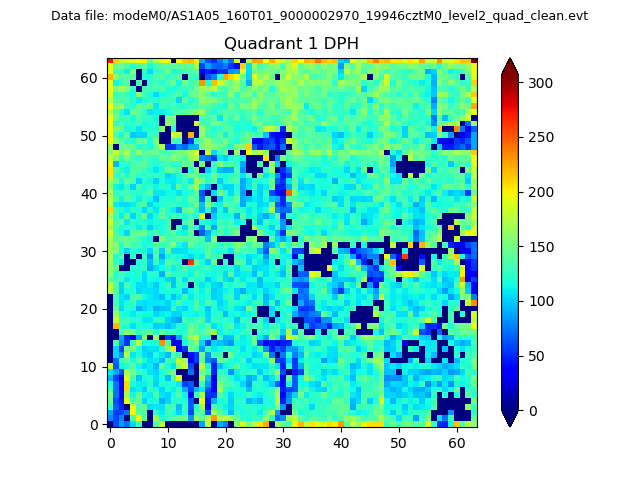
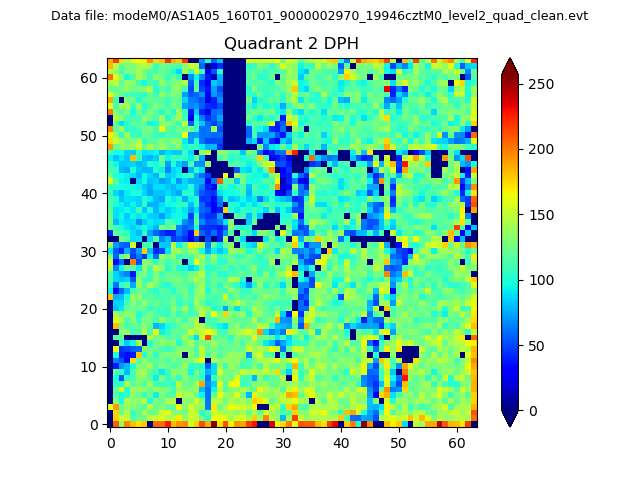
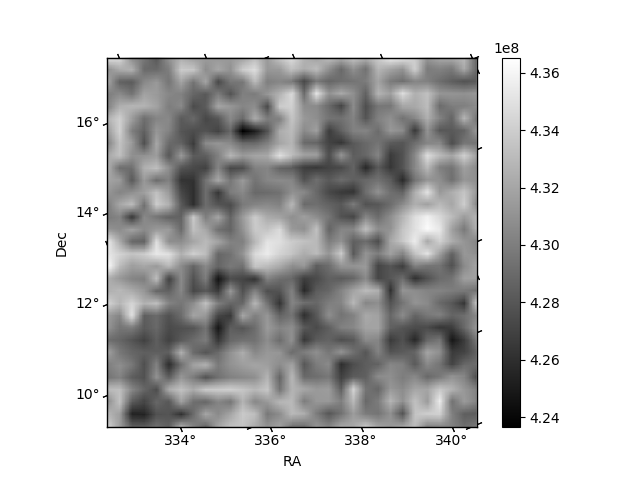
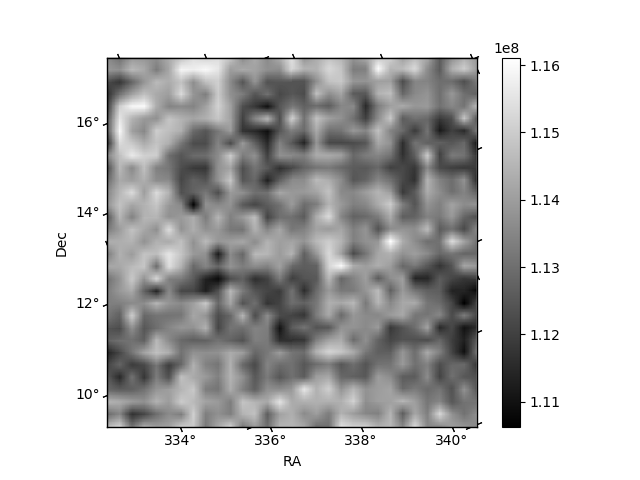
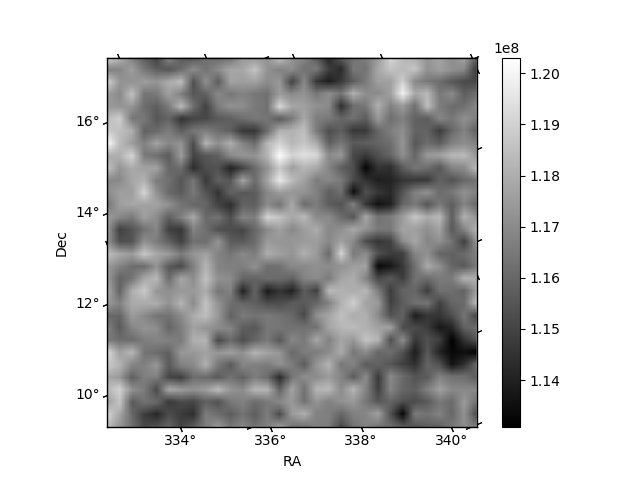
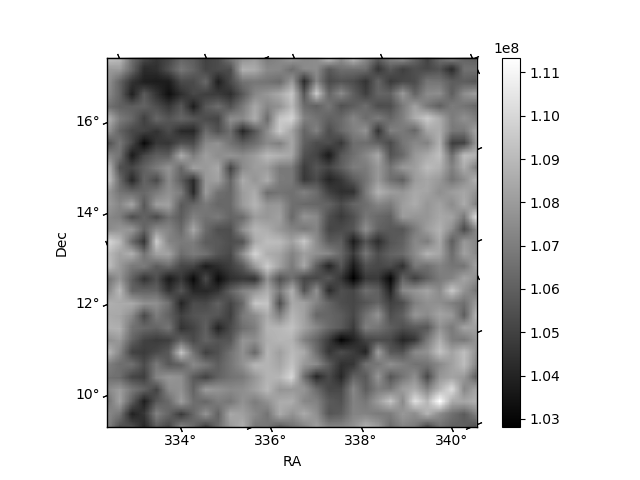
Histogram calculated using DETX and DETY for each event in the final _common_clean file
| Quadrant A | 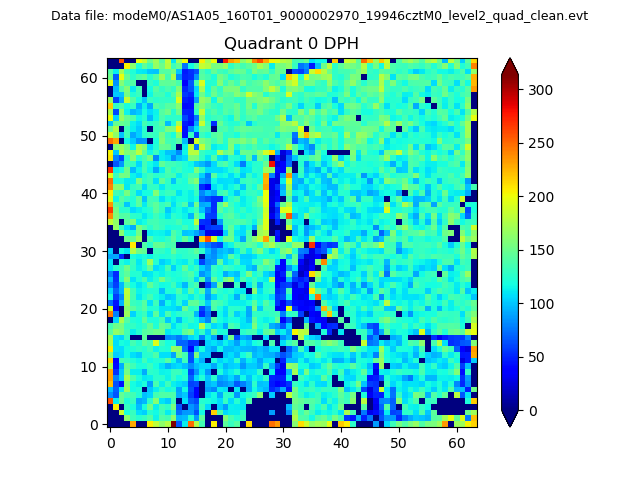 |
 |
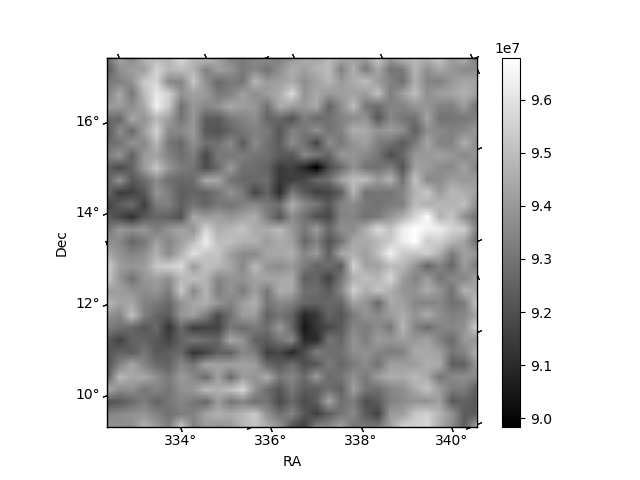
Quadrant B |
|---|---|---|---|
| Quadrant D | 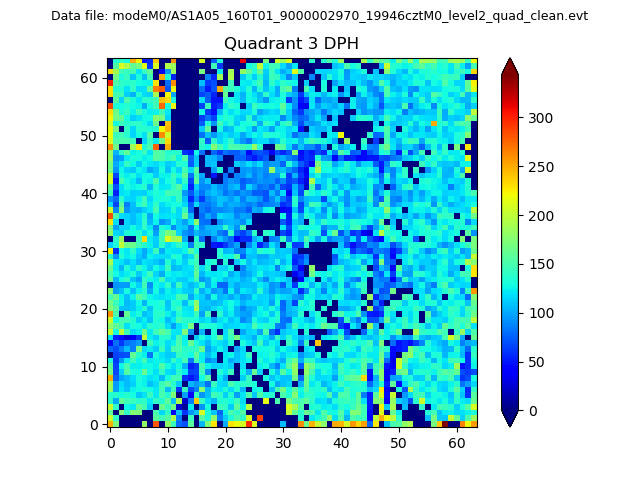 |
 |
Quadrant C |
| Plot type | Count rate plots | Images |
|---|---|---|
| Comparison with Poisson distribution Blue bars denote a histogram of data divided into 1 sec bins. Red curve is a Poisson curve with rate = median count rate of data. |
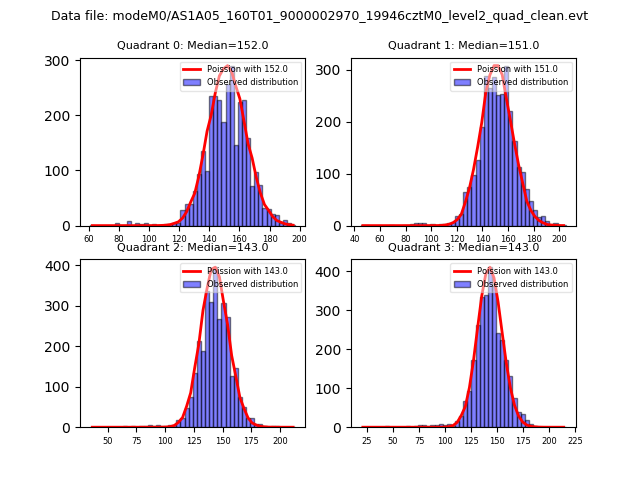 |
 |
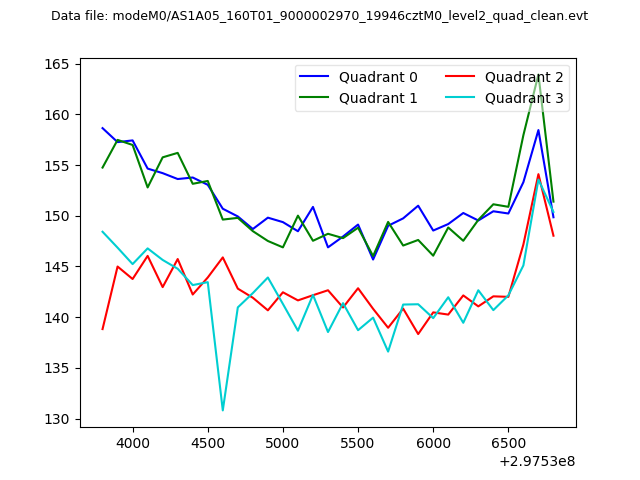
| Quadrant-wise count rates Data is divided into 100 sec bins |
 |
|
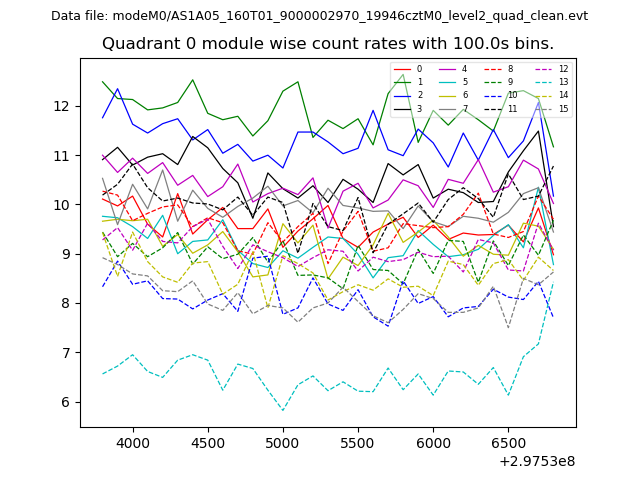
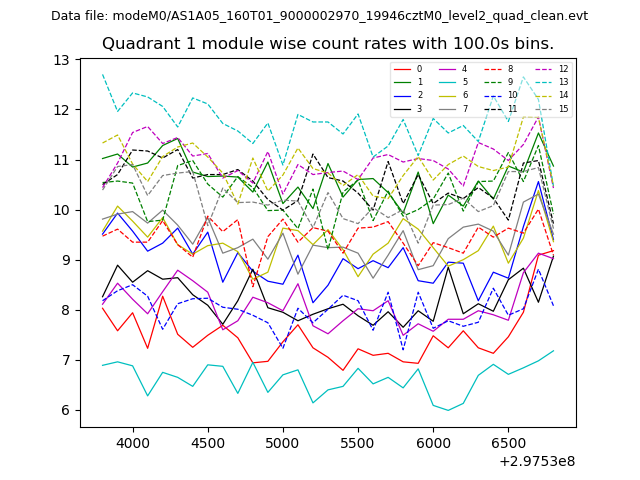
| Module-wise count rates for Quadrant A Data is divided into 100 sec bins |
 |
 |
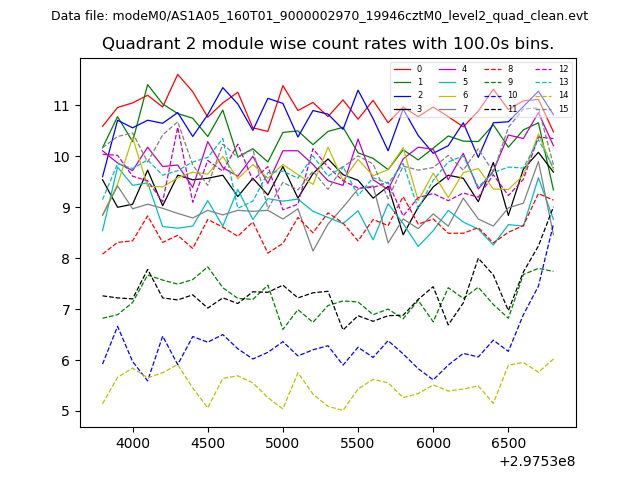
| Module-wise count rates for Quadrant B Data is divided into 100 sec bins |
 |
 |
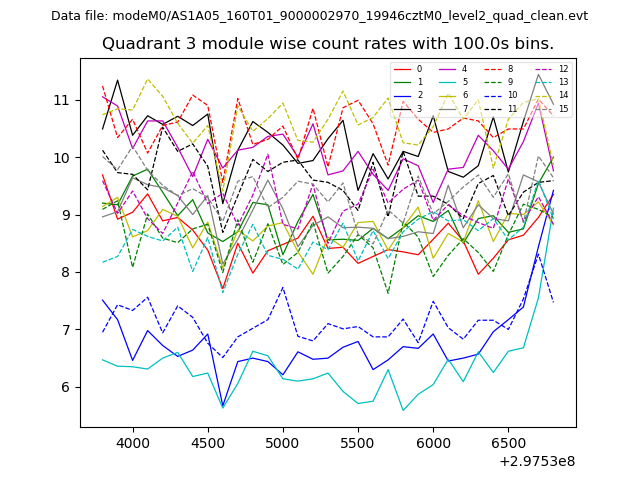
| Module-wise count rates for Quadrant C Data is divided into 100 sec bins |
 |
 |
| Module-wise count rates for Quadrant D Data is divided into 100 sec bins |
 |
 |
| Parameter | Plot |
|---|---|
| CZT HV Monitor | 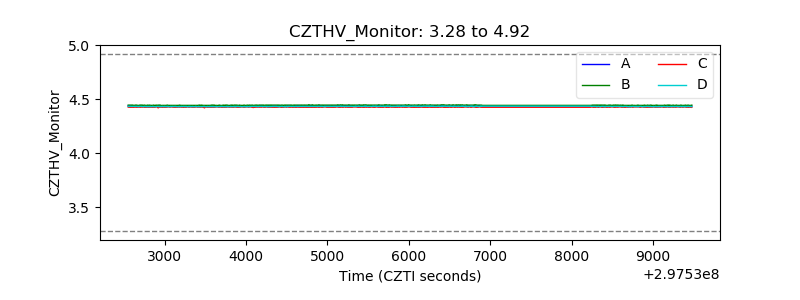 |
| D_VDD | 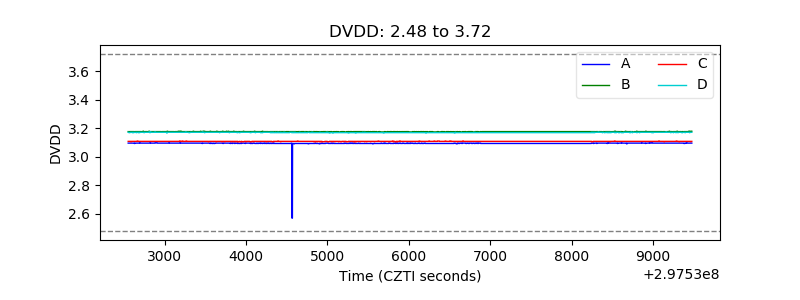 |
| Temperature 1 | 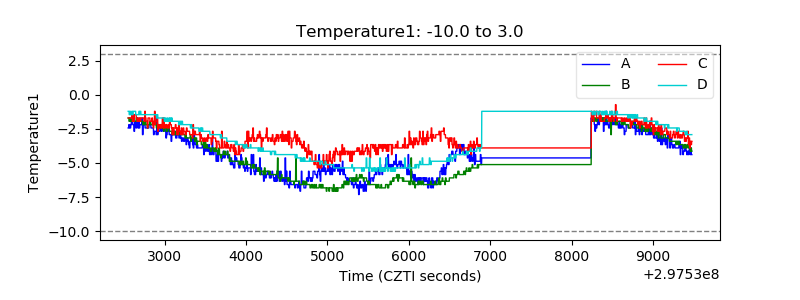 |
| Veto HV Monitor | 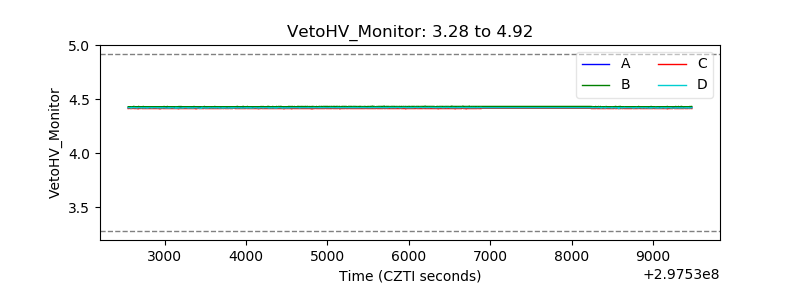 |
| Veto LLD | 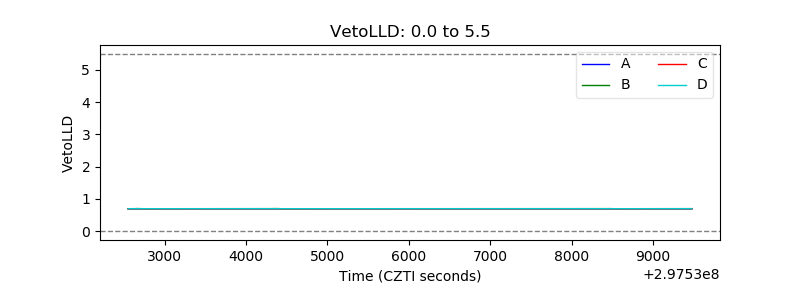 |
| Alpha Counter | 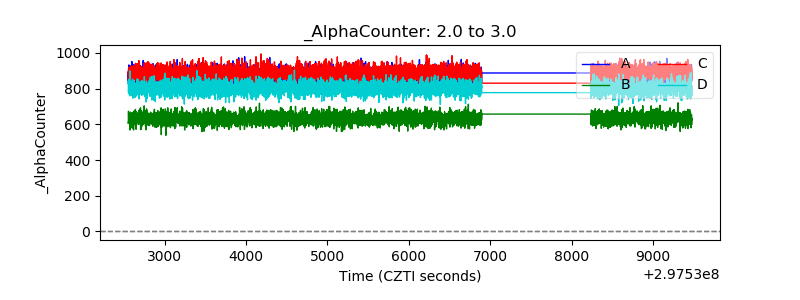 |
| _CPM_Rate | 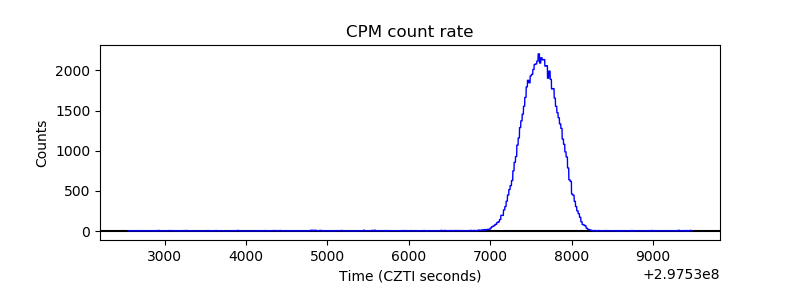 |
| CZT Counter | 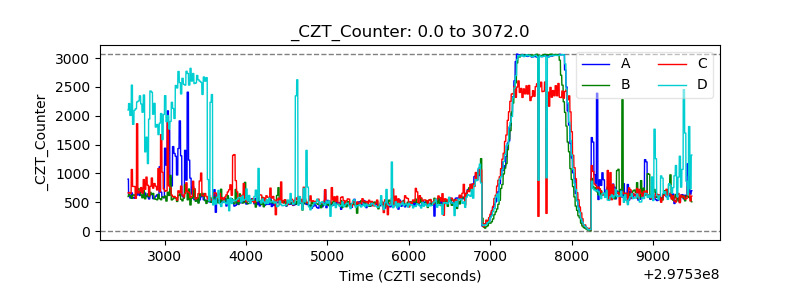 |
| +2.5 Volts monitor |  |
| +5 Volts monitor |  |
| _ROLL_ROT | 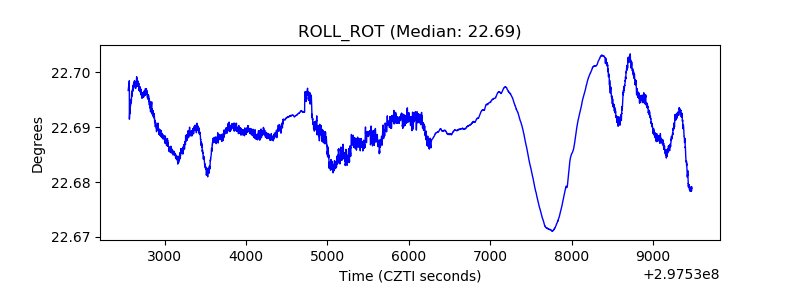 |
| _Roll_DEC |  |
| _Roll_RA | 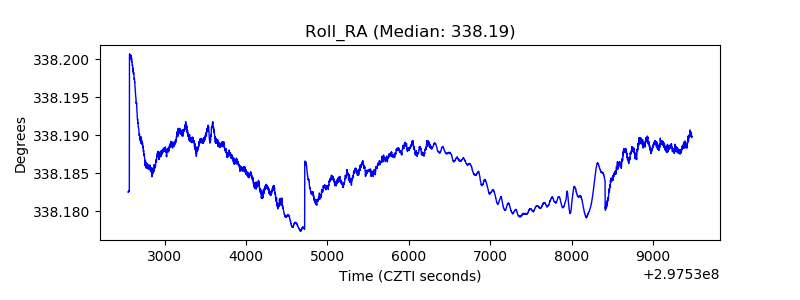 |
| Veto Counter | 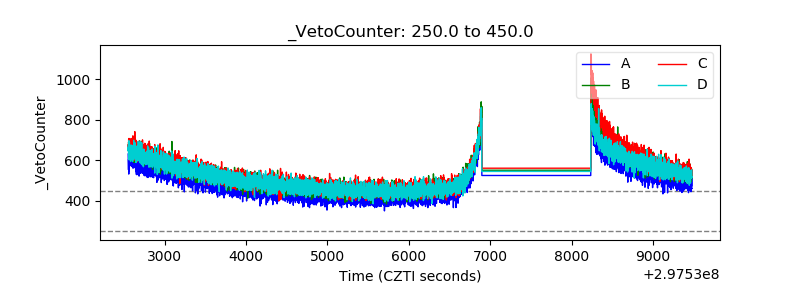 |