| Param | Original file | Final file |
|---|---|---|
| Filename | modeM0/AS1A05_160T01_9000002970_19948cztM0_level2.evt | modeM0/AS1A05_160T01_9000002970_19948cztM0_level2_quad_clean.evt |
| Size (bytes) | 631,111,680 | 89,403,840 |
| Size | 601.9 MB | 85.3 MB |
| Events in quadrant A | 7,415,053 | 528,023 |
| Events in quadrant B | 3,466,473 | 594,031 |
| Events in quadrant C | 4,033,158 | 564,861 |
| Events in quadrant D | 3,756,398 | 564,792 |
| Mode SS | |||
|---|---|---|---|
| Quadrant | BADHDUFLAG | Total packets | Discarded packets |
| A | 0 | 136 | 0 |
| B | 0 | 136 | 0 |
| C | 0 | 136 | 0 |
| D | 0 | 136 | 0 |
| Mode M0 | |||
|---|---|---|---|
| Quadrant | BADHDUFLAG | Total packets | Discarded packets |
| A | 0 | 26522 | 2 |
| B | 0 | 14422 | 2 |
| C | 0 | 16076 | 2 |
| D | 0 | 15538 | 2 |
| Mode M9 | |||
|---|---|---|---|
| Quadrant | BADHDUFLAG | Total packets | Discarded packets |
| A | 0 | 22 | 0 |
| B | 0 | 22 | 0 |
| C | 0 | 22 | 0 |
| D | 0 | 22 | 0 |
| Quadrant | Total seconds | Saturated seconds | Saturation percentage |
|---|---|---|---|
| A | 6523 | 1470 | 22.535643% |
| B | 6523 | 120 | 1.839644% |
| C | 6523 | 258 | 3.955235% |
| D | 6523 | 187 | 2.866779% |
Noise dominated data is calculated using 1-second bins in cleaned event files. If a bin has >2000 counts, and if more than 50% of those come from <1% of pixels, then it is considered to be noise-dominated and hence unusable.
| Quadrant | # 1 sec bins | Bins with >0 counts | Bins with >2000 counts | High rate bins dominated by noise | Noise dominated (total time) | Noise dominated (detector-on time) | Marked lightcurve |
|---|---|---|---|---|---|---|---|
| A | 8818 | 6524 | 1195 | 1195 | 13.55% | 18.32% | 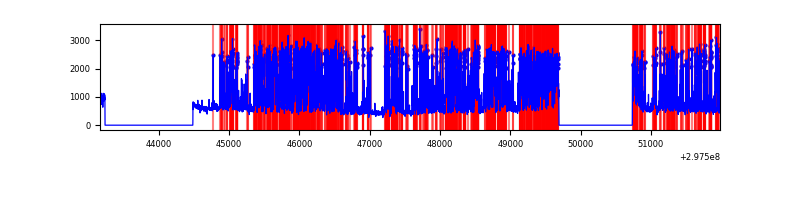 |
| B | 8818 | 6524 | 11 | 11 | 0.12% | 0.17% | 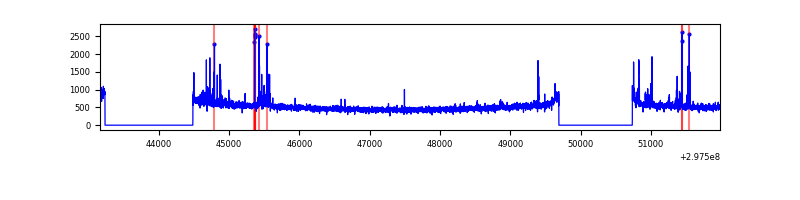 |
| C | 8818 | 6523 | 48 | 48 | 0.54% | 0.74% | 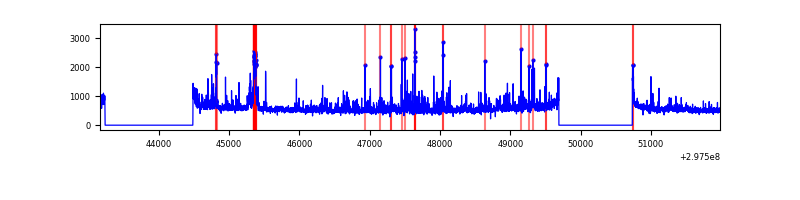 |
| D | 8818 | 6524 | 85 | 85 | 0.96% | 1.30% | 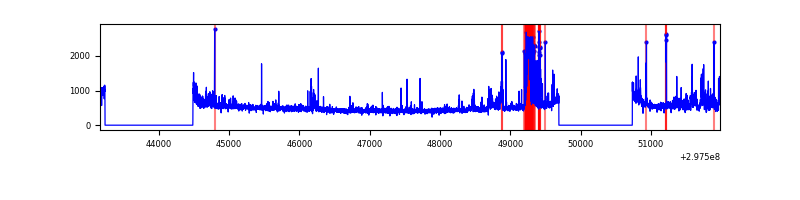 |
Top three noisy pixels from each quadrant. If the there are fewer than three noisy pixels in the level2.evt file, extra rows are filled as -1
| Pixel properties | Quadrant properties | ||||||
|---|---|---|---|---|---|---|---|
| Quadrant | DetID | PixID | Counts | Sigma | Mean | Median | Sigma |
| A | 14 | 238 | 4428146 | 28395.14 | 774 | 759 | 155.9 |
| A | 0 | 226 | 6521 | 36.95 | 774 | 759 | 155.9 |
| A | 3 | 137 | 5995 | 33.58 | 774 | 759 | 155.9 |
| B | 7 | 220 | 74122 | 454.5 | 843 | 825 | 161.3 |
| B | 0 | 197 | 57079 | 348.82 | 843 | 825 | 161.3 |
| B | 12 | 111 | 19060 | 113.07 | 843 | 825 | 161.3 |
| C | 9 | 221 | 401558 | 2110.48 | 811 | 817 | 189.9 |
| C | 3 | 233 | 283126 | 1486.76 | 811 | 817 | 189.9 |
| C | 14 | 238 | 126066 | 659.62 | 811 | 817 | 189.9 |
| D | 1 | 52 | 485204 | 2403.6 | 825 | 804 | 201.5 |
| D | 2 | 184 | 106973 | 526.81 | 825 | 804 | 201.5 |
| D | 2 | 234 | 35265 | 171.0 | 825 | 804 | 201.5 |
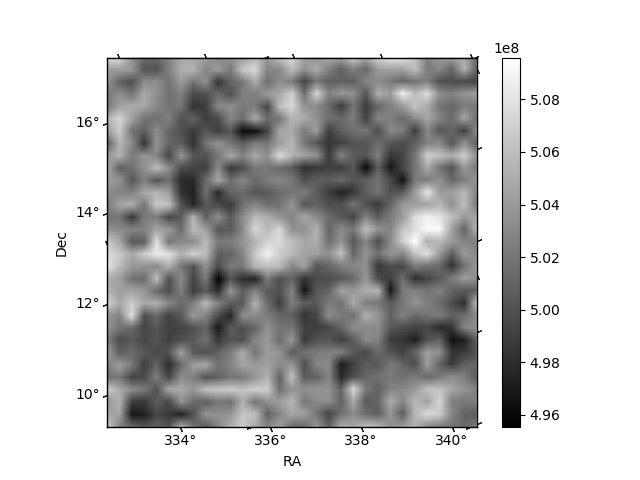
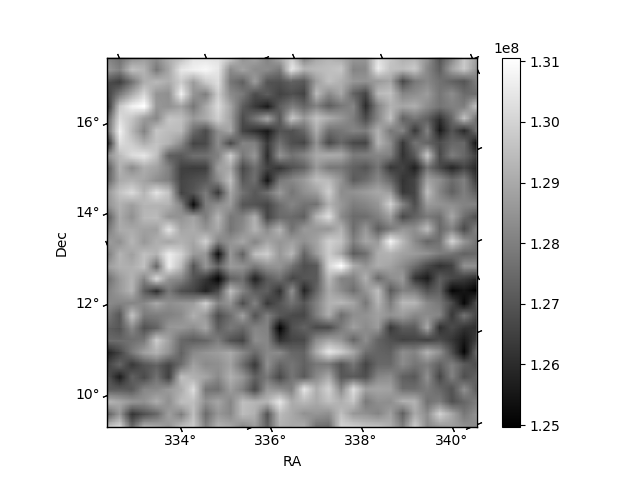
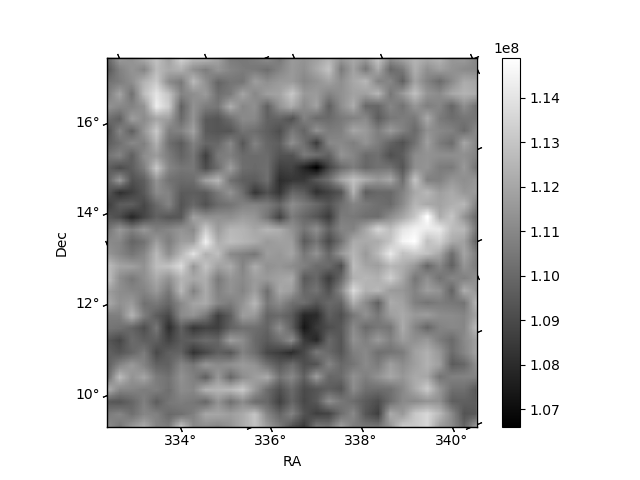
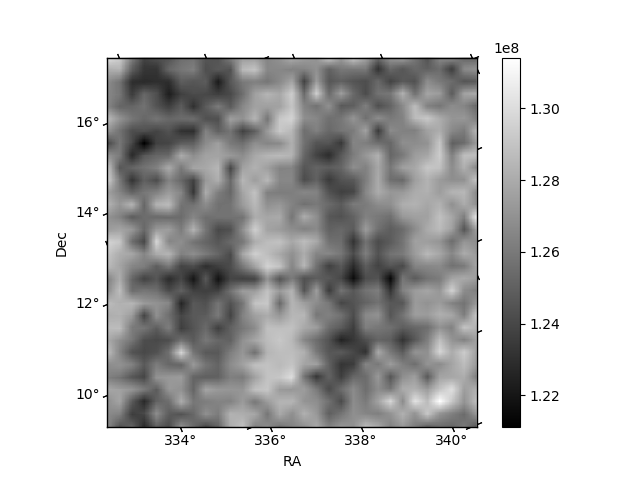
Histogram calculated using DETX and DETY for each event in the final _common_clean file
| Quadrant A | 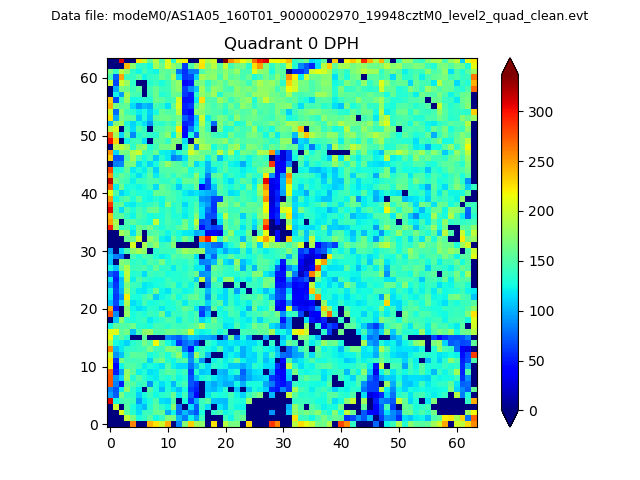 |
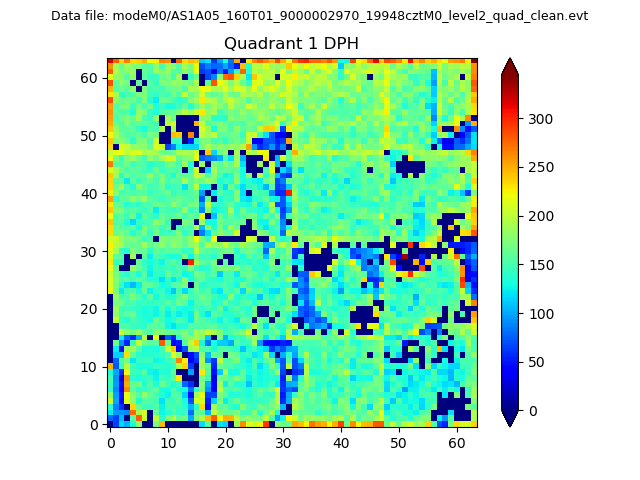 |
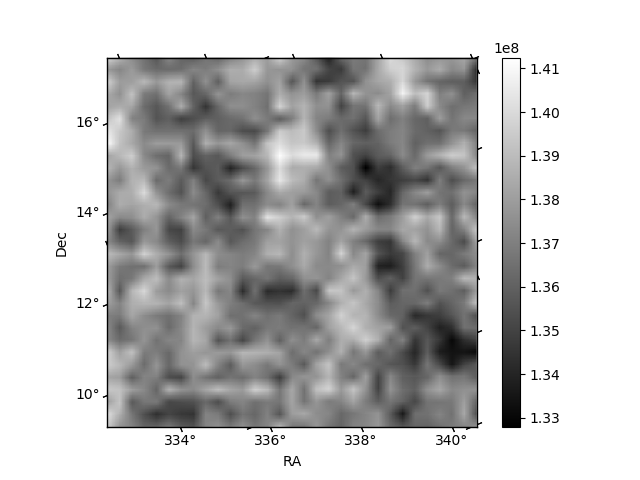
Quadrant B |
|---|---|---|---|
| Quadrant D | 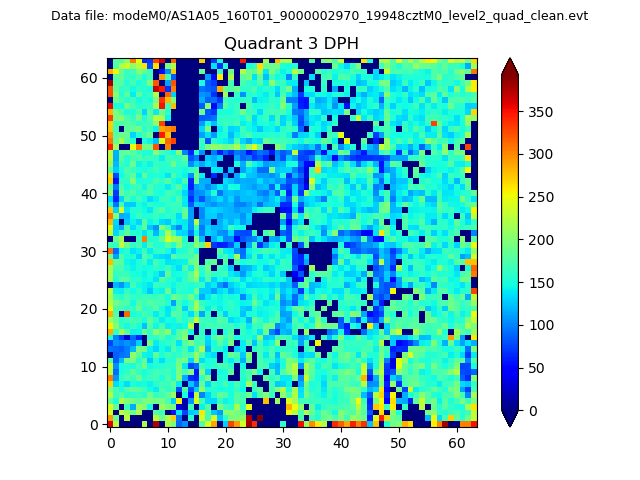 |
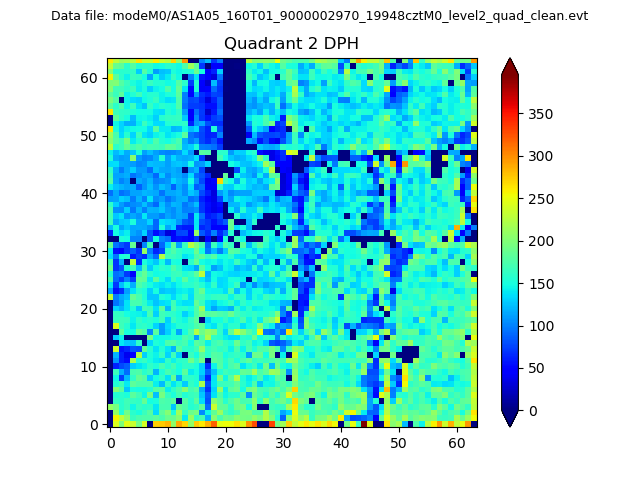 |
Quadrant C |
| Plot type | Count rate plots | Images |
|---|---|---|
| Comparison with Poisson distribution Blue bars denote a histogram of data divided into 1 sec bins. Red curve is a Poisson curve with rate = median count rate of data. |
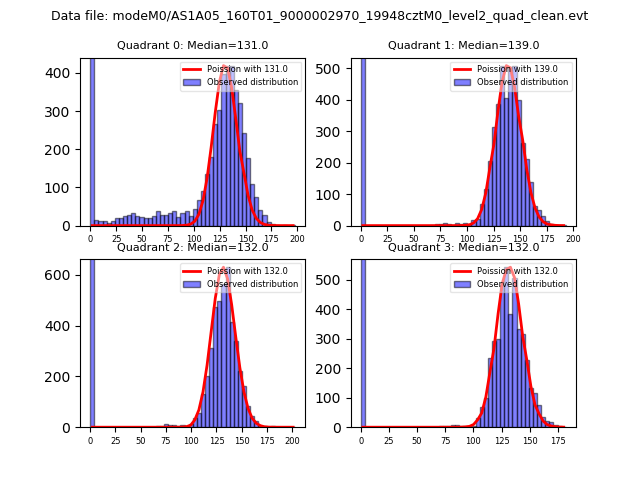 |
 |
| Quadrant-wise count rates Data is divided into 100 sec bins |
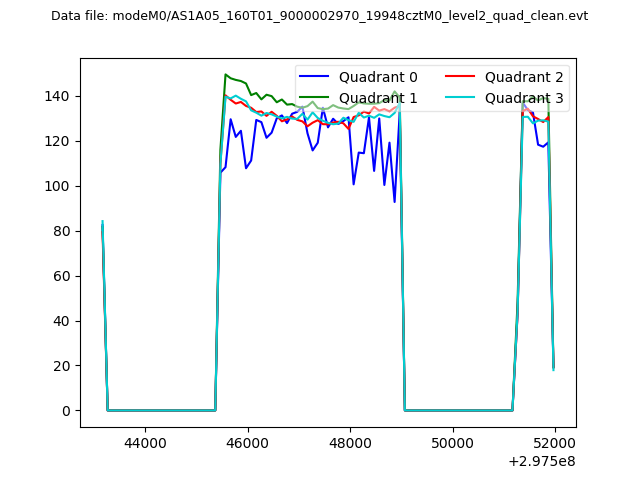 |
|
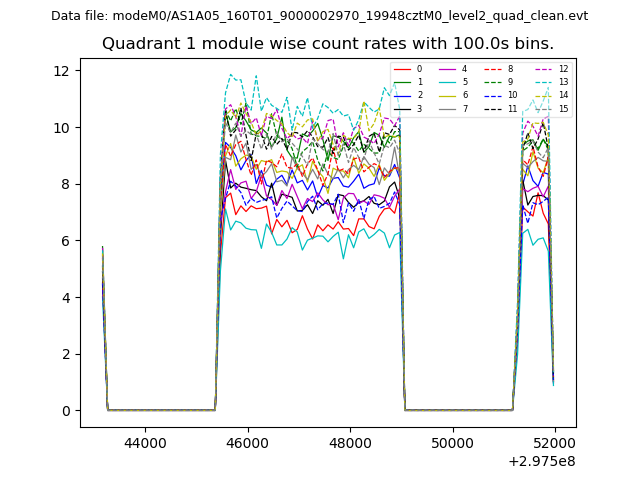
| Module-wise count rates for Quadrant A Data is divided into 100 sec bins |
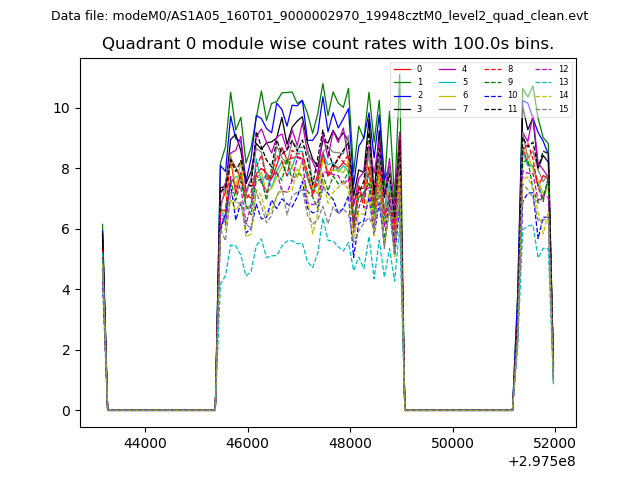 |
 |
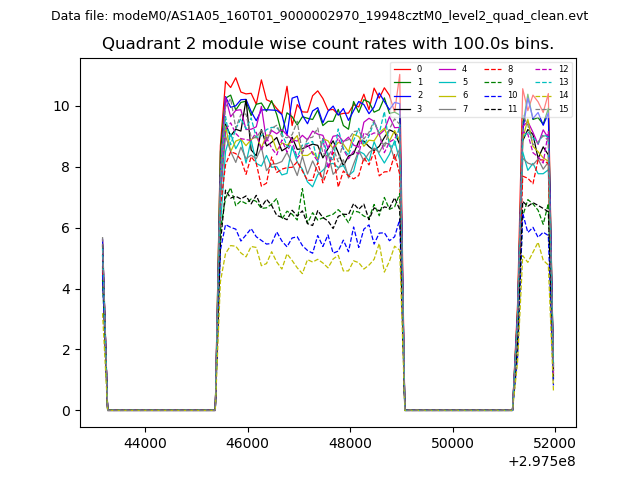
| Module-wise count rates for Quadrant B Data is divided into 100 sec bins |
 |
 |
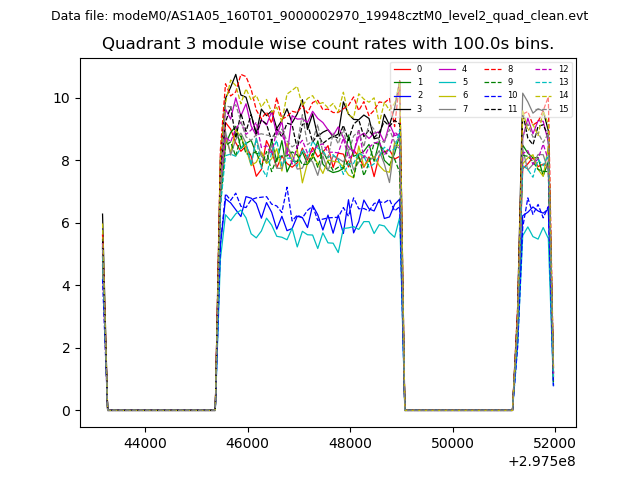
| Module-wise count rates for Quadrant C Data is divided into 100 sec bins |
 |
 |
| Module-wise count rates for Quadrant D Data is divided into 100 sec bins |
 |
 |
| Parameter | Plot |
|---|---|
| CZT HV Monitor | 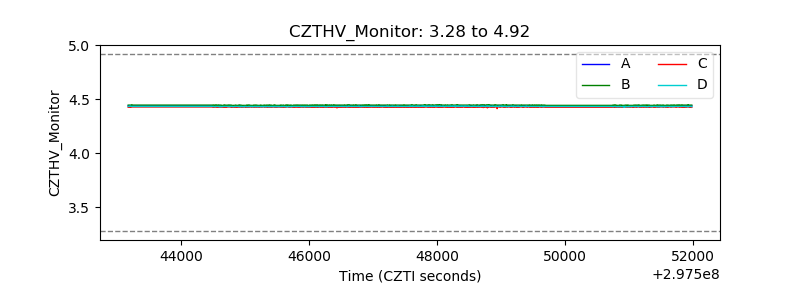 |
| D_VDD | 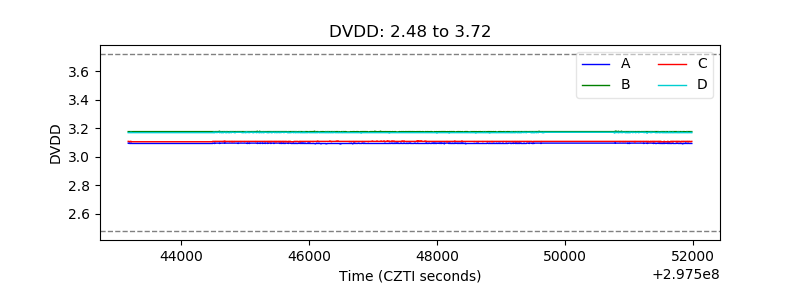 |
| Temperature 1 | 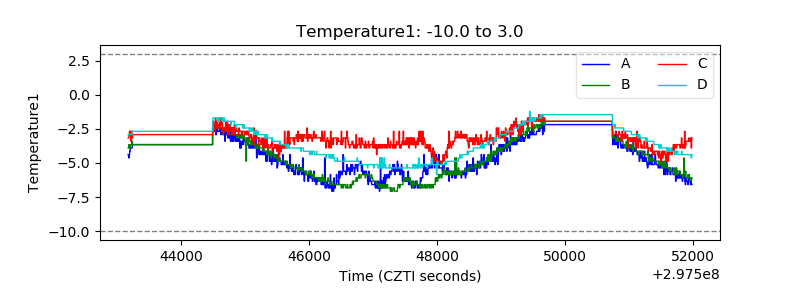 |
| Veto HV Monitor | 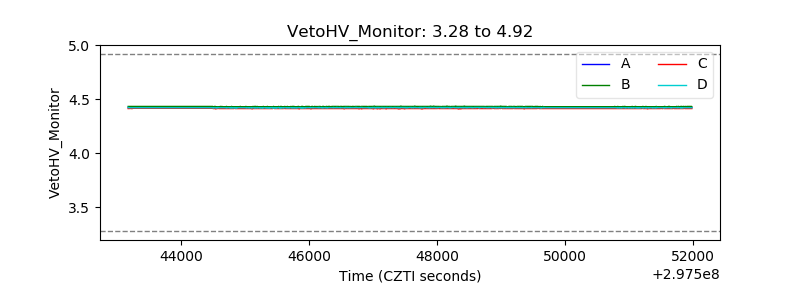 |
| Veto LLD | 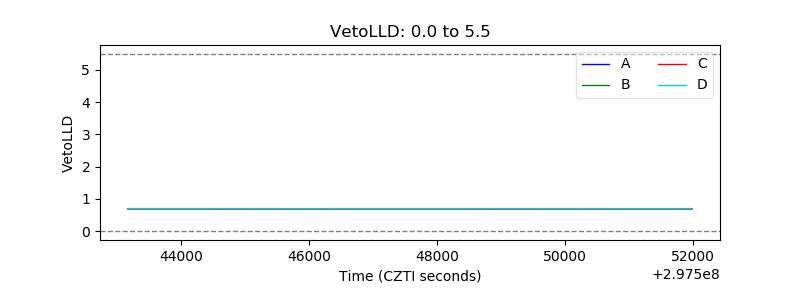 |
| Alpha Counter | 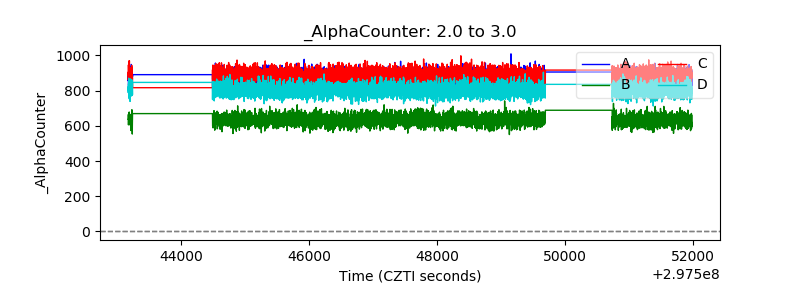 |
| _CPM_Rate | 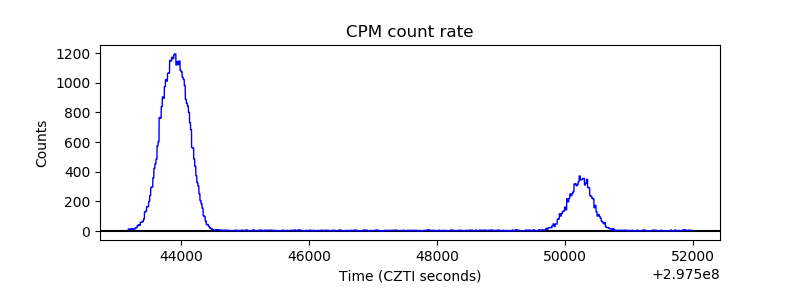 |
| CZT Counter | 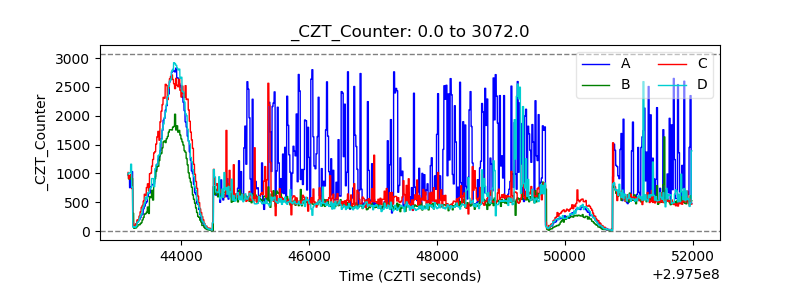 |
| +2.5 Volts monitor |  |
| +5 Volts monitor |  |
| _ROLL_ROT | 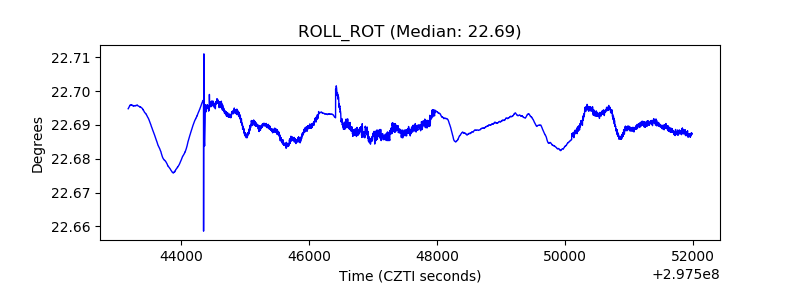 |
| _Roll_DEC | 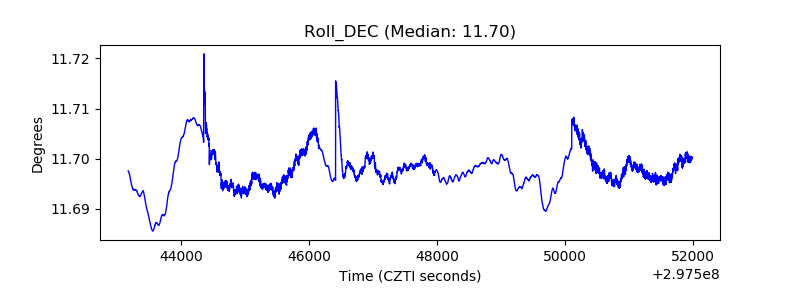 |
| _Roll_RA | 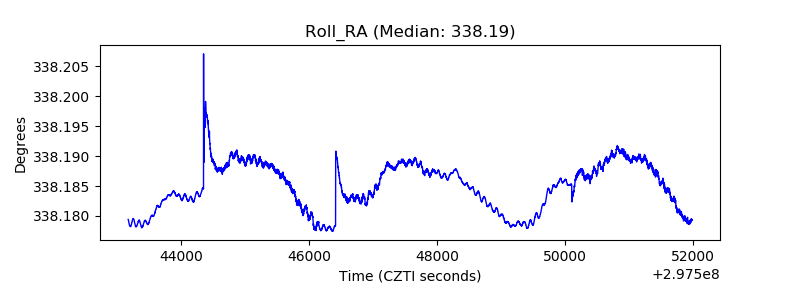 |
| Veto Counter | 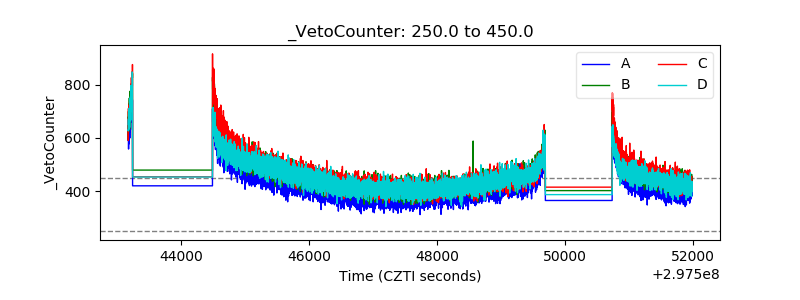 |