| Param | Original file | Final file |
|---|---|---|
| Filename | modeM0/AS1A05_160T01_9000002970_19951cztM0_level2.evt | modeM0/AS1A05_160T01_9000002970_19951cztM0_level2_quad_clean.evt |
| Size (bytes) | 1,523,419,200 | 248,077,440 |
| Size | 1.4 GB | 236.6 MB |
| Events in quadrant A | 15,342,699 | 1,500,219 |
| Events in quadrant B | 9,681,994 | 1,615,314 |
| Events in quadrant C | 10,059,466 | 1,544,238 |
| Events in quadrant D | 9,758,665 | 1,533,180 |
| Mode SS | |||
|---|---|---|---|
| Quadrant | BADHDUFLAG | Total packets | Discarded packets |
| A | 0 | 388 | 0 |
| B | 0 | 388 | 0 |
| C | 0 | 388 | 0 |
| D | 0 | 388 | 0 |
| Mode M0 | |||
|---|---|---|---|
| Quadrant | BADHDUFLAG | Total packets | Discarded packets |
| A | 0 | 58448 | 4 |
| B | 0 | 41383 | 4 |
| C | 0 | 42024 | 4 |
| D | 0 | 42437 | 4 |
| Mode M9 | |||
|---|---|---|---|
| Quadrant | BADHDUFLAG | Total packets | Discarded packets |
| A | 0 | 13 | 0 |
| B | 0 | 13 | 0 |
| C | 0 | 13 | 0 |
| D | 0 | 13 | 0 |
| Quadrant | Total seconds | Saturated seconds | Saturation percentage |
|---|---|---|---|
| A | 19167 | 2361 | 12.318047% |
| B | 19168 | 336 | 1.752922% |
| C | 19168 | 340 | 1.773790% |
| D | 19168 | 257 | 1.340776% |
Noise dominated data is calculated using 1-second bins in cleaned event files. If a bin has >2000 counts, and if more than 50% of those come from <1% of pixels, then it is considered to be noise-dominated and hence unusable.
| Quadrant | # 1 sec bins | Bins with >0 counts | Bins with >2000 counts | High rate bins dominated by noise | Noise dominated (total time) | Noise dominated (detector-on time) | Marked lightcurve |
|---|---|---|---|---|---|---|---|
| A | 20397 | 19168 | 1908 | 1908 | 9.35% | 9.95% | 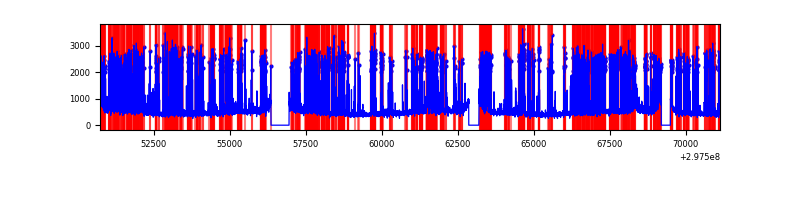 |
| B | 20398 | 19168 | 44 | 44 | 0.22% | 0.23% | 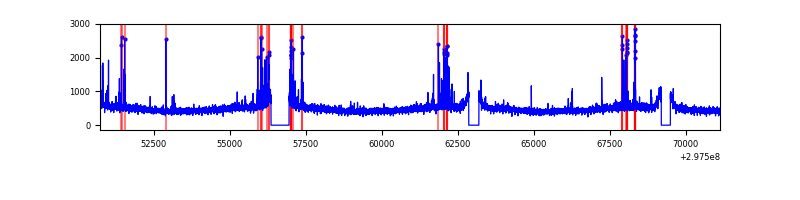 |
| C | 20398 | 19170 | 12 | 12 | 0.06% | 0.06% | 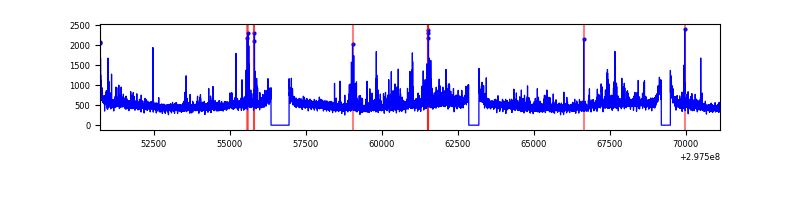 |
| D | 20398 | 19170 | 113 | 113 | 0.55% | 0.59% | 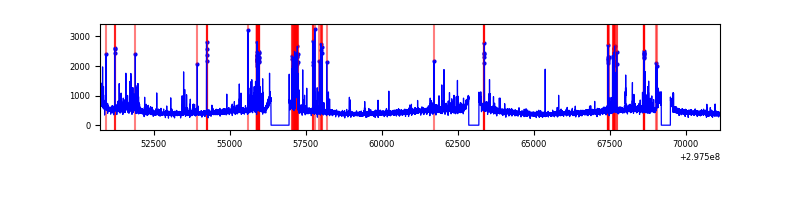 |
Top three noisy pixels from each quadrant. If the there are fewer than three noisy pixels in the level2.evt file, extra rows are filled as -1
| Pixel properties | Quadrant properties | ||||||
|---|---|---|---|---|---|---|---|
| Quadrant | DetID | PixID | Counts | Sigma | Mean | Median | Sigma |
| A | 14 | 238 | 6827742 | 15416.65 | 2211 | 2165 | 442.7 |
| A | 0 | 226 | 18717 | 37.39 | 2211 | 2165 | 442.7 |
| A | 3 | 137 | 18010 | 35.79 | 2211 | 2165 | 442.7 |
| B | 7 | 220 | 264332 | 584.44 | 2344 | 2285 | 448.4 |
| B | 0 | 197 | 59753 | 128.17 | 2344 | 2285 | 448.4 |
| B | 12 | 111 | 54582 | 116.64 | 2344 | 2285 | 448.4 |
| C | 9 | 221 | 634874 | 1193.26 | 2258 | 2278 | 530.1 |
| C | 14 | 238 | 351519 | 658.77 | 2258 | 2278 | 530.1 |
| C | 3 | 233 | 174835 | 325.49 | 2258 | 2278 | 530.1 |
| D | 1 | 52 | 763269 | 1362.67 | 2294 | 2227 | 558.5 |
| D | 2 | 234 | 107637 | 188.74 | 2294 | 2227 | 558.5 |
| D | 2 | 184 | 107376 | 188.27 | 2294 | 2227 | 558.5 |
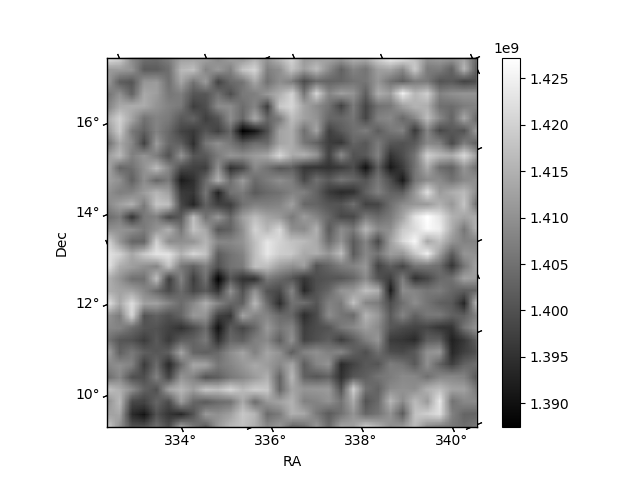
Histogram calculated using DETX and DETY for each event in the final _common_clean file
| Quadrant A | 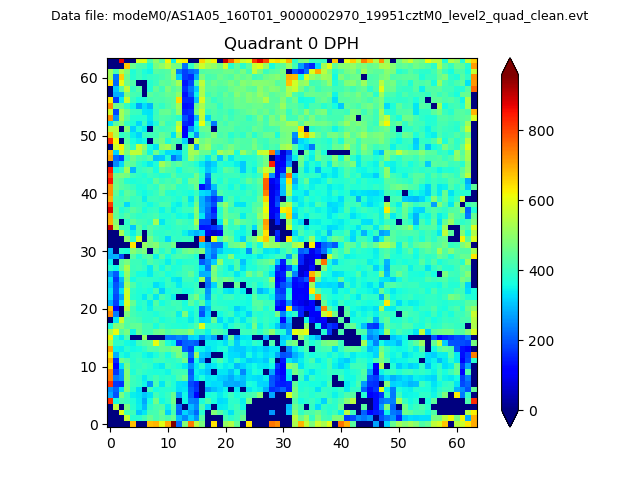 |
 |
Quadrant B |
|---|---|---|---|
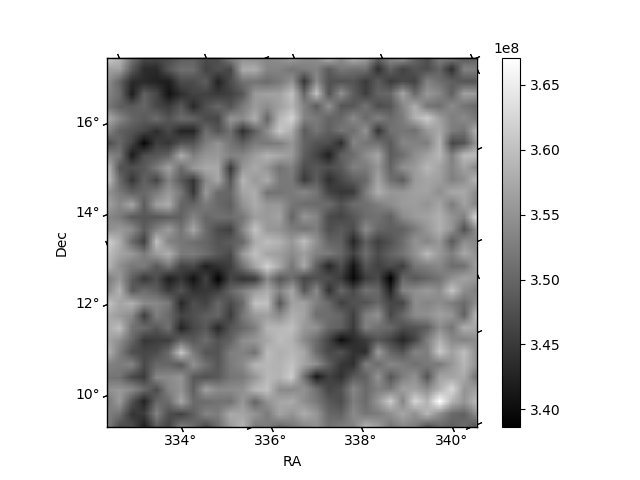
| Quadrant D | 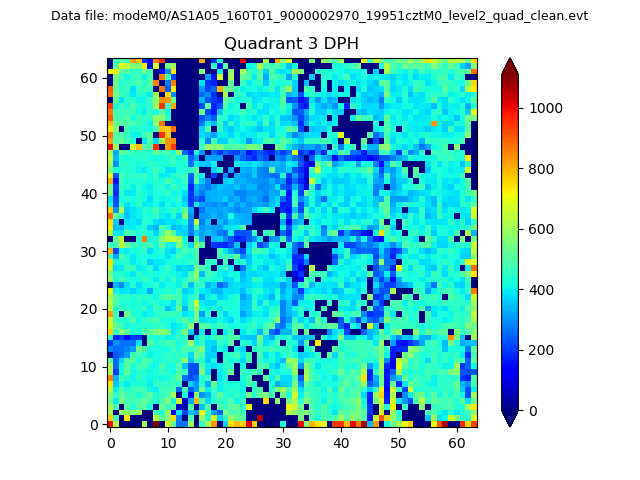 |
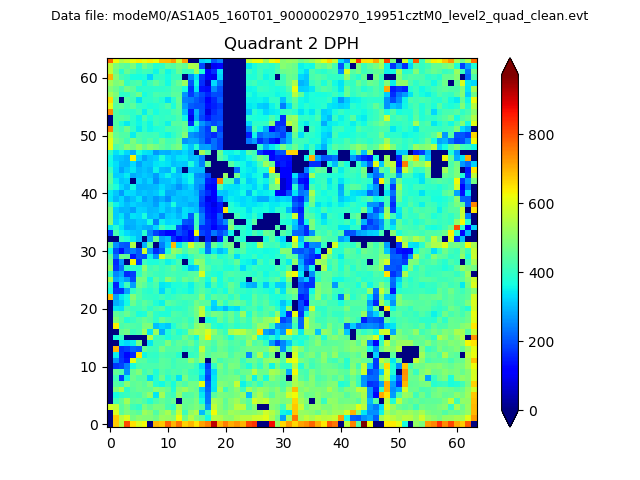 |
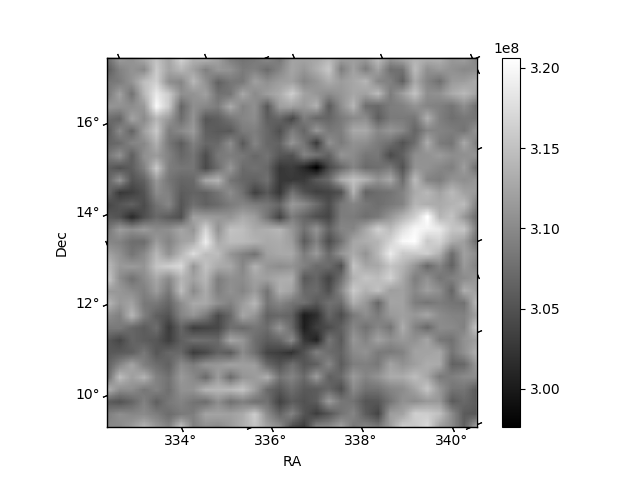
Quadrant C |
| Plot type | Count rate plots | Images |
|---|---|---|
| Comparison with Poisson distribution Blue bars denote a histogram of data divided into 1 sec bins. Red curve is a Poisson curve with rate = median count rate of data. |
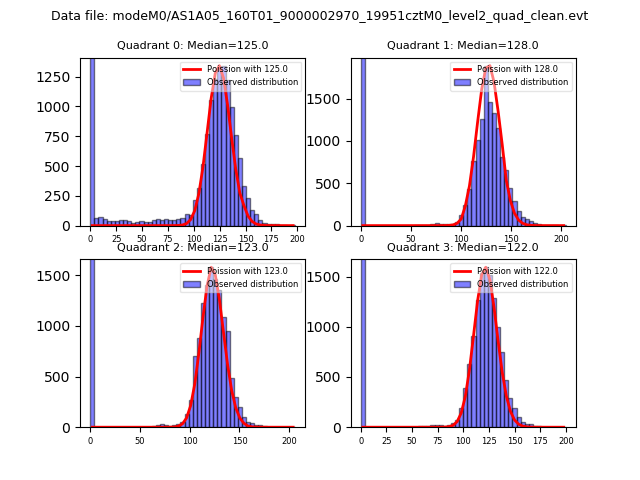 |
 |
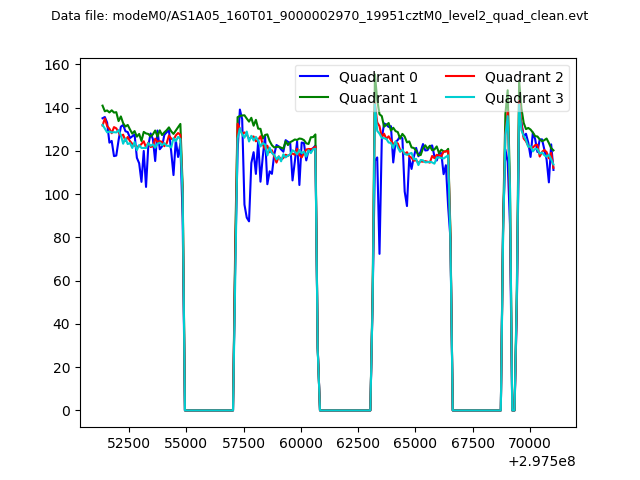
| Quadrant-wise count rates Data is divided into 100 sec bins |
 |
|
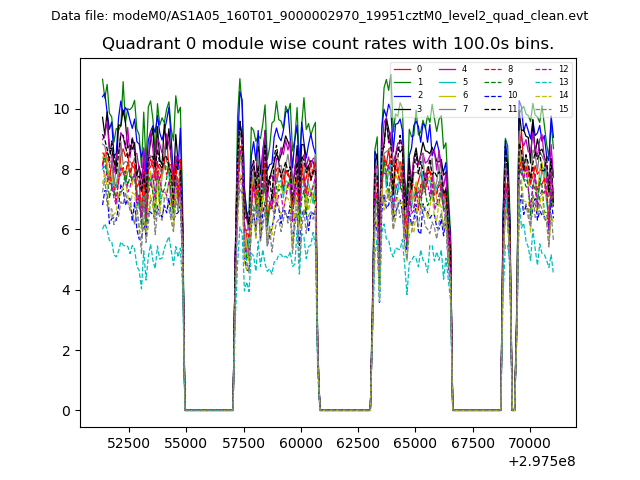
| Module-wise count rates for Quadrant A Data is divided into 100 sec bins |
 |
 |
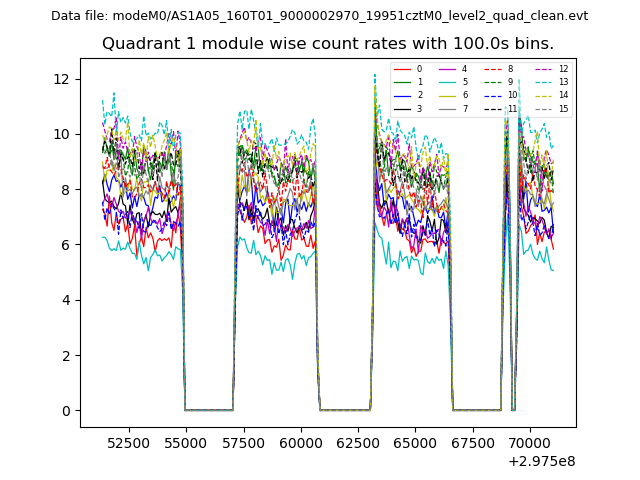
| Module-wise count rates for Quadrant B Data is divided into 100 sec bins |
 |
 |
| Module-wise count rates for Quadrant C Data is divided into 100 sec bins |
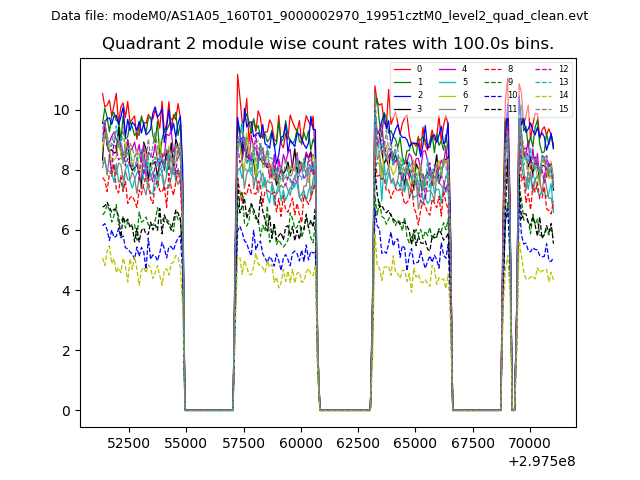 |
 |
| Module-wise count rates for Quadrant D Data is divided into 100 sec bins |
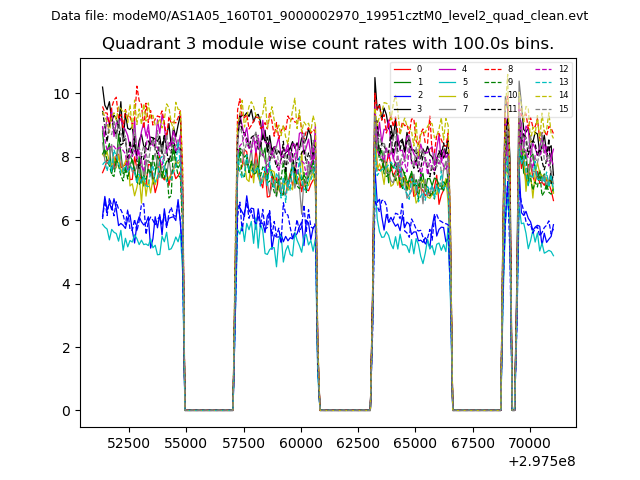 |
 |
| Parameter | Plot |
|---|---|
| CZT HV Monitor | 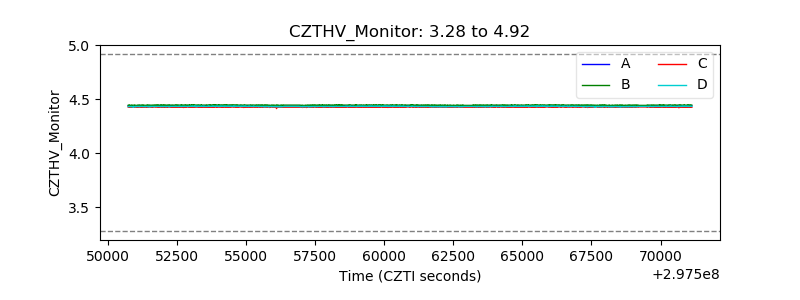 |
| D_VDD | 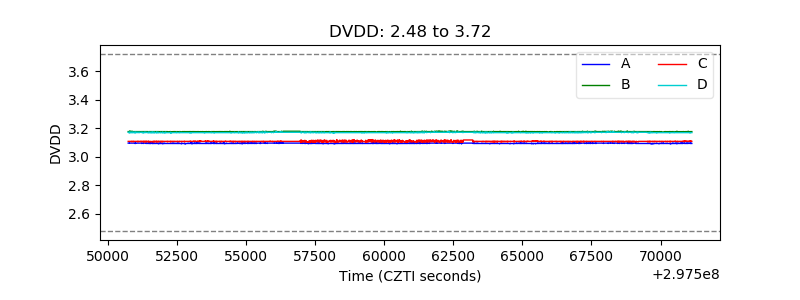 |
| Temperature 1 | 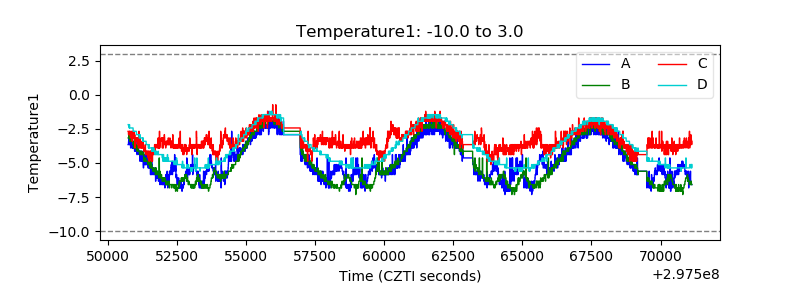 |
| Veto HV Monitor | 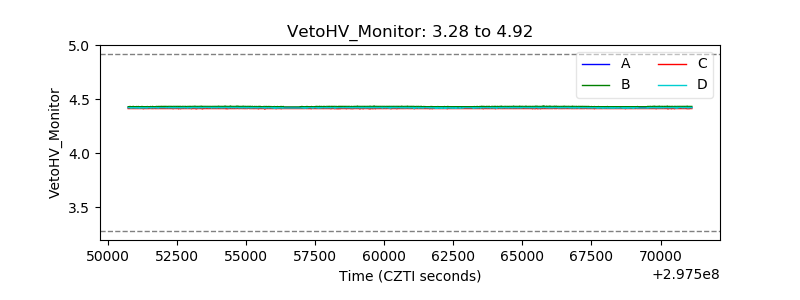 |
| Veto LLD | 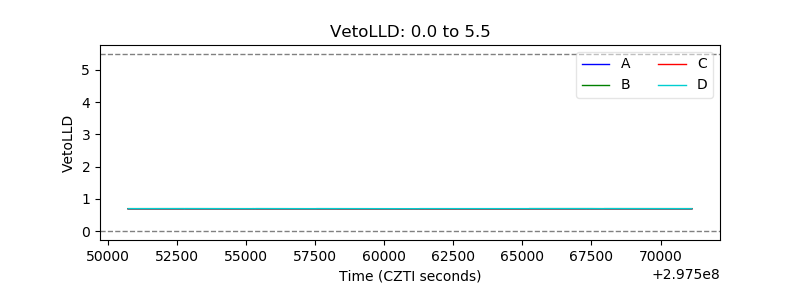 |
| Alpha Counter | 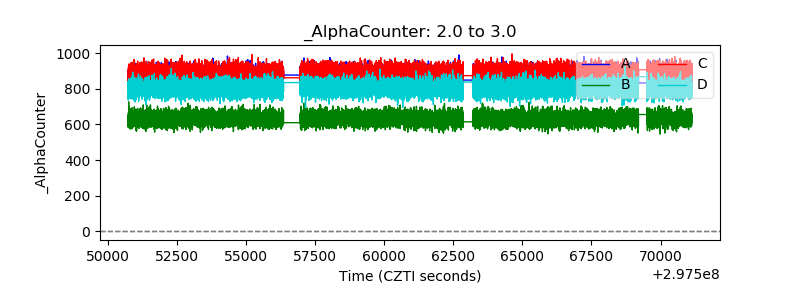 |
| _CPM_Rate | 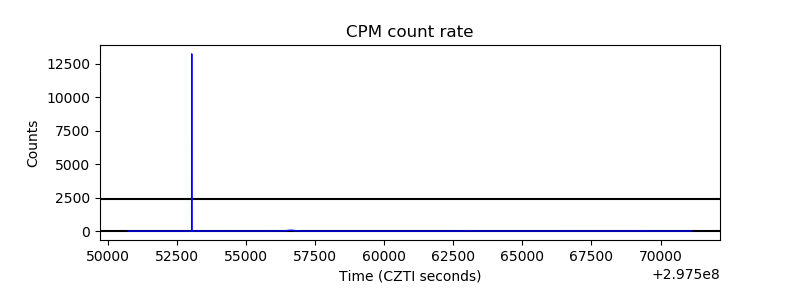 |
| CZT Counter | 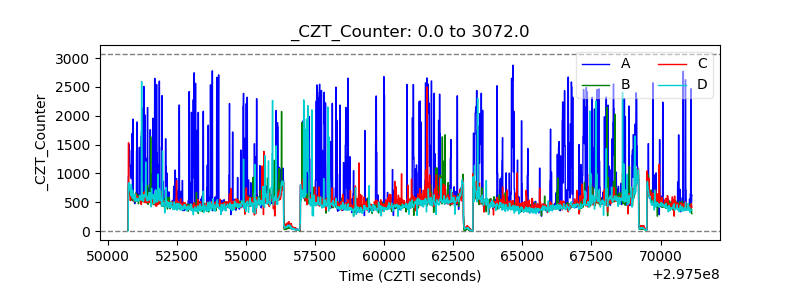 |
| +2.5 Volts monitor | 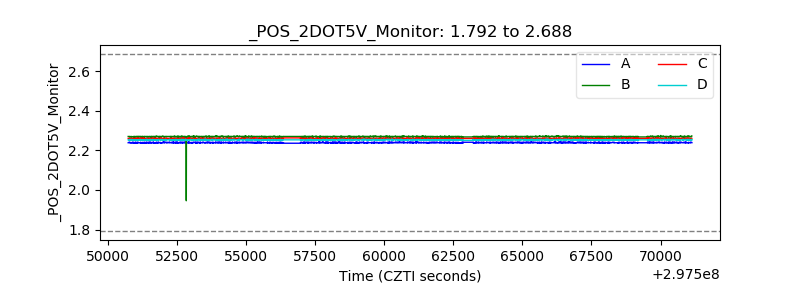 |
| +5 Volts monitor |  |
| _ROLL_ROT | 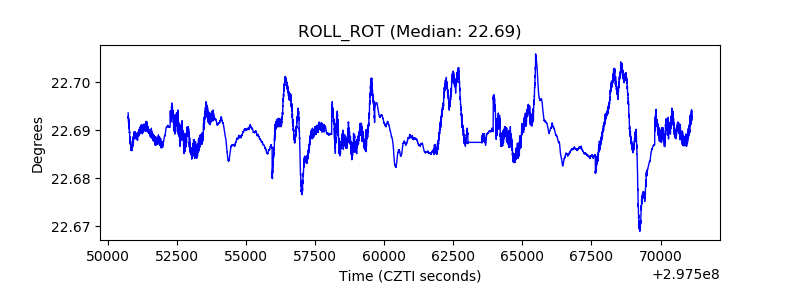 |
| _Roll_DEC |  |
| _Roll_RA | 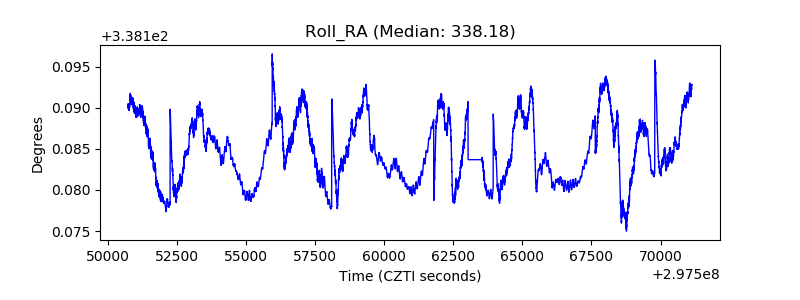 |
| Veto Counter | 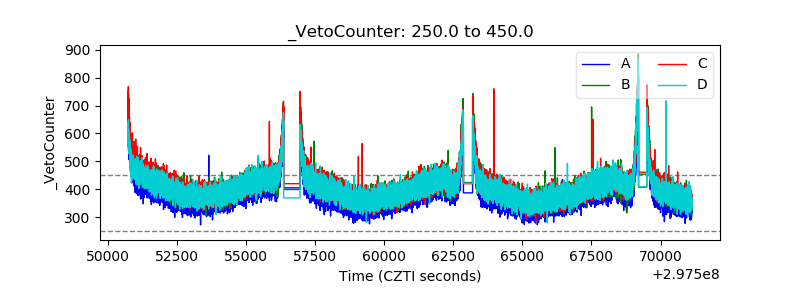 |