| Param | Original file | Final file |
|---|---|---|
| Filename | modeM0/AS1A05_160T01_9000002970_19954cztM0_level2.evt | modeM0/AS1A05_160T01_9000002970_19954cztM0_level2_quad_clean.evt |
| Size (bytes) | 1,612,428,480 | 237,000,960 |
| Size | 1.5 GB | 226.0 MB |
| Events in quadrant A | 17,691,810 | 1,341,048 |
| Events in quadrant B | 9,535,681 | 1,560,110 |
| Events in quadrant C | 10,614,972 | 1,488,381 |
| Events in quadrant D | 9,686,342 | 1,457,267 |
| Mode SS | |||
|---|---|---|---|
| Quadrant | BADHDUFLAG | Total packets | Discarded packets |
| A | 0 | 394 | 0 |
| B | 0 | 394 | 0 |
| C | 0 | 394 | 0 |
| D | 0 | 394 | 0 |
| Mode M0 | |||
|---|---|---|---|
| Quadrant | BADHDUFLAG | Total packets | Discarded packets |
| A | 0 | 65327 | 5 |
| B | 0 | 40817 | 4 |
| C | 0 | 43696 | 4 |
| D | 0 | 42249 | 4 |
| Mode M9 | |||
|---|---|---|---|
| Quadrant | BADHDUFLAG | Total packets | Discarded packets |
| A | 0 | 22 | 0 |
| B | 0 | 22 | 0 |
| C | 0 | 22 | 0 |
| D | 0 | 22 | 0 |
| Quadrant | Total seconds | Saturated seconds | Saturation percentage |
|---|---|---|---|
| A | 19306 | 3764 | 19.496530% |
| B | 19306 | 299 | 1.548741% |
| C | 19307 | 527 | 2.729580% |
| D | 19307 | 388 | 2.009634% |
Noise dominated data is calculated using 1-second bins in cleaned event files. If a bin has >2000 counts, and if more than 50% of those come from <1% of pixels, then it is considered to be noise-dominated and hence unusable.
| Quadrant | # 1 sec bins | Bins with >0 counts | Bins with >2000 counts | High rate bins dominated by noise | Noise dominated (total time) | Noise dominated (detector-on time) | Marked lightcurve |
|---|---|---|---|---|---|---|---|
| A | 21506 | 19306 | 3096 | 3096 | 14.40% | 16.04% | 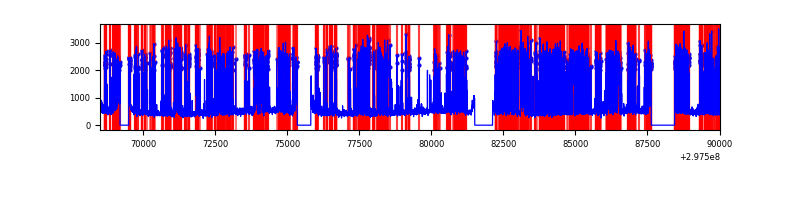 |
| B | 21506 | 19306 | 46 | 46 | 0.21% | 0.24% | 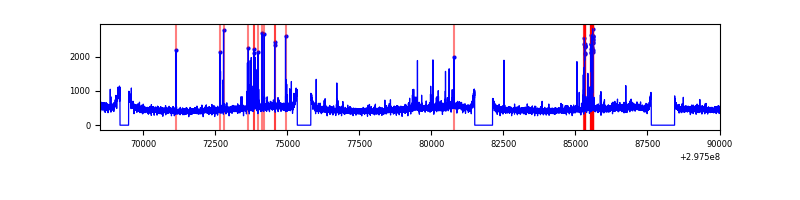 |
| C | 21507 | 19308 | 174 | 174 | 0.81% | 0.90% | 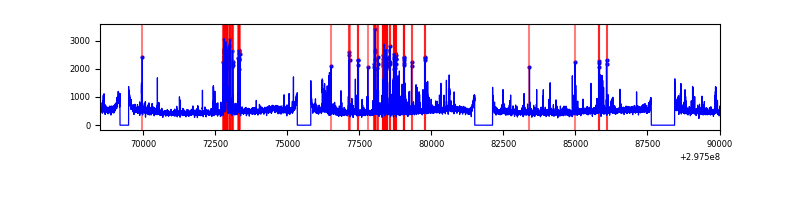 |
| D | 21507 | 19309 | 250 | 250 | 1.16% | 1.29% | 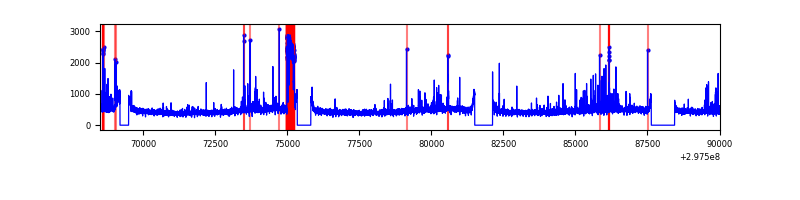 |
Top three noisy pixels from each quadrant. If the there are fewer than three noisy pixels in the level2.evt file, extra rows are filled as -1
| Pixel properties | Quadrant properties | ||||||
|---|---|---|---|---|---|---|---|
| Quadrant | DetID | PixID | Counts | Sigma | Mean | Median | Sigma |
| A | 14 | 238 | 9389600 | 22272.87 | 2090 | 2045 | 421.5 |
| A | 5 | 16 | 170652 | 400.04 | 2090 | 2045 | 421.5 |
| A | 14 | 254 | 81431 | 188.35 | 2090 | 2045 | 421.5 |
| B | 7 | 220 | 202049 | 448.76 | 2335 | 2273 | 445.2 |
| B | 12 | 111 | 55766 | 120.16 | 2335 | 2273 | 445.2 |
| B | 11 | 111 | 48826 | 104.57 | 2335 | 2273 | 445.2 |
| C | 3 | 233 | 758086 | 1442.51 | 2241 | 2258 | 524.0 |
| C | 9 | 221 | 740763 | 1409.45 | 2241 | 2258 | 524.0 |
| C | 14 | 238 | 344255 | 652.71 | 2241 | 2258 | 524.0 |
| D | 7 | 238 | 575199 | 1027.13 | 2277 | 2209 | 557.9 |
| D | 1 | 52 | 253379 | 450.24 | 2277 | 2209 | 557.9 |
| D | 12 | 233 | 127575 | 224.73 | 2277 | 2209 | 557.9 |
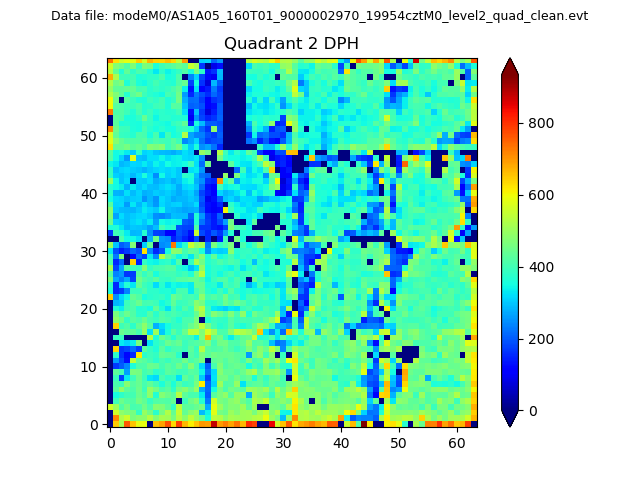
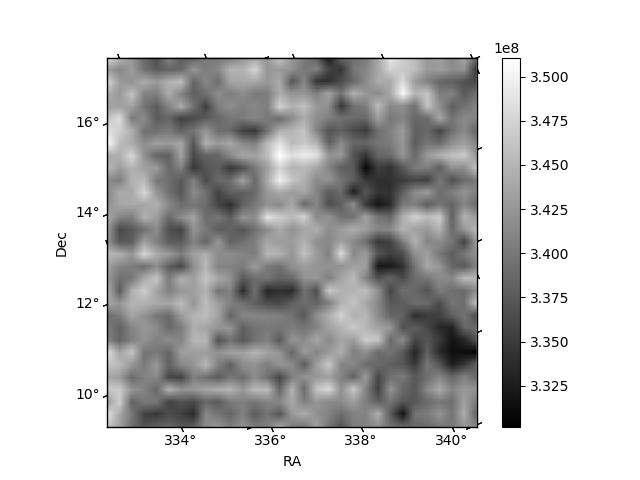
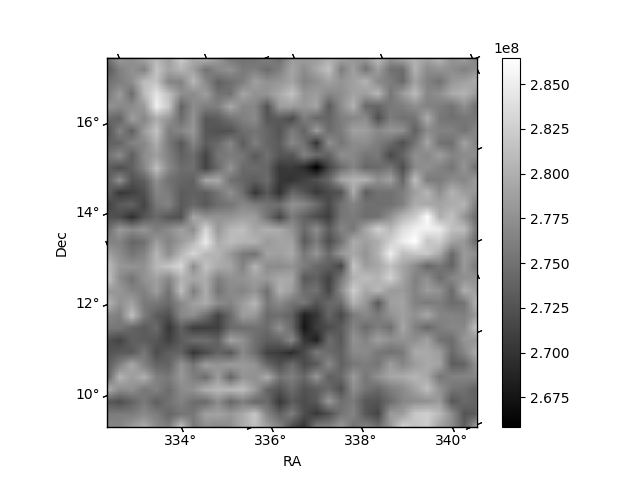
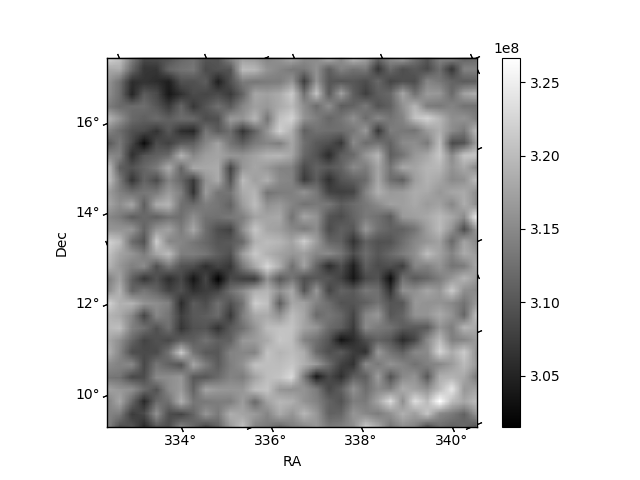
Histogram calculated using DETX and DETY for each event in the final _common_clean file
| Quadrant A |  |
 |
Quadrant B |
|---|---|---|---|
| Quadrant D | 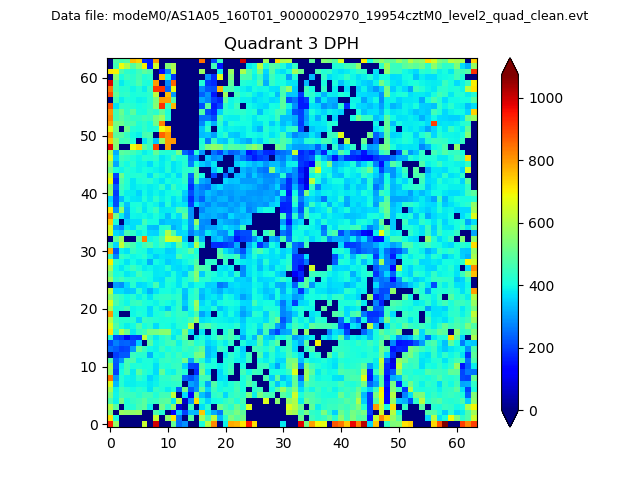 |
 |
Quadrant C |
| Plot type | Count rate plots | Images |
|---|---|---|
| Comparison with Poisson distribution Blue bars denote a histogram of data divided into 1 sec bins. Red curve is a Poisson curve with rate = median count rate of data. |
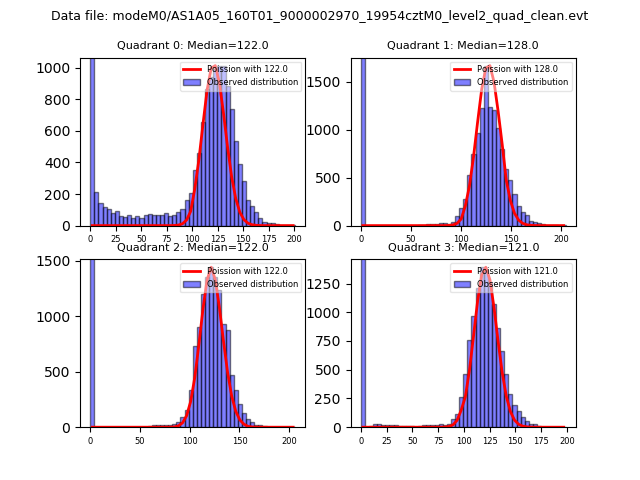 |
 |
| Quadrant-wise count rates Data is divided into 100 sec bins |
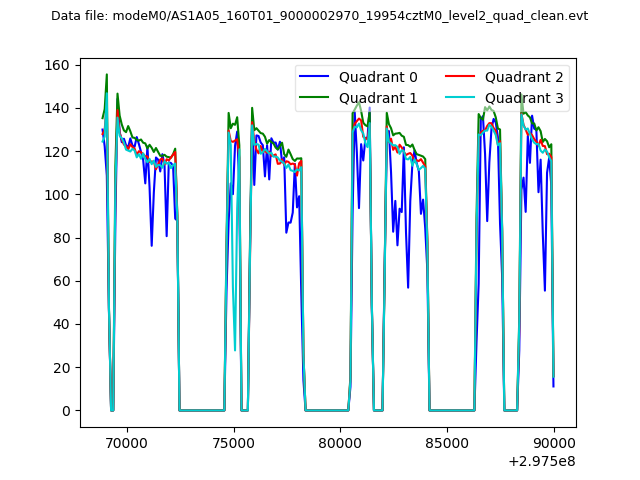 |
|
| Module-wise count rates for Quadrant A Data is divided into 100 sec bins |
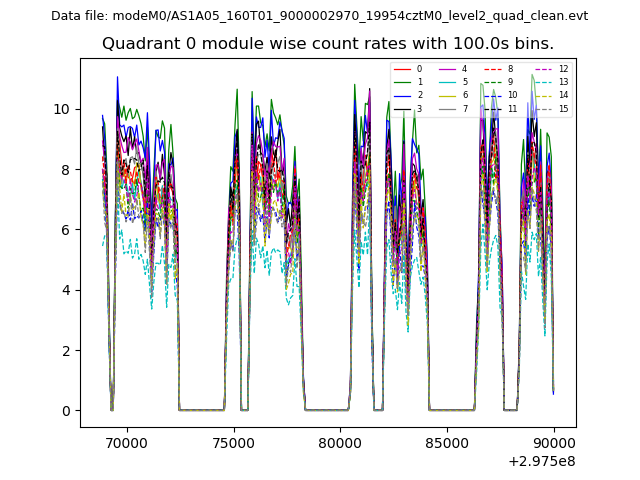 |
 |
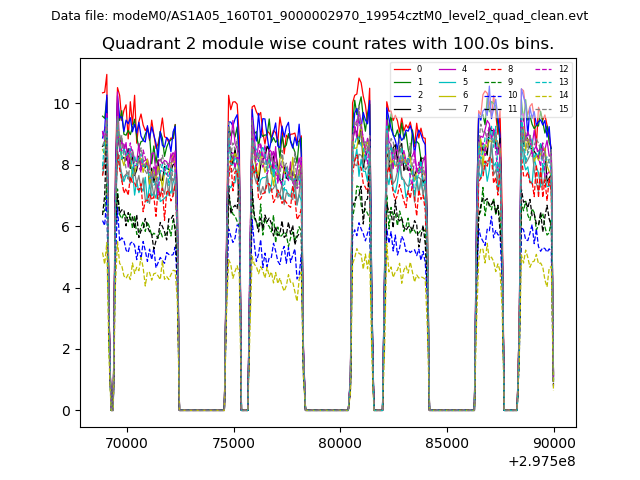
| Module-wise count rates for Quadrant B Data is divided into 100 sec bins |
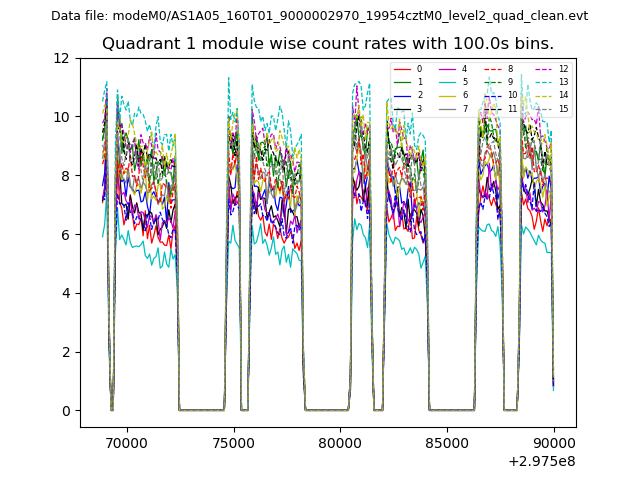 |
 |
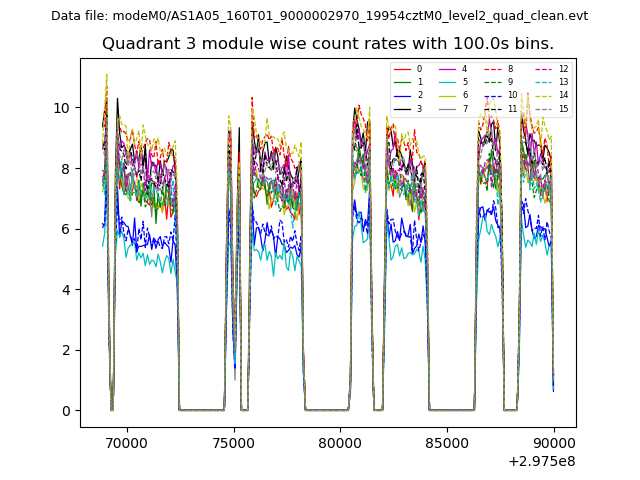
| Module-wise count rates for Quadrant C Data is divided into 100 sec bins |
 |
 |
| Module-wise count rates for Quadrant D Data is divided into 100 sec bins |
 |
 |
| Parameter | Plot |
|---|---|
| CZT HV Monitor | 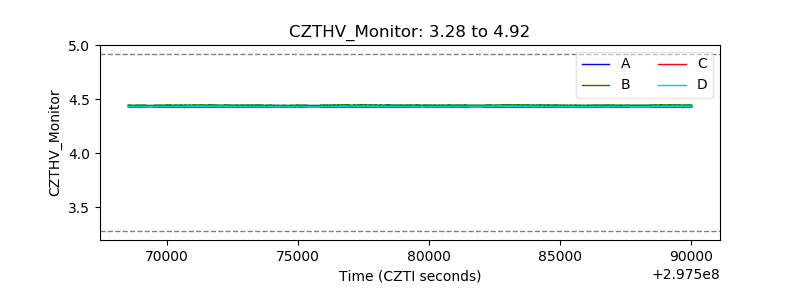 |
| D_VDD | 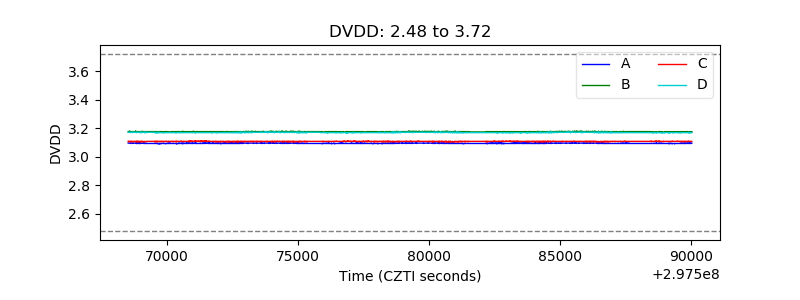 |
| Temperature 1 | 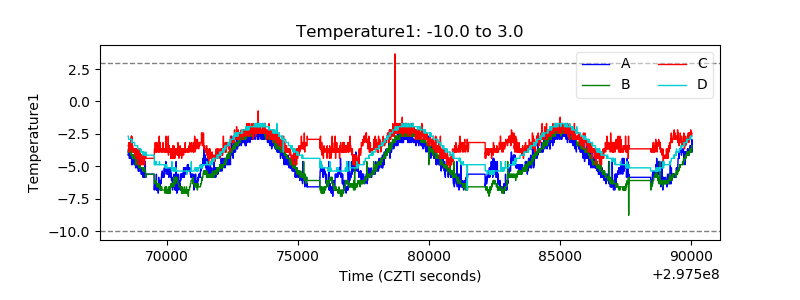 |
| Veto HV Monitor | 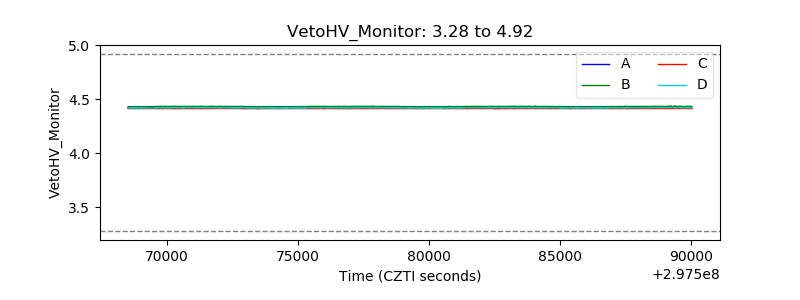 |
| Veto LLD | 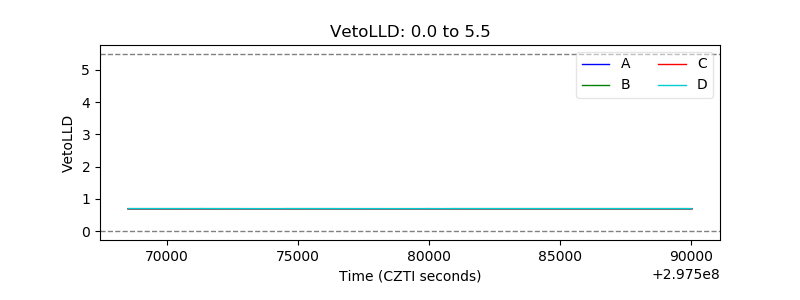 |
| Alpha Counter | 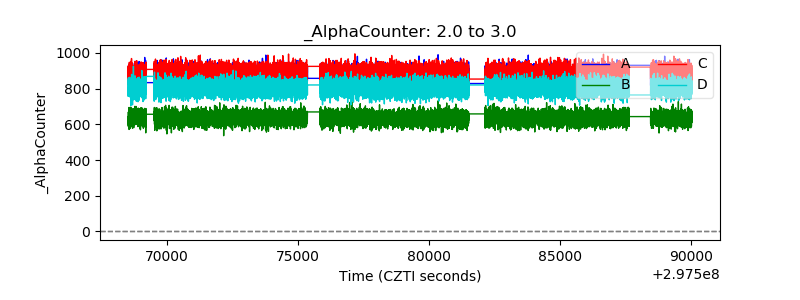 |
| _CPM_Rate | 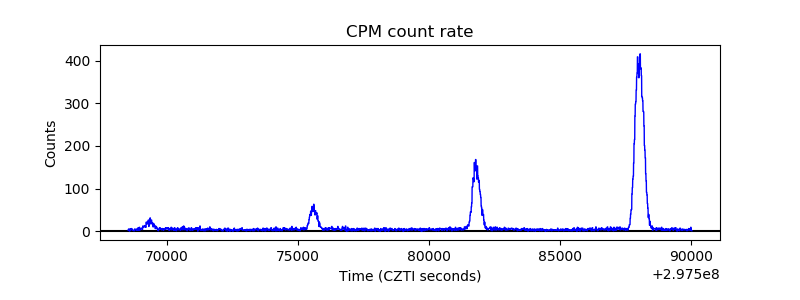 |
| CZT Counter | 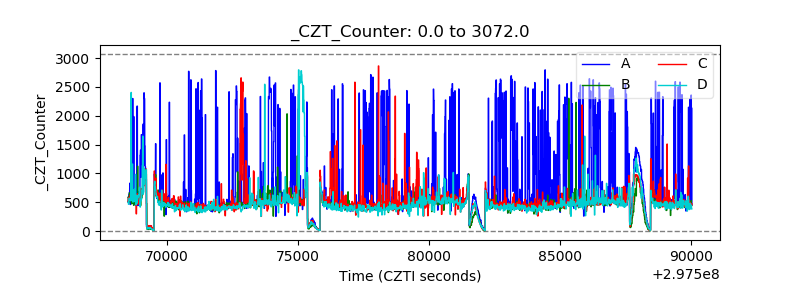 |
| +2.5 Volts monitor |  |
| +5 Volts monitor |  |
| _ROLL_ROT | 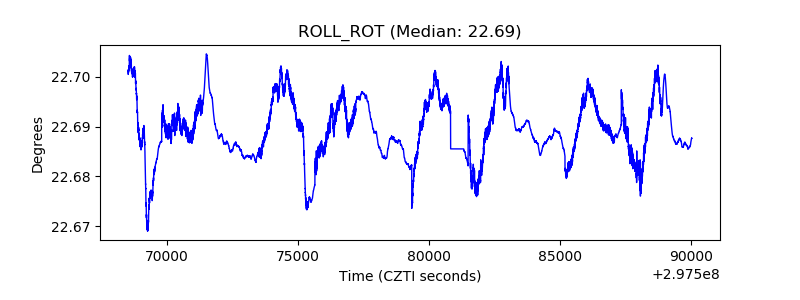 |
| _Roll_DEC | 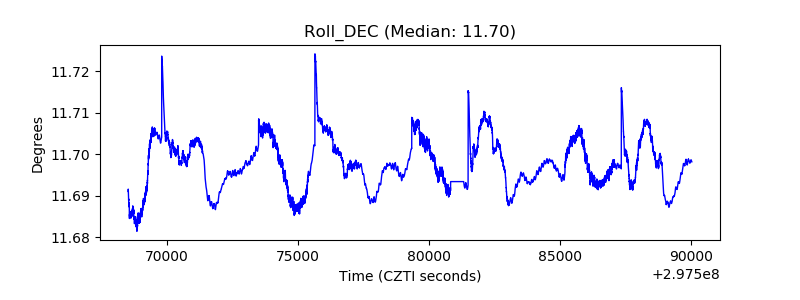 |
| _Roll_RA |  |
| Veto Counter | 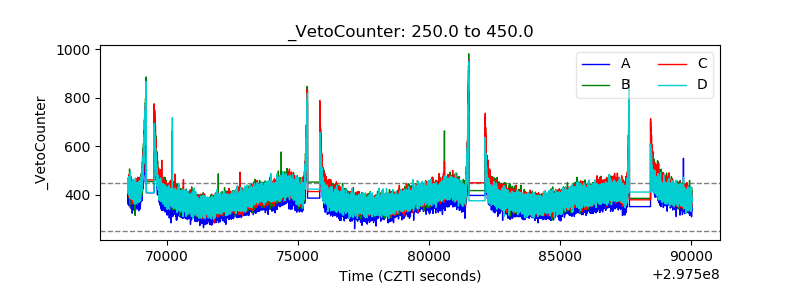 |