| Param | Original file | Final file |
|---|---|---|
| Filename | modeM0/AS1A05_160T01_9000002970_19955cztM0_level2.evt | modeM0/AS1A05_160T01_9000002970_19955cztM0_level2_quad_clean.evt |
| Size (bytes) | 600,451,200 | 73,149,120 |
| Size | 572.6 MB | 69.8 MB |
| Events in quadrant A | 6,157,926 | 423,751 |
| Events in quadrant B | 3,070,162 | 480,982 |
| Events in quadrant C | 3,516,740 | 456,513 |
| Events in quadrant D | 5,021,607 | 422,370 |
| Mode SS | |||
|---|---|---|---|
| Quadrant | BADHDUFLAG | Total packets | Discarded packets |
| A | 0 | 126 | 0 |
| B | 0 | 126 | 0 |
| C | 0 | 126 | 0 |
| D | 0 | 126 | 0 |
| Mode M0 | |||
|---|---|---|---|
| Quadrant | BADHDUFLAG | Total packets | Discarded packets |
| A | 0 | 22232 | 1 |
| B | 0 | 12827 | 1 |
| C | 0 | 14252 | 1 |
| D | 0 | 19115 | 1 |
| Mode M9 | |||
|---|---|---|---|
| Quadrant | BADHDUFLAG | Total packets | Discarded packets |
| A | 0 | 10 | 0 |
| B | 0 | 10 | 0 |
| C | 0 | 10 | 0 |
| D | 0 | 10 | 0 |
| Quadrant | Total seconds | Saturated seconds | Saturation percentage |
|---|---|---|---|
| A | 6169 | 1378 | 22.337494% |
| B | 6169 | 54 | 0.875344% |
| C | 6169 | 115 | 1.864160% |
| D | 6170 | 856 | 13.873582% |
Noise dominated data is calculated using 1-second bins in cleaned event files. If a bin has >2000 counts, and if more than 50% of those come from <1% of pixels, then it is considered to be noise-dominated and hence unusable.
| Quadrant | # 1 sec bins | Bins with >0 counts | Bins with >2000 counts | High rate bins dominated by noise | Noise dominated (total time) | Noise dominated (detector-on time) | Marked lightcurve |
|---|---|---|---|---|---|---|---|
| A | 7129 | 6169 | 1134 | 1134 | 15.91% | 18.38% | 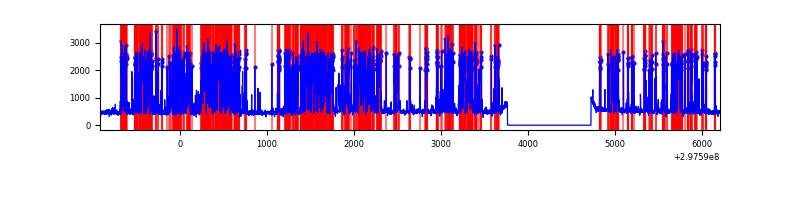 |
| B | 7129 | 6169 | 10 | 10 | 0.14% | 0.16% | 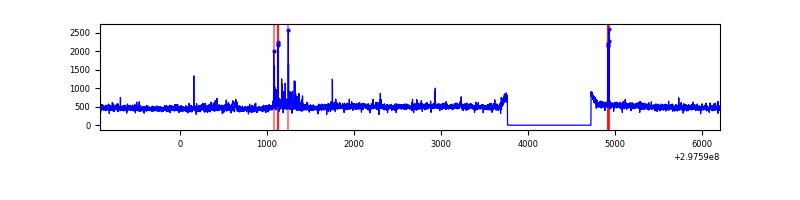 |
| C | 7129 | 6169 | 39 | 39 | 0.55% | 0.63% | 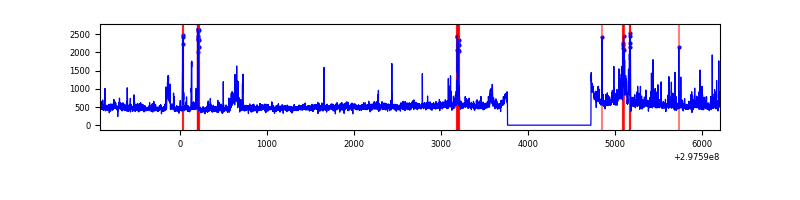 |
| D | 7130 | 6170 | 642 | 642 | 9.00% | 10.41% | 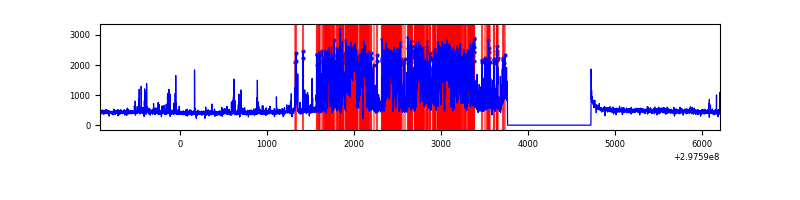 |
Top three noisy pixels from each quadrant. If the there are fewer than three noisy pixels in the level2.evt file, extra rows are filled as -1
| Pixel properties | Quadrant properties | ||||||
|---|---|---|---|---|---|---|---|
| Quadrant | DetID | PixID | Counts | Sigma | Mean | Median | Sigma |
| A | 14 | 238 | 3077783 | 22657.5 | 665 | 653 | 135.8 |
| A | 5 | 16 | 484075 | 3559.53 | 665 | 653 | 135.8 |
| A | 14 | 254 | 33200 | 239.65 | 665 | 653 | 135.8 |
| B | 7 | 220 | 52923 | 359.3 | 752 | 733 | 145.3 |
| B | 0 | 230 | 23473 | 156.55 | 752 | 733 | 145.3 |
| B | 0 | 214 | 21529 | 143.17 | 752 | 733 | 145.3 |
| C | 3 | 233 | 431343 | 2557.24 | 719 | 723 | 168.4 |
| C | 9 | 221 | 160819 | 950.73 | 719 | 723 | 168.4 |
| C | 14 | 238 | 112483 | 663.69 | 719 | 723 | 168.4 |
| D | 12 | 218 | 2033474 | 11896.95 | 693 | 672 | 170.9 |
| D | 12 | 233 | 196500 | 1146.08 | 693 | 672 | 170.9 |
| D | 12 | 250 | 89449 | 519.57 | 693 | 672 | 170.9 |
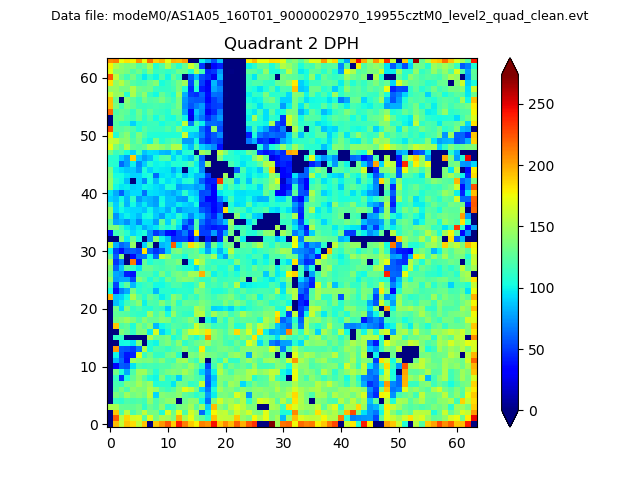
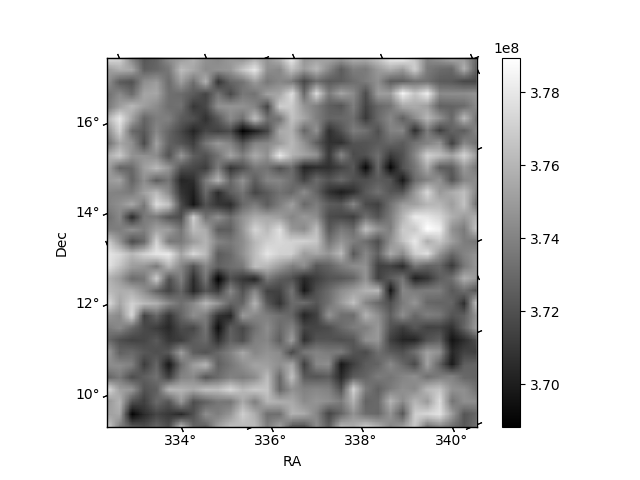
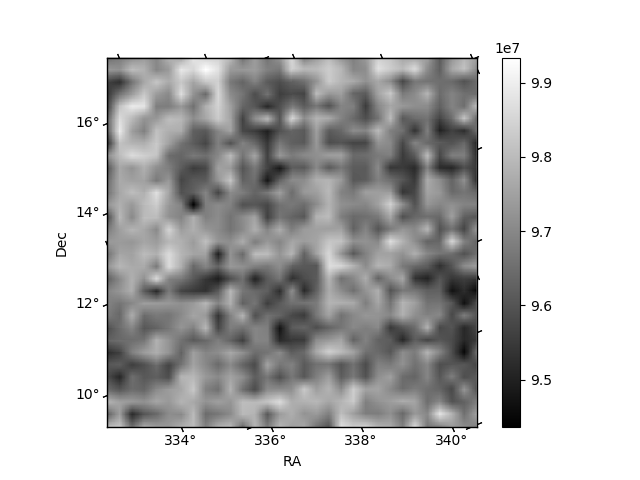
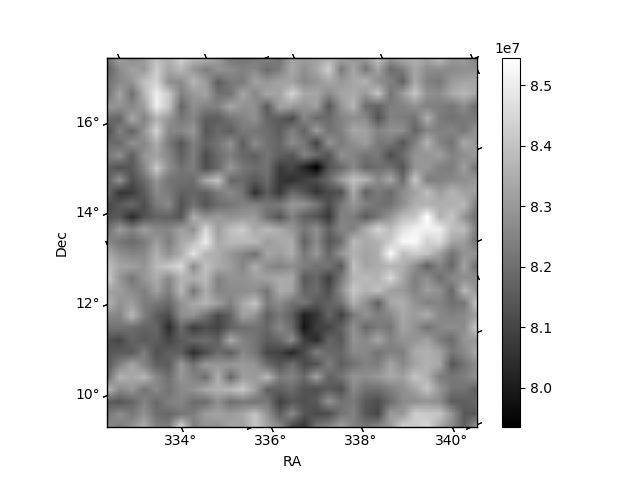
Histogram calculated using DETX and DETY for each event in the final _common_clean file
| Quadrant A | 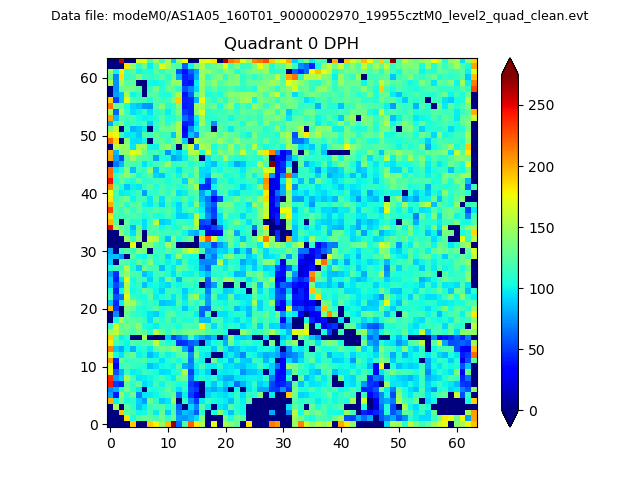 |
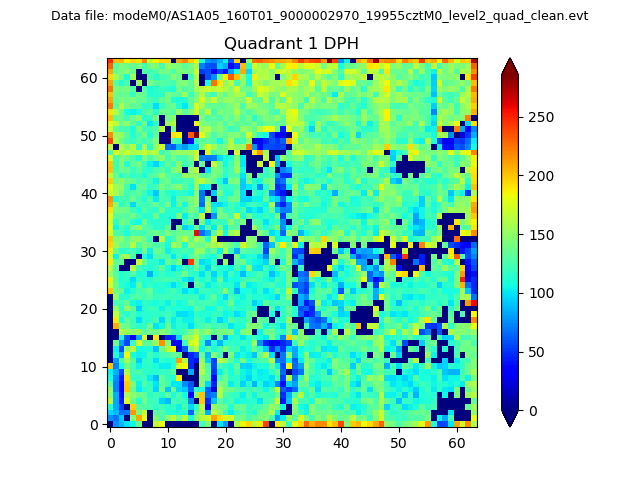 |
Quadrant B |
|---|---|---|---|
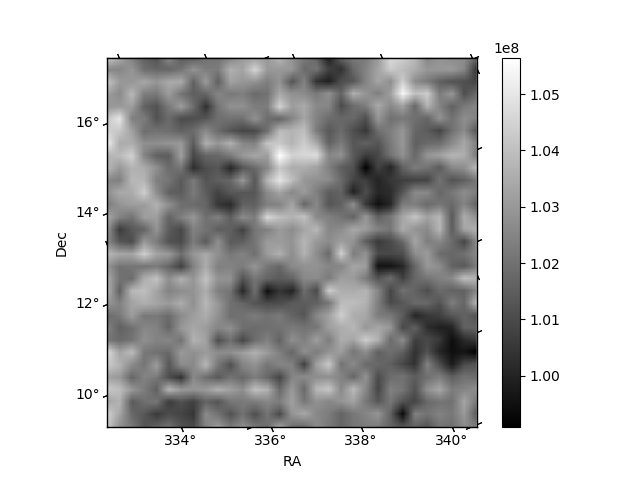
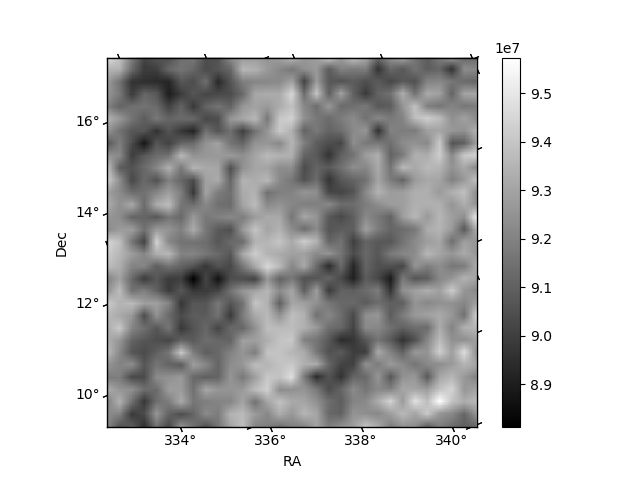
| Quadrant D | 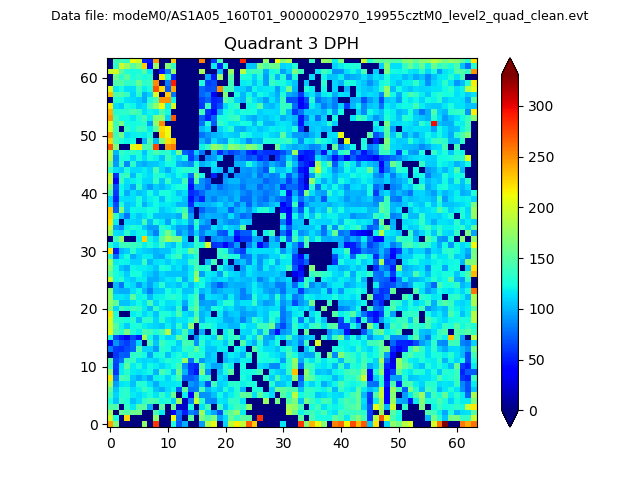 |
 |
Quadrant C |
| Plot type | Count rate plots | Images |
|---|---|---|
| Comparison with Poisson distribution Blue bars denote a histogram of data divided into 1 sec bins. Red curve is a Poisson curve with rate = median count rate of data. |
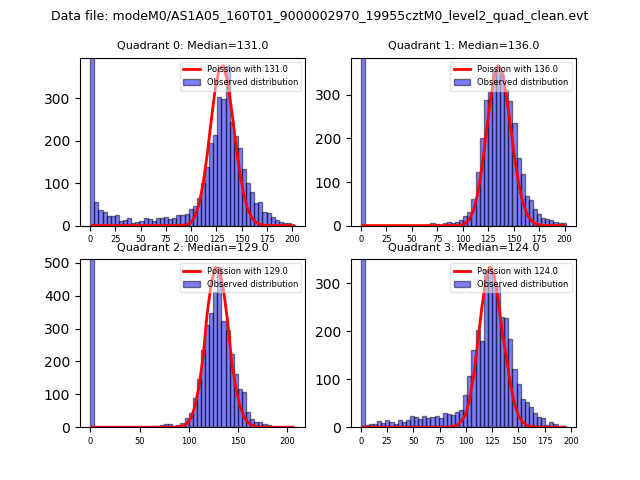 |
 |
| Quadrant-wise count rates Data is divided into 100 sec bins |
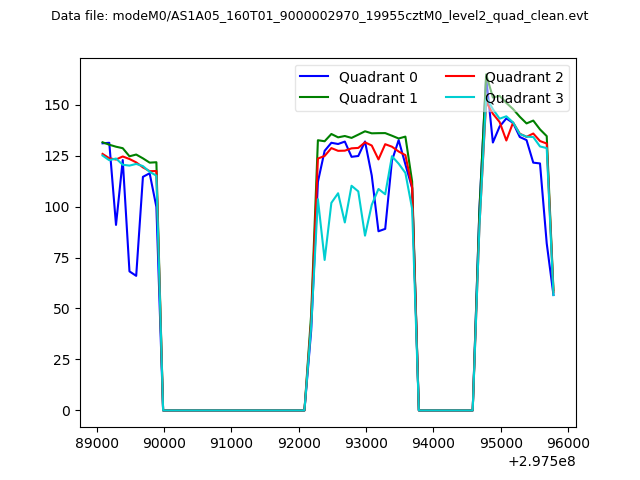 |
|
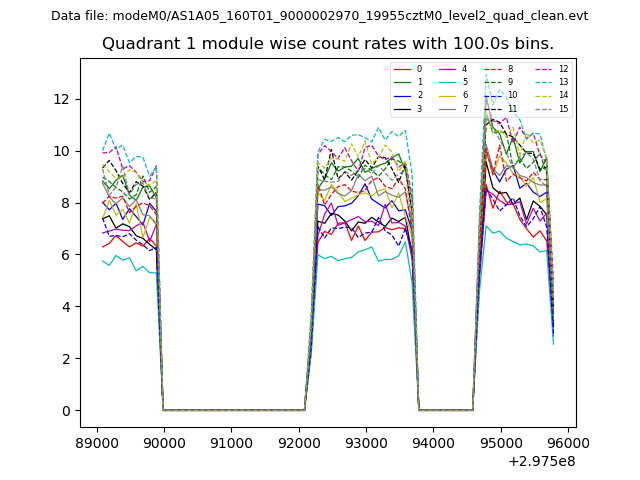
| Module-wise count rates for Quadrant A Data is divided into 100 sec bins |
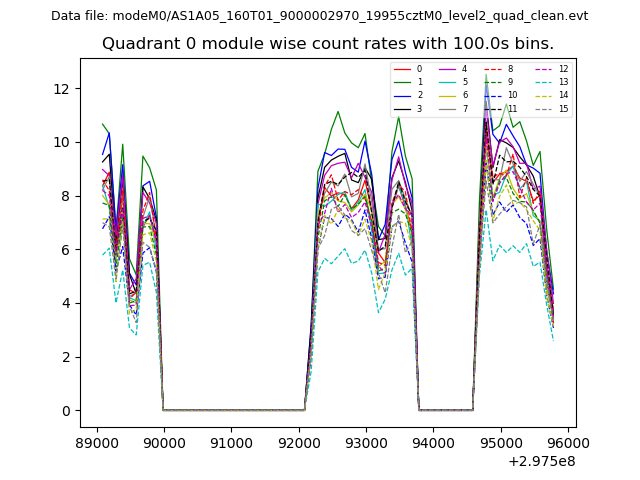 |
 |
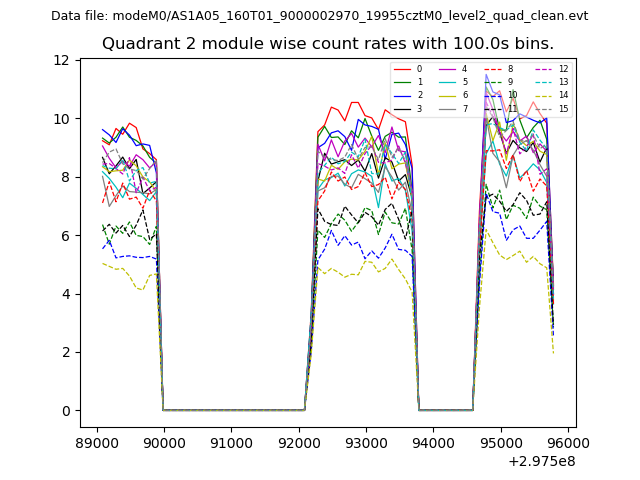
| Module-wise count rates for Quadrant B Data is divided into 100 sec bins |
 |
 |
| Module-wise count rates for Quadrant C Data is divided into 100 sec bins |
 |
 |
| Module-wise count rates for Quadrant D Data is divided into 100 sec bins |
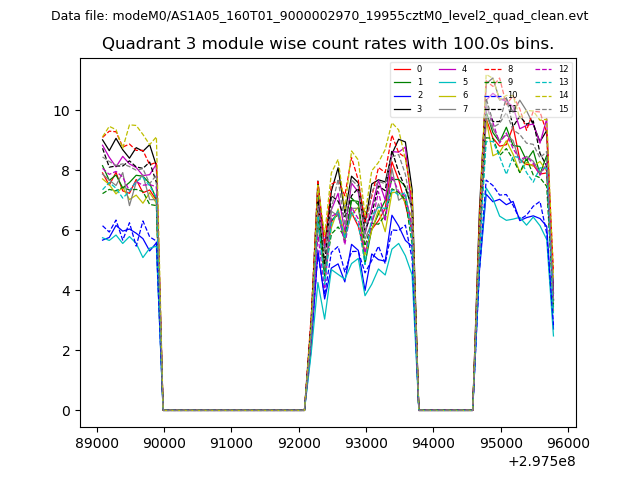 |
 |
| Parameter | Plot |
|---|---|
| CZT HV Monitor | 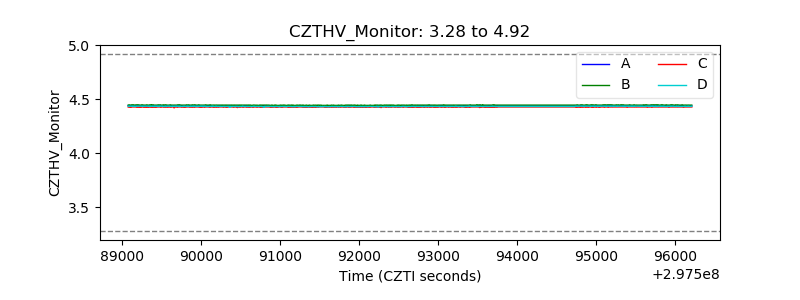 |
| D_VDD | 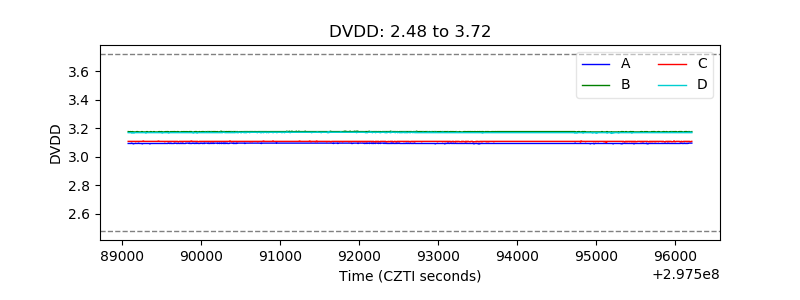 |
| Temperature 1 | 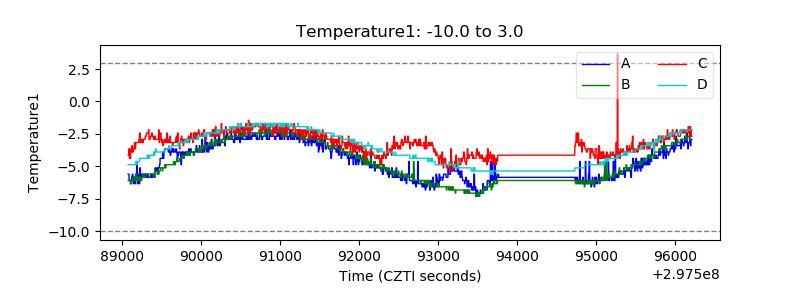 |
| Veto HV Monitor | 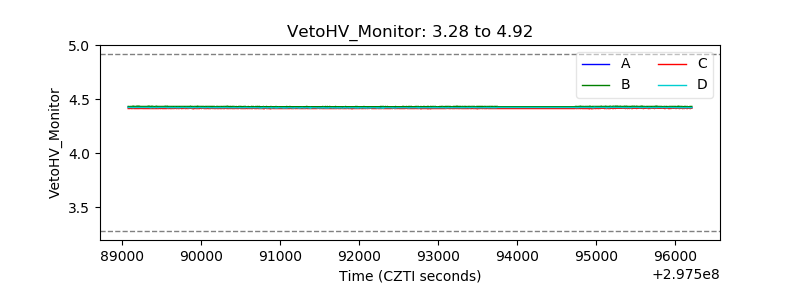 |
| Veto LLD |  |
| Alpha Counter | 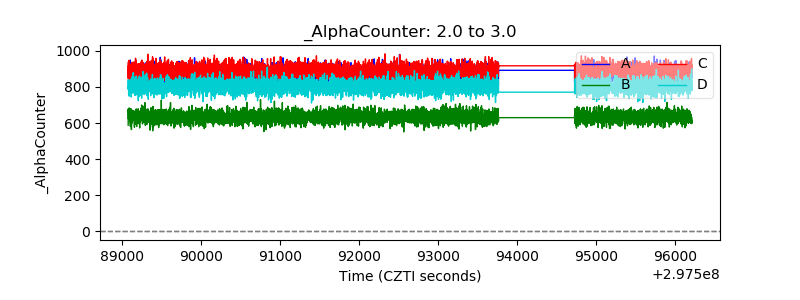 |
| _CPM_Rate | 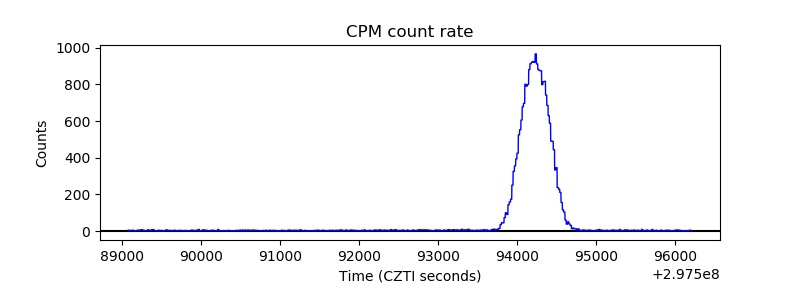 |
| CZT Counter | 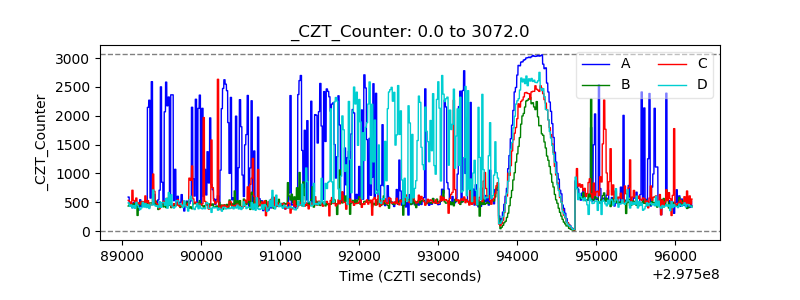 |
| +2.5 Volts monitor |  |
| +5 Volts monitor |  |
| _ROLL_ROT | 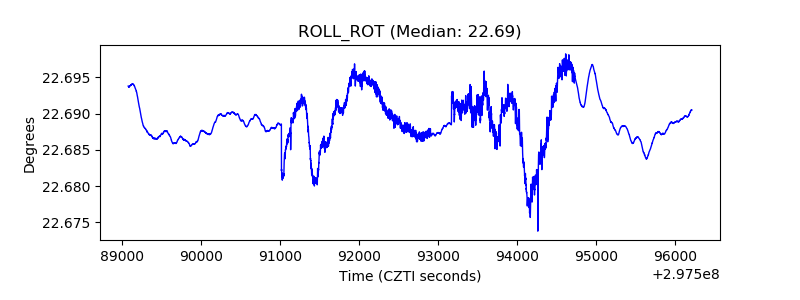 |
| _Roll_DEC | 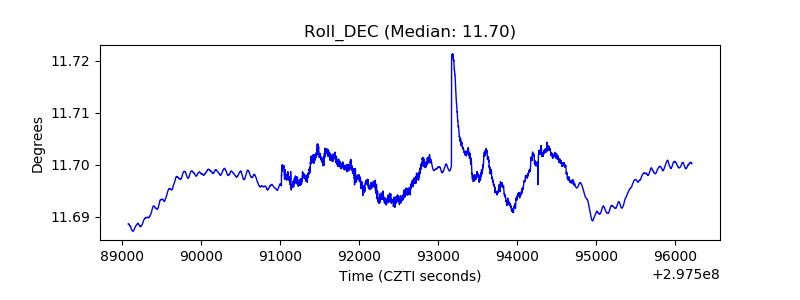 |
| _Roll_RA | 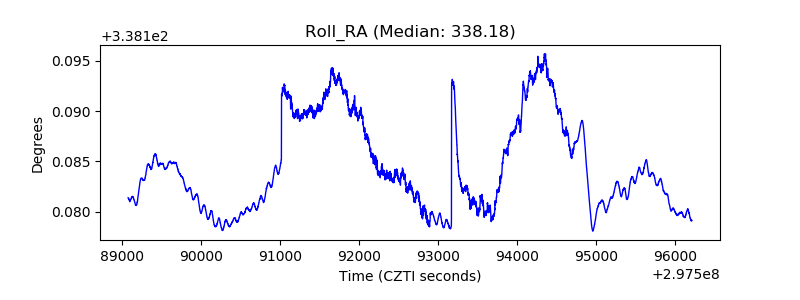 |
| Veto Counter | 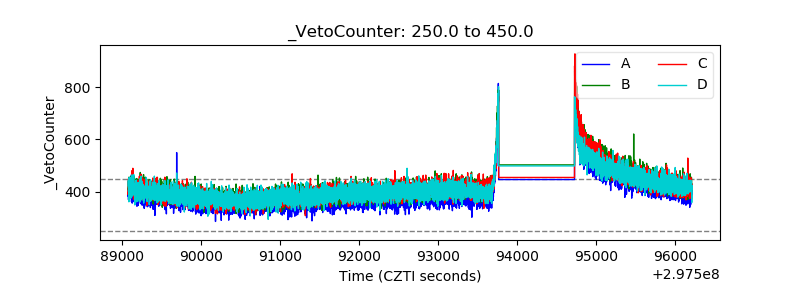 |