| Param | Original file | Final file |
|---|---|---|
| Filename | modeM0/AS1A05_160T01_9000002970_19958cztM0_level2.evt | modeM0/AS1A05_160T01_9000002970_19958cztM0_level2_quad_clean.evt |
| Size (bytes) | 798,641,280 | 92,148,480 |
| Size | 761.6 MB | 87.9 MB |
| Events in quadrant A | 8,101,080 | 484,605 |
| Events in quadrant B | 4,960,956 | 579,935 |
| Events in quadrant C | 5,226,574 | 542,100 |
| Events in quadrant D | 5,265,078 | 534,300 |
| Mode SS | |||
|---|---|---|---|
| Quadrant | BADHDUFLAG | Total packets | Discarded packets |
| A | 0 | 224 | 26 |
| B | 0 | 226 | 34 |
| C | 0 | 228 | 40 |
| D | 0 | 226 | 34 |
| Mode M0 | |||
|---|---|---|---|
| Quadrant | BADHDUFLAG | Total packets | Discarded packets |
| A | 0 | 35900 | 5882 |
| B | 0 | 24210 | 3775 |
| C | 0 | 24819 | 3668 |
| D | 0 | 25920 | 4316 |
| Mode M9 | |||
|---|---|---|---|
| Quadrant | BADHDUFLAG | Total packets | Discarded packets |
| A | 0 | 25 | 2 |
| B | 0 | 25 | 2 |
| C | 0 | 26 | 2 |
| D | 0 | 24 | 2 |
| Quadrant | Total seconds | Saturated seconds | Saturation percentage |
|---|---|---|---|
| A | 9293 | 1509 | 16.238029% |
| B | 9379 | 109 | 1.162171% |
| C | 9388 | 125 | 1.331487% |
| D | 9321 | 156 | 1.673640% |
Noise dominated data is calculated using 1-second bins in cleaned event files. If a bin has >2000 counts, and if more than 50% of those come from <1% of pixels, then it is considered to be noise-dominated and hence unusable.
| Quadrant | # 1 sec bins | Bins with >0 counts | Bins with >2000 counts | High rate bins dominated by noise | Noise dominated (total time) | Noise dominated (detector-on time) | Marked lightcurve |
|---|---|---|---|---|---|---|---|
| A | 13451 | 9584 | 1207 | 1207 | 8.97% | 12.59% | 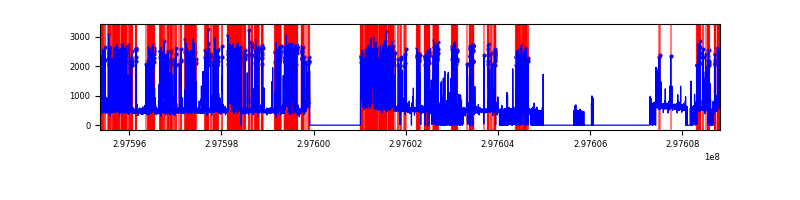 |
| B | 13451 | 9724 | 19 | 19 | 0.14% | 0.20% | 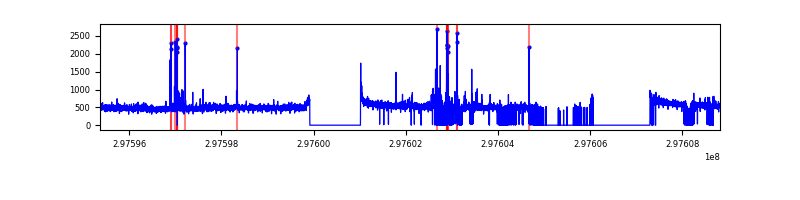 |
| C | 13451 | 9692 | 5 | 5 | 0.04% | 0.05% | 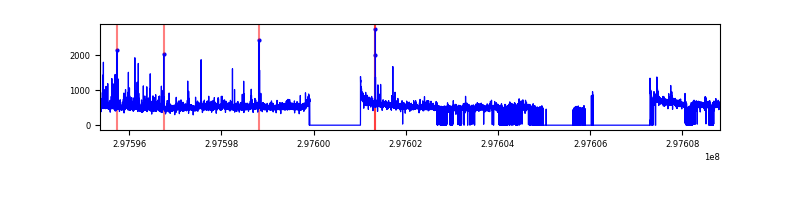 |
| D | 13450 | 9613 | 100 | 100 | 0.74% | 1.04% | 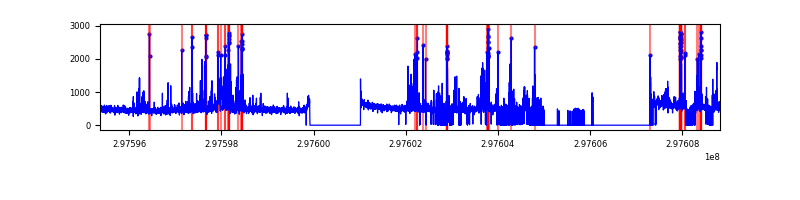 |
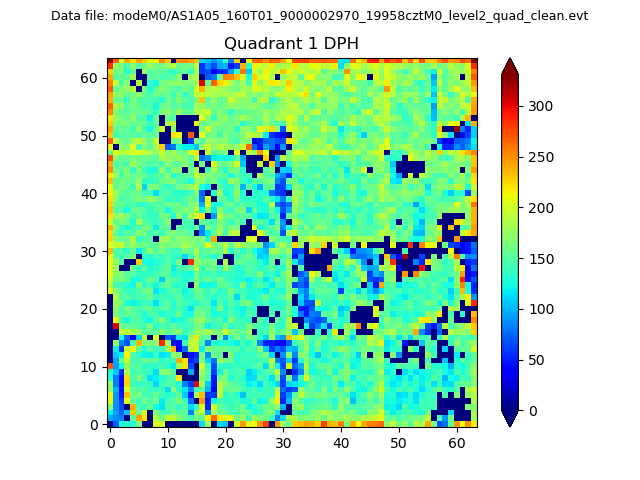
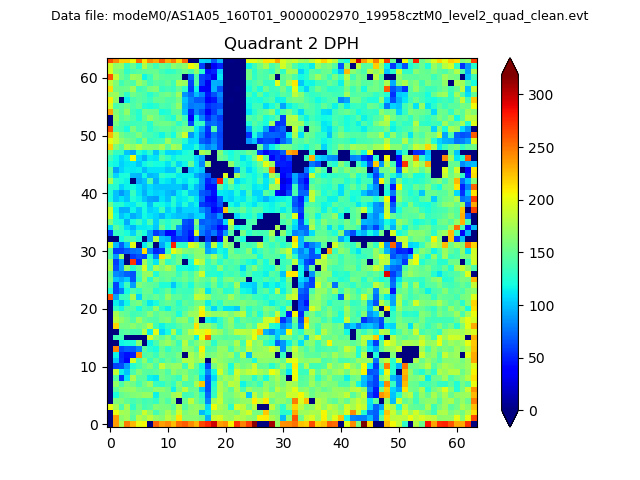
Top three noisy pixels from each quadrant. If the there are fewer than three noisy pixels in the level2.evt file, extra rows are filled as -1
| Pixel properties | Quadrant properties | ||||||
|---|---|---|---|---|---|---|---|
| Quadrant | DetID | PixID | Counts | Sigma | Mean | Median | Sigma |
| A | 14 | 238 | 3807372 | 17216.75 | 1109 | 1091 | 221.1 |
| A | 14 | 254 | 18276 | 77.73 | 1109 | 1091 | 221.1 |
| A | 0 | 226 | 9836 | 39.55 | 1109 | 1091 | 221.1 |
| B | 7 | 220 | 122556 | 532.81 | 1210 | 1182 | 227.8 |
| B | 12 | 111 | 26817 | 112.53 | 1210 | 1182 | 227.8 |
| B | 4 | 171 | 25990 | 108.9 | 1210 | 1182 | 227.8 |
| C | 9 | 221 | 273381 | 1016.43 | 1160 | 1171 | 267.8 |
| C | 3 | 233 | 206511 | 766.74 | 1160 | 1171 | 267.8 |
| C | 14 | 238 | 182844 | 678.37 | 1160 | 1171 | 267.8 |
| D | 12 | 233 | 386577 | 1354.52 | 1184 | 1152 | 284.5 |
| D | 12 | 218 | 171417 | 598.37 | 1184 | 1152 | 284.5 |
| D | 9 | 1 | 115807 | 402.94 | 1184 | 1152 | 284.5 |
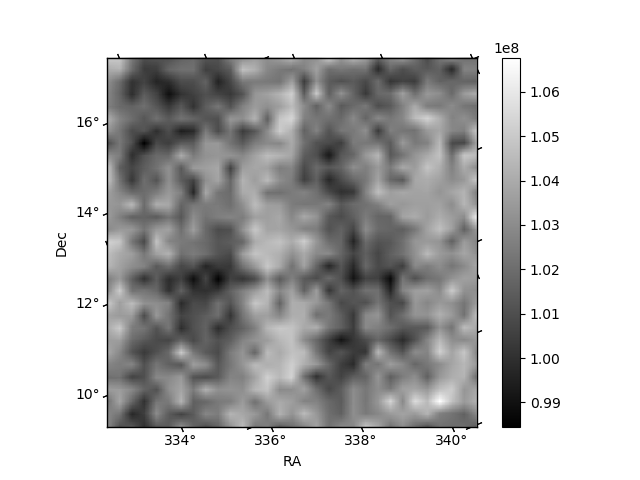
Histogram calculated using DETX and DETY for each event in the final _common_clean file
| Quadrant A | 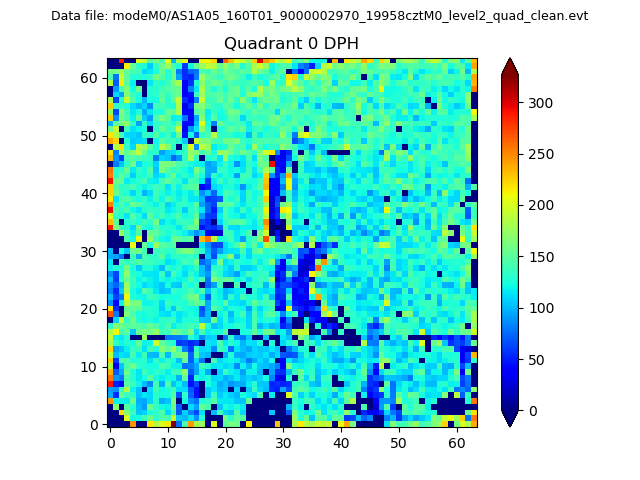 |
 |
Quadrant B |
|---|---|---|---|
| Quadrant D | 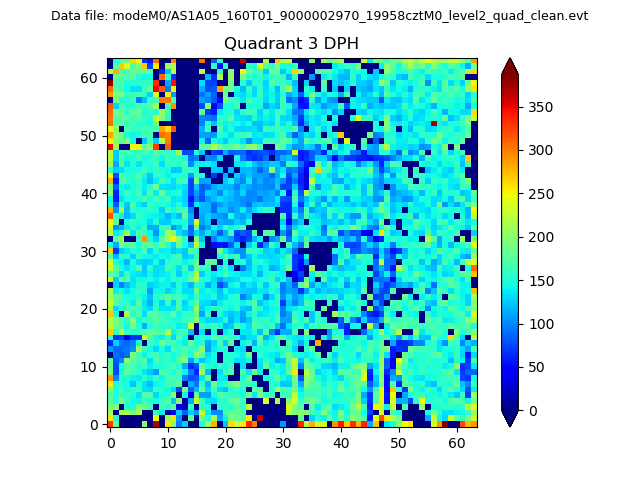 |
 |
Quadrant C |
| Plot type | Count rate plots | Images |
|---|---|---|
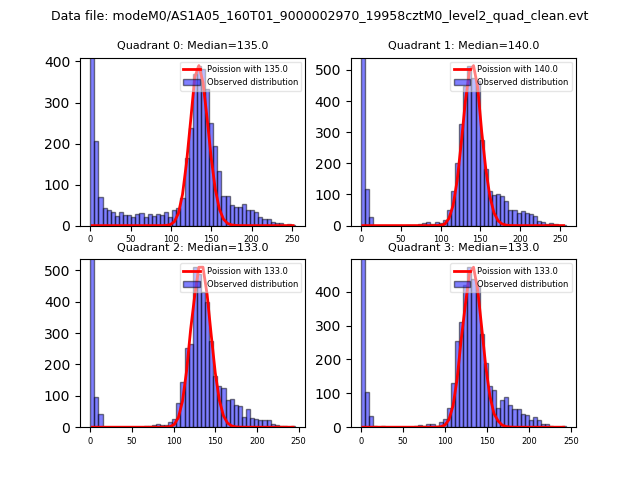
| Comparison with Poisson distribution Blue bars denote a histogram of data divided into 1 sec bins. Red curve is a Poisson curve with rate = median count rate of data. |
 |
 |
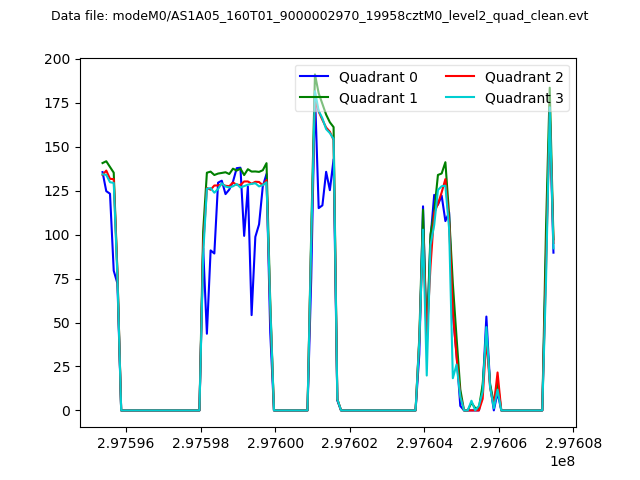
| Quadrant-wise count rates Data is divided into 100 sec bins |
 |
|
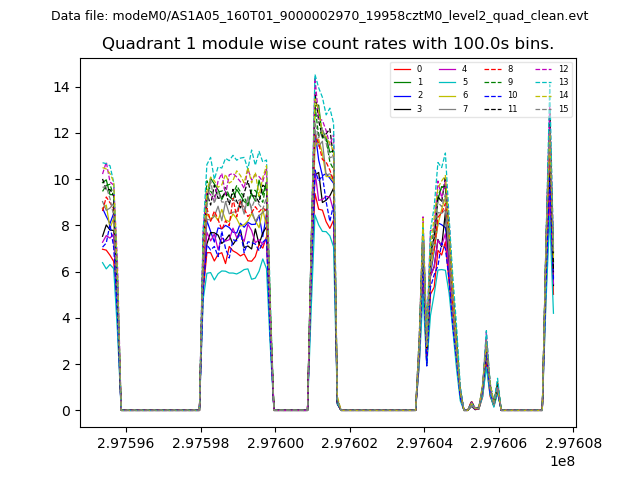
| Module-wise count rates for Quadrant A Data is divided into 100 sec bins |
 |
 |
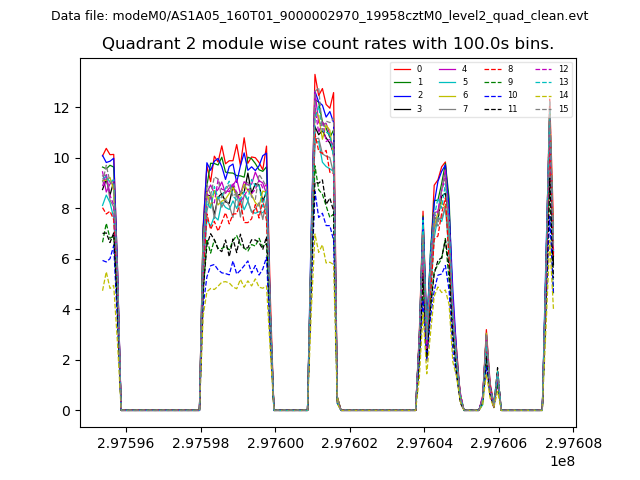
| Module-wise count rates for Quadrant B Data is divided into 100 sec bins |
 |
 |
| Module-wise count rates for Quadrant C Data is divided into 100 sec bins |
 |
 |
| Module-wise count rates for Quadrant D Data is divided into 100 sec bins |
 |
 |
| Parameter | Plot |
|---|---|
| CZT HV Monitor |  |
| D_VDD | 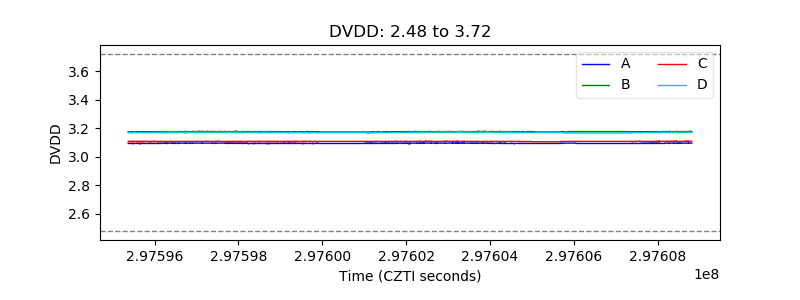 |
| Temperature 1 | 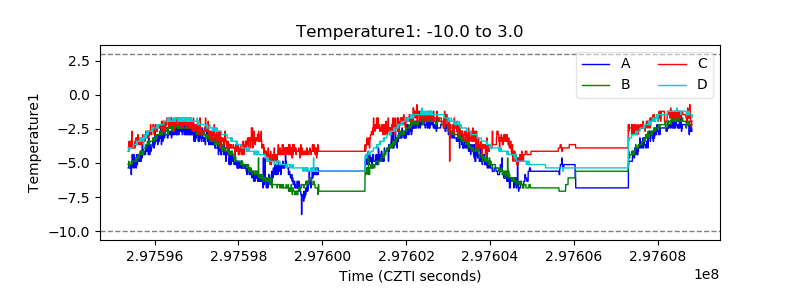 |
| Veto HV Monitor | 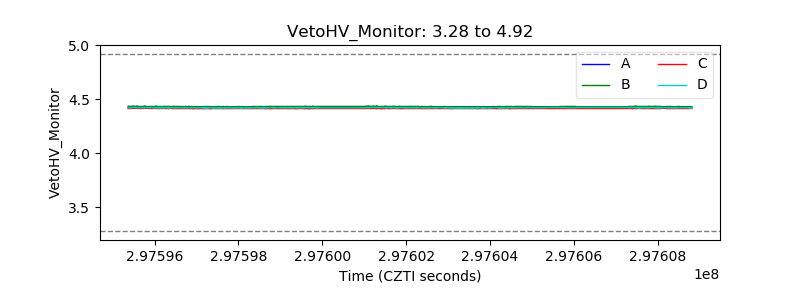 |
| Veto LLD |  |
| Alpha Counter | 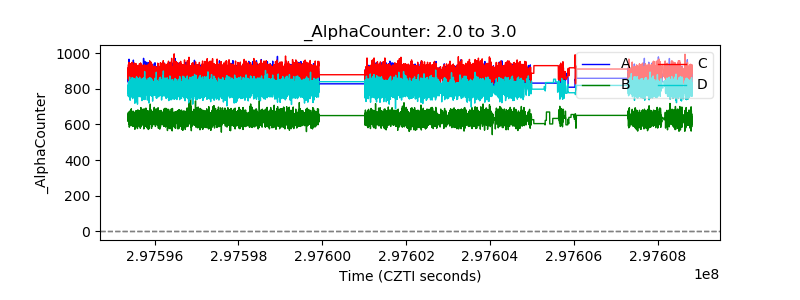 |
| _CPM_Rate | 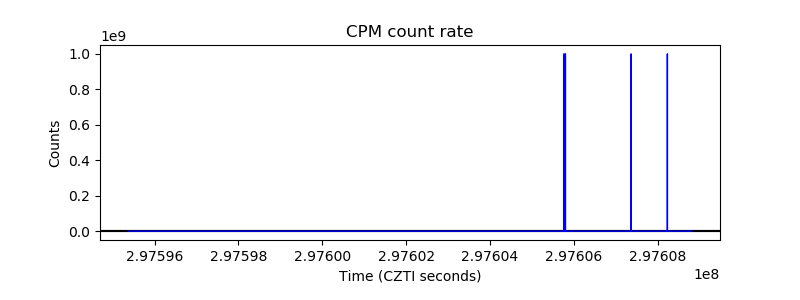 |
| CZT Counter | 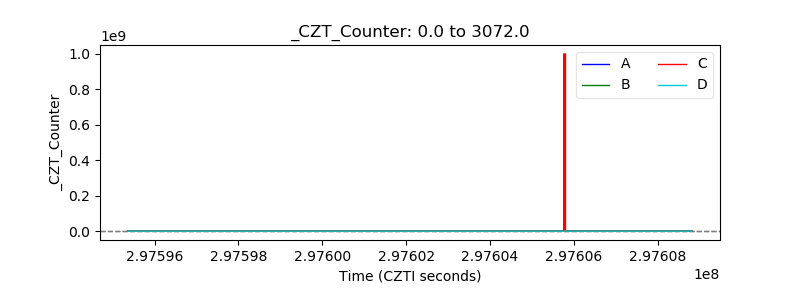 |
| +2.5 Volts monitor |  |
| +5 Volts monitor |  |
| _ROLL_ROT |  |
| _Roll_DEC | 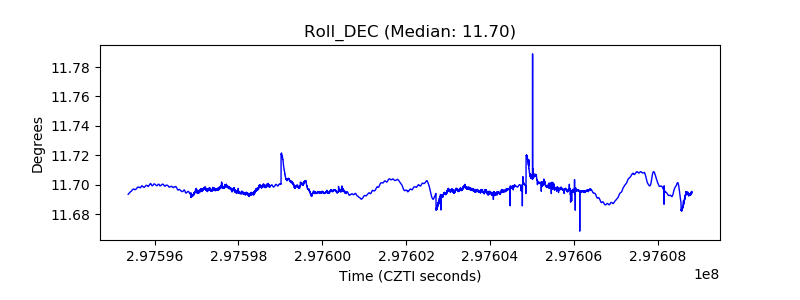 |
| _Roll_RA | 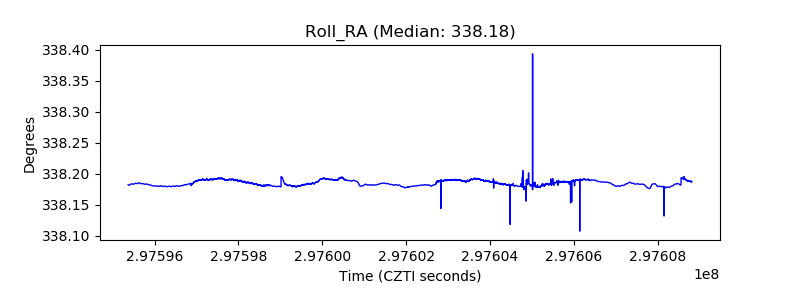 |
| Veto Counter |  |