| Param | Original file | Final file |
|---|---|---|
| Filename | modeM0/AS1A05_160T01_9000002970_19959cztM0_level2.evt | modeM0/AS1A05_160T01_9000002970_19959cztM0_level2_quad_clean.evt |
| Size (bytes) | 1,060,813,440 | 128,309,760 |
| Size | 1011.7 MB | 122.4 MB |
| Events in quadrant A | 10,885,227 | 703,578 |
| Events in quadrant B | 6,612,833 | 805,884 |
| Events in quadrant C | 6,818,759 | 764,295 |
| Events in quadrant D | 6,976,833 | 758,545 |
| Mode SS | |||
|---|---|---|---|
| Quadrant | BADHDUFLAG | Total packets | Discarded packets |
| A | 0 | 250 | 0 |
| B | 0 | 250 | 0 |
| C | 0 | 250 | 0 |
| D | 0 | 250 | 0 |
| Mode M0 | |||
|---|---|---|---|
| Quadrant | BADHDUFLAG | Total packets | Discarded packets |
| A | 0 | 40231 | 2 |
| B | 0 | 27047 | 2 |
| C | 0 | 27494 | 2 |
| D | 0 | 28545 | 2 |
| Mode M9 | |||
|---|---|---|---|
| Quadrant | BADHDUFLAG | Total packets | Discarded packets |
| A | 0 | 24 | 0 |
| B | 0 | 24 | 0 |
| C | 0 | 24 | 0 |
| D | 0 | 24 | 0 |
| Quadrant | Total seconds | Saturated seconds | Saturation percentage |
|---|---|---|---|
| A | 12336 | 2044 | 16.569390% |
| B | 12337 | 173 | 1.402286% |
| C | 12337 | 154 | 1.248278% |
| D | 12337 | 226 | 1.831888% |
Noise dominated data is calculated using 1-second bins in cleaned event files. If a bin has >2000 counts, and if more than 50% of those come from <1% of pixels, then it is considered to be noise-dominated and hence unusable.
| Quadrant | # 1 sec bins | Bins with >0 counts | Bins with >2000 counts | High rate bins dominated by noise | Noise dominated (total time) | Noise dominated (detector-on time) | Marked lightcurve |
|---|---|---|---|---|---|---|---|
| A | 14671 | 12336 | 1649 | 1649 | 11.24% | 13.37% | 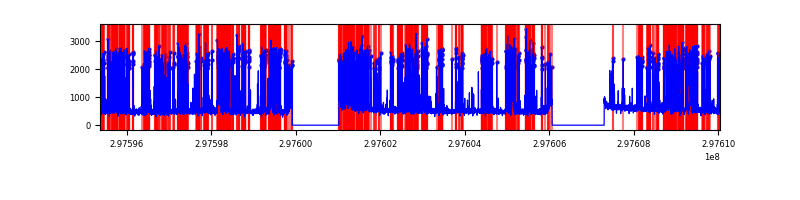 |
| B | 14672 | 12337 | 41 | 41 | 0.28% | 0.33% | 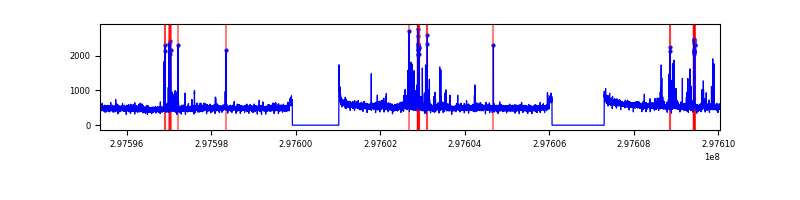 |
| C | 14672 | 12337 | 6 | 6 | 0.04% | 0.05% | 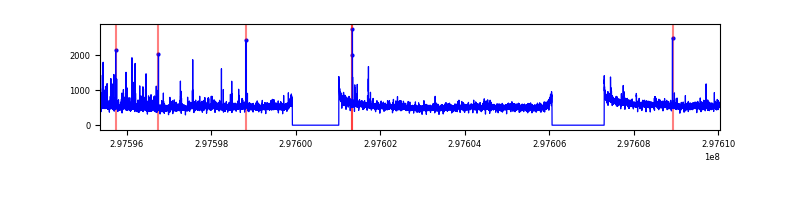 |
| D | 14672 | 12337 | 145 | 145 | 0.99% | 1.18% | 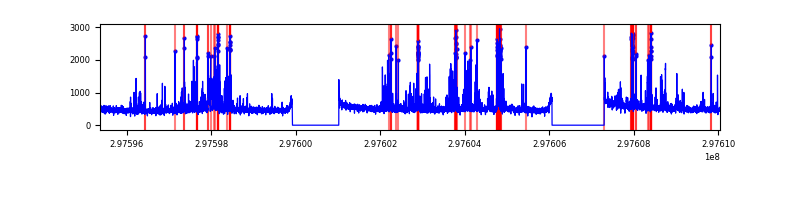 |
Top three noisy pixels from each quadrant. If the there are fewer than three noisy pixels in the level2.evt file, extra rows are filled as -1
| Pixel properties | Quadrant properties | ||||||
|---|---|---|---|---|---|---|---|
| Quadrant | DetID | PixID | Counts | Sigma | Mean | Median | Sigma |
| A | 14 | 238 | 5183876 | 17840.83 | 1469 | 1444 | 290.5 |
| A | 14 | 254 | 23970 | 77.55 | 1469 | 1444 | 290.5 |
| A | 11 | 29 | 16607 | 52.2 | 1469 | 1444 | 290.5 |
| B | 7 | 220 | 160668 | 530.2 | 1593 | 1554 | 300.1 |
| B | 4 | 171 | 56651 | 183.59 | 1593 | 1554 | 300.1 |
| B | 3 | 64 | 53607 | 173.45 | 1593 | 1554 | 300.1 |
| C | 3 | 233 | 287229 | 811.39 | 1527 | 1542 | 352.1 |
| C | 9 | 221 | 283516 | 800.84 | 1527 | 1542 | 352.1 |
| C | 14 | 238 | 240750 | 679.38 | 1527 | 1542 | 352.1 |
| D | 12 | 233 | 545984 | 1444.17 | 1568 | 1526 | 377.0 |
| D | 12 | 218 | 236972 | 624.52 | 1568 | 1526 | 377.0 |
| D | 9 | 1 | 117212 | 306.86 | 1568 | 1526 | 377.0 |
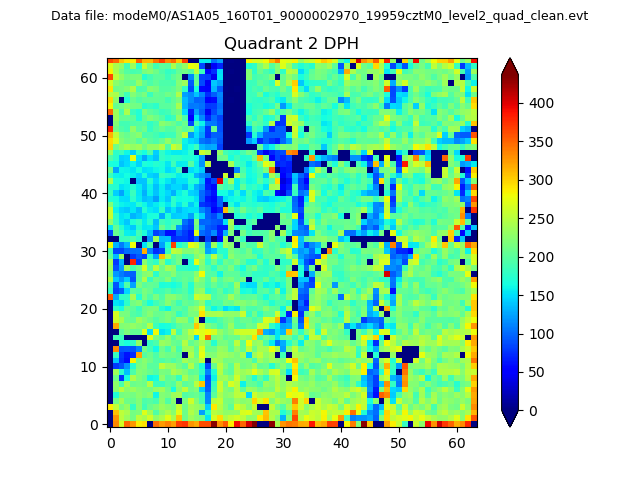
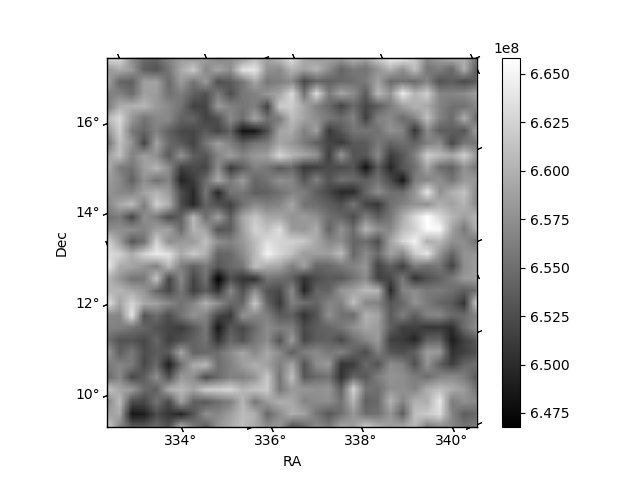
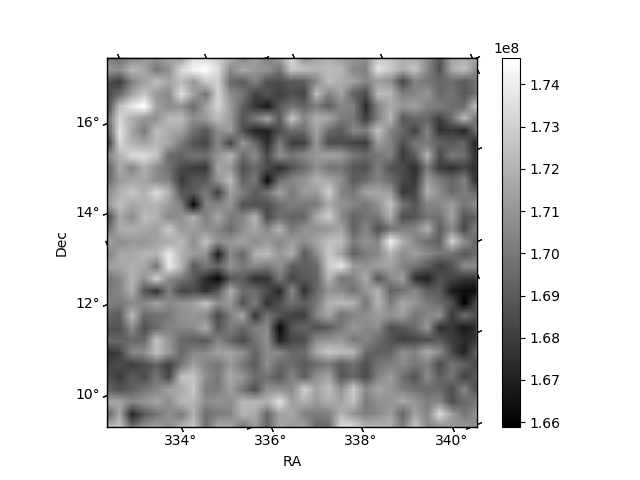
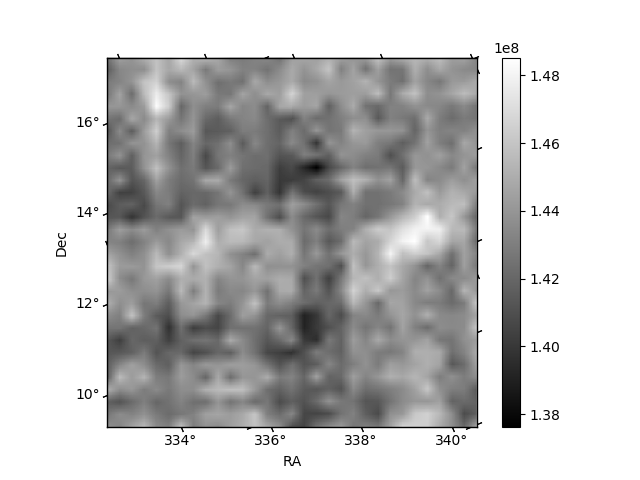
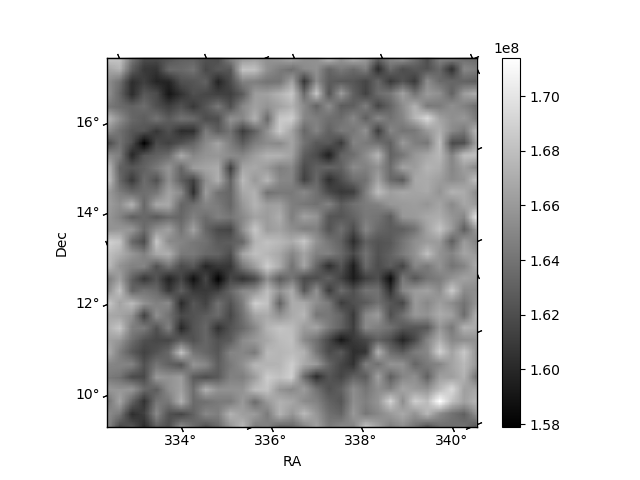
Histogram calculated using DETX and DETY for each event in the final _common_clean file
| Quadrant A | 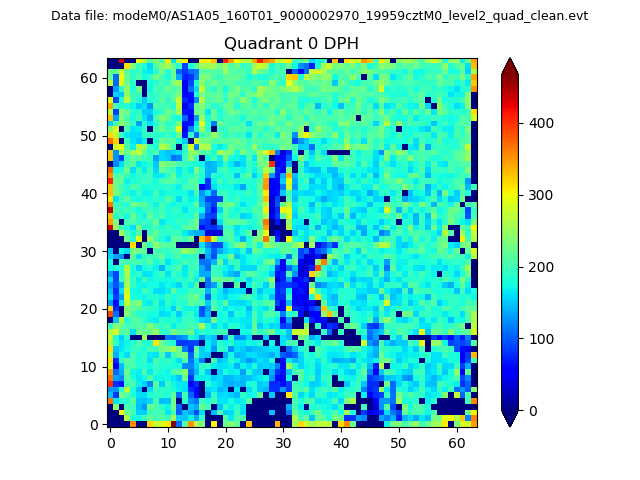 |
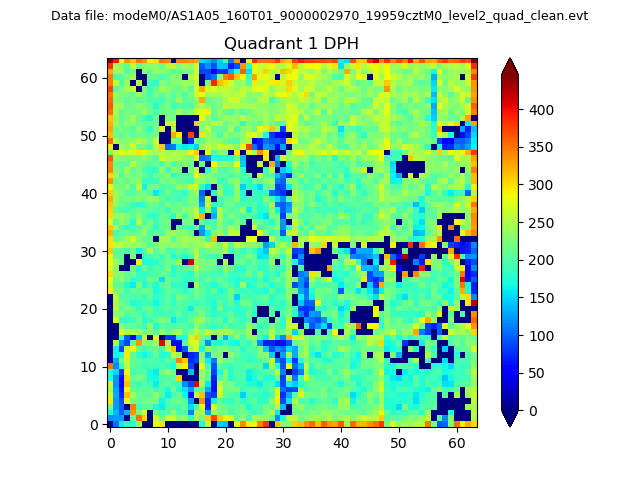 |
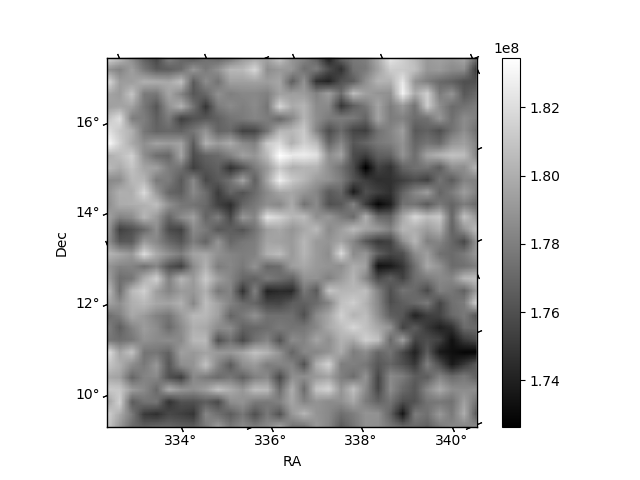
Quadrant B |
|---|---|---|---|
| Quadrant D | 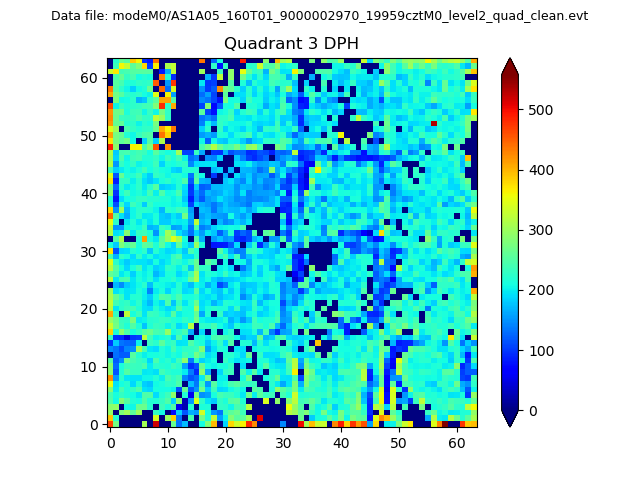 |
 |
Quadrant C |
| Plot type | Count rate plots | Images |
|---|---|---|
| Comparison with Poisson distribution Blue bars denote a histogram of data divided into 1 sec bins. Red curve is a Poisson curve with rate = median count rate of data. |
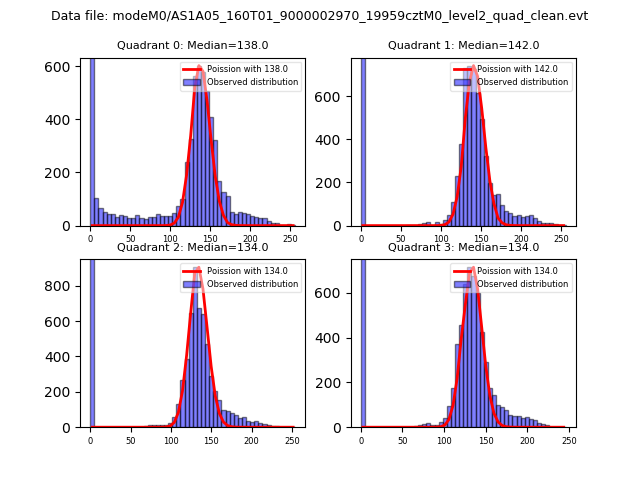 |
 |
| Quadrant-wise count rates Data is divided into 100 sec bins |
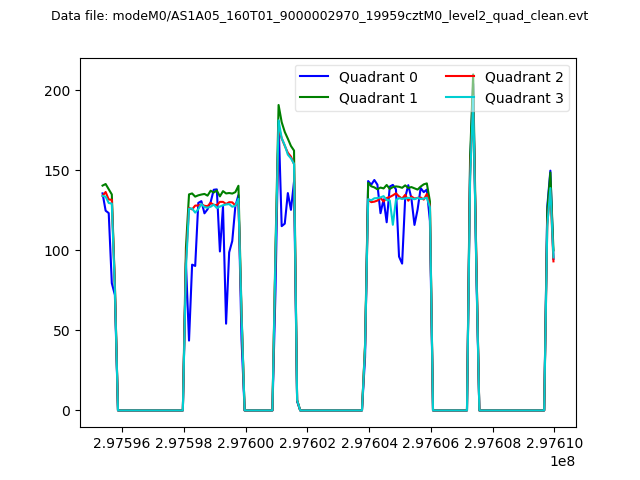 |
|
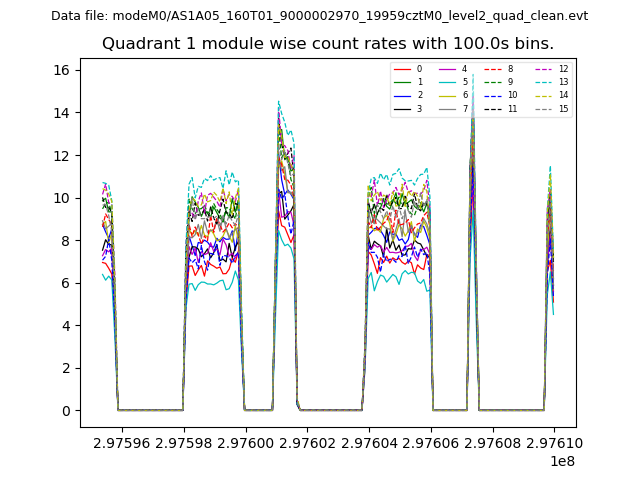
| Module-wise count rates for Quadrant A Data is divided into 100 sec bins |
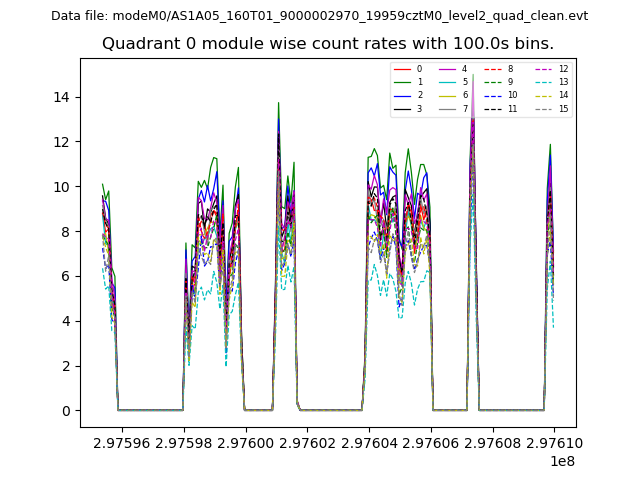 |
 |
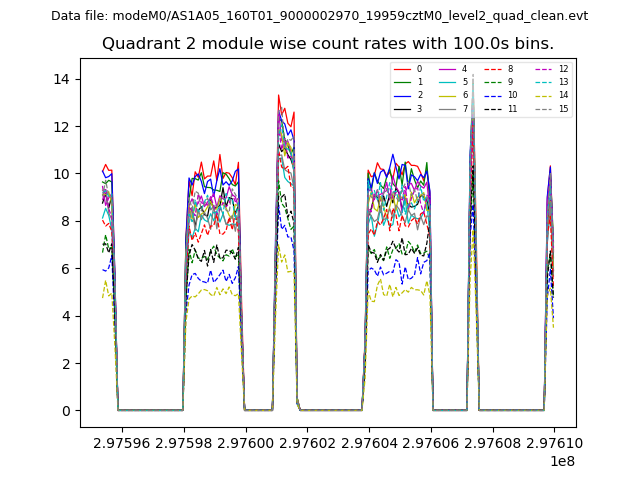
| Module-wise count rates for Quadrant B Data is divided into 100 sec bins |
 |
 |
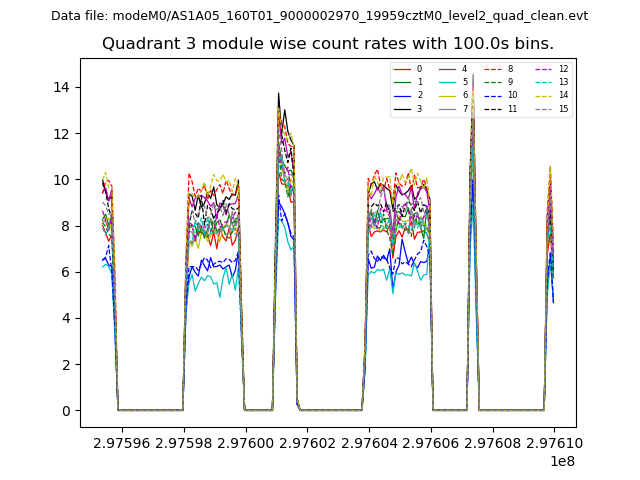
| Module-wise count rates for Quadrant C Data is divided into 100 sec bins |
 |
 |
| Module-wise count rates for Quadrant D Data is divided into 100 sec bins |
 |
 |
| Parameter | Plot |
|---|---|
| CZT HV Monitor | 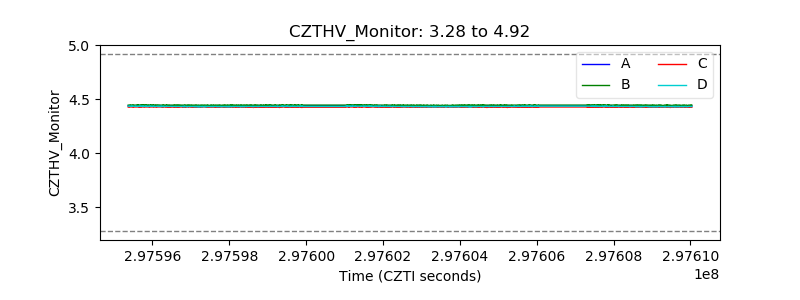 |
| D_VDD | 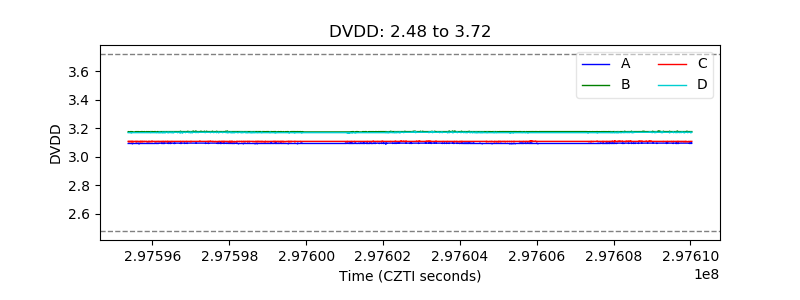 |
| Temperature 1 | 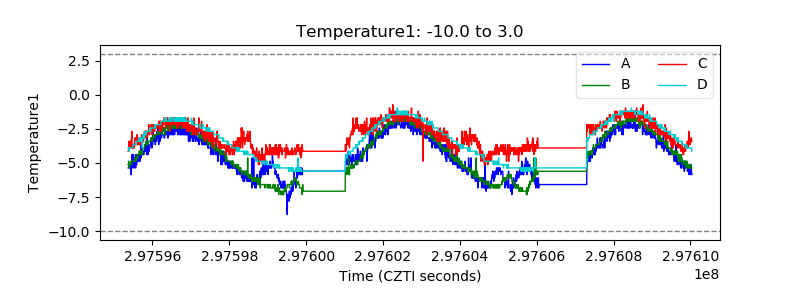 |
| Veto HV Monitor | 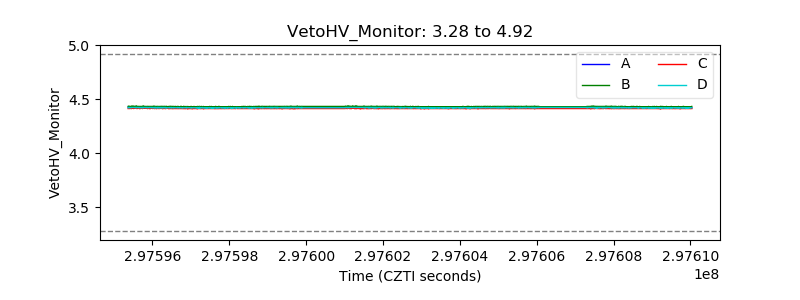 |
| Veto LLD | 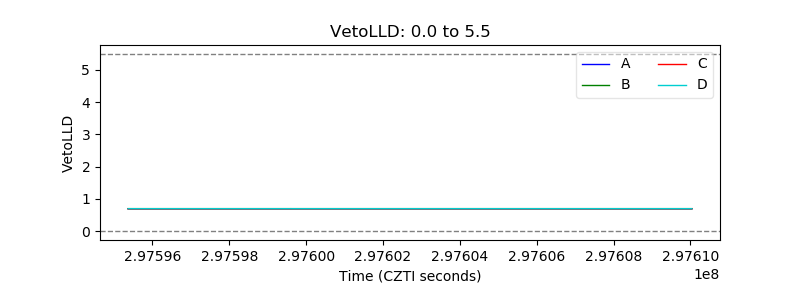 |
| Alpha Counter | 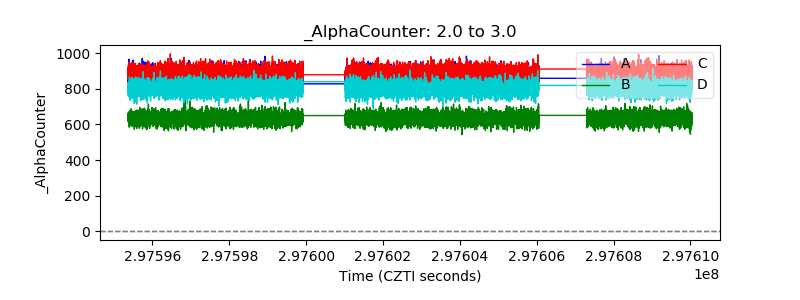 |
| _CPM_Rate | 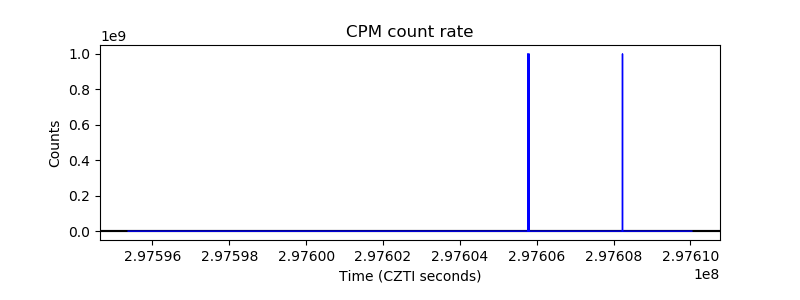 |
| CZT Counter | 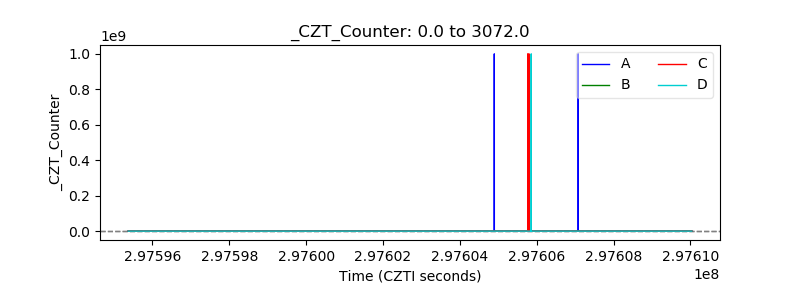 |
| +2.5 Volts monitor |  |
| +5 Volts monitor |  |
| _ROLL_ROT | 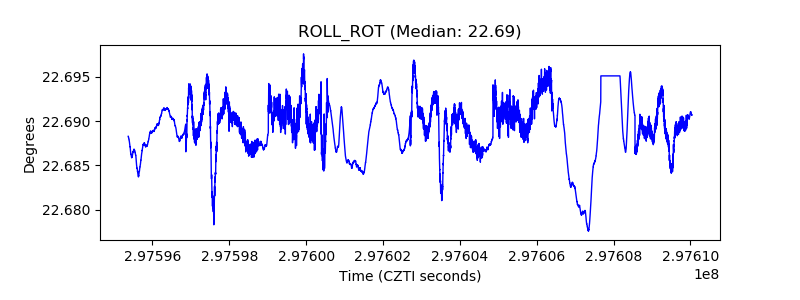 |
| _Roll_DEC | 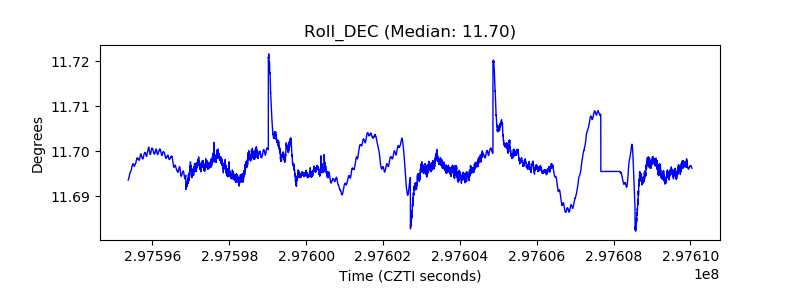 |
| _Roll_RA | 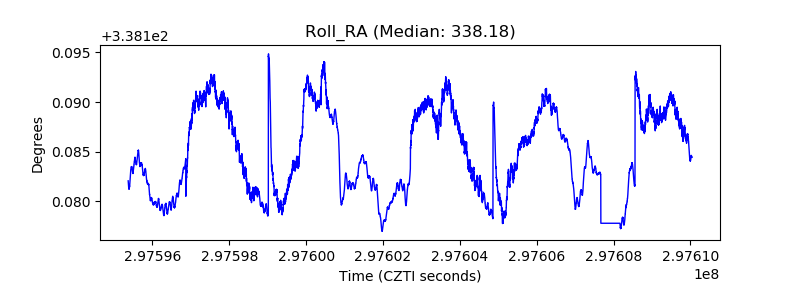 |
| Veto Counter | 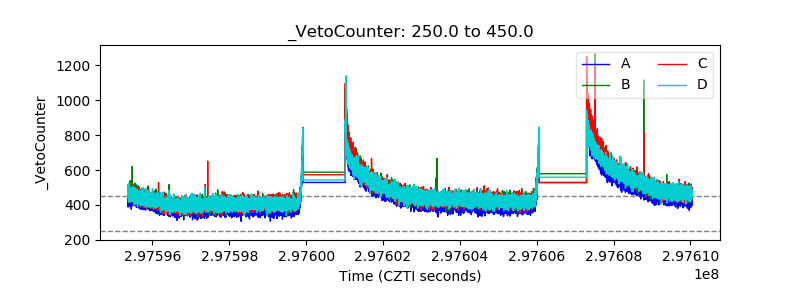 |