| Param | Original file | Final file |
|---|---|---|
| Filename | modeM0/AS1A05_227T01_9000002966cztM0_level2.fits | modeM0/AS1A05_227T01_9000002966cztM0_level2_quad_clean.evt |
| Size (bytes) | 93,519,360 | 62,928,000 |
| Size | 89.2 MB | 60.0 MB |
| Events in quadrant A | 591,380 | 336,654 |
| Events in quadrant B | 551,356 | 325,161 |
| Events in quadrant C | 539,172 | 292,572 |
| Events in quadrant D | 484,108 | 284,596 |
| Mode SS | |||
|---|---|---|---|
| Quadrant | BADHDUFLAG | Total packets | Discarded packets |
| A | 0 | 196 | 0 |
| B | 0 | 196 | 0 |
| C | 0 | 196 | 0 |
| D | 0 | 196 | 0 |
| Mode M0 | |||
|---|---|---|---|
| Quadrant | BADHDUFLAG | Total packets | Discarded packets |
| A | 0 | 19676 | 0 |
| B | 0 | 21200 | 0 |
| C | 0 | 33034 | 0 |
| D | 0 | 30457 | 0 |
| Mode M9 | |||
|---|---|---|---|
| Quadrant | BADHDUFLAG | Total packets | Discarded packets |
| A | 0 | 20 | 0 |
| B | 0 | 20 | 0 |
| C | 0 | 20 | 0 |
| D | 0 | 20 | 0 |
| Quadrant | Total seconds | Saturated seconds | Saturation percentage |
|---|---|---|---|
| A | 9601 | 108 | 1.124883% |
| B | 9601 | 128 | 1.333194% |
| C | 9601 | 874 | 9.103218% |
| D | 9601 | 779 | 8.113738% |
Noise dominated data is calculated using 1-second bins in cleaned event files. If a bin has >2000 counts, and if more than 50% of those come from <1% of pixels, then it is considered to be noise-dominated and hence unusable.
| Quadrant | # 1 sec bins | Bins with >0 counts | Bins with >2000 counts | High rate bins dominated by noise | Noise dominated (total time) | Noise dominated (detector-on time) | Marked lightcurve |
|---|---|---|---|---|---|---|---|
| A | 11601 | 9599 | 0 | 0 | 0.00% | 0.00% | 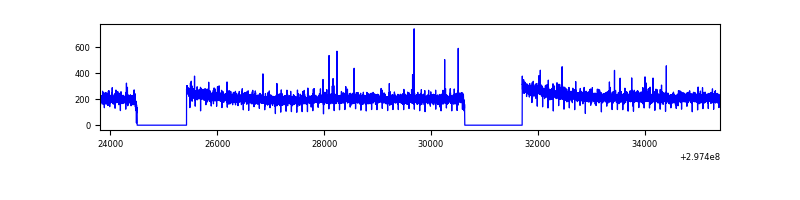 |
| B | 11601 | 9599 | 0 | 0 | 0.00% | 0.00% | 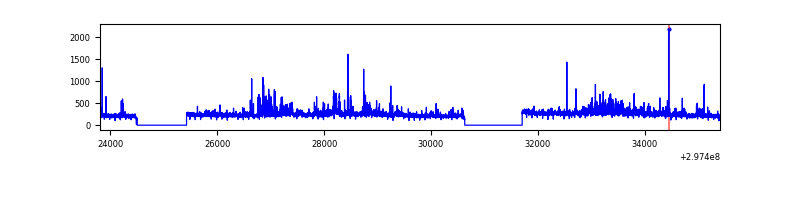 |
| C | 11601 | 9596 | 0 | 0 | 0.00% | 0.00% | 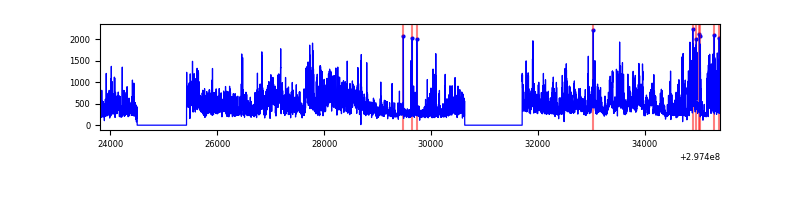 |
| D | 11601 | 9597 | 0 | 0 | 0.00% | 0.00% | 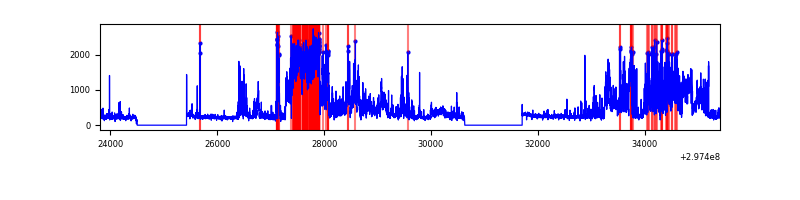 |
Top three noisy pixels from each quadrant. If the there are fewer than three noisy pixels in the level2.evt file, extra rows are filled as -1
| Pixel properties | Quadrant properties | ||||||
|---|---|---|---|---|---|---|---|
| Quadrant | DetID | PixID | Counts | Sigma | Mean | Median | Sigma |
| A | 0 | 29 | 550 | 10.05 | 154 | 145 | 40.3 |
| A | 7 | 110 | 461 | 7.84 | 154 | 145 | 40.3 |
| A | 14 | 79 | 451 | 7.59 | 154 | 145 | 40.3 |
| B | 5 | 255 | 372 | 7.6 | 146 | 140 | 30.5 |
| B | 5 | 128 | 350 | 6.88 | 146 | 140 | 30.5 |
| B | 14 | 254 | 346 | 6.75 | 146 | 140 | 30.5 |
| C | 7 | 111 | 381 | 6.43 | 142 | 134 | 38.4 |
| C | 9 | 209 | 374 | 6.24 | 142 | 134 | 38.4 |
| C | 12 | 241 | 371 | 6.17 | 142 | 134 | 38.4 |
| D | 3 | 14 | 372 | 6.5 | 138 | 126 | 37.8 |
| D | 15 | 142 | 363 | 6.26 | 138 | 126 | 37.8 |
| D | 6 | 67 | 354 | 6.03 | 138 | 126 | 37.8 |
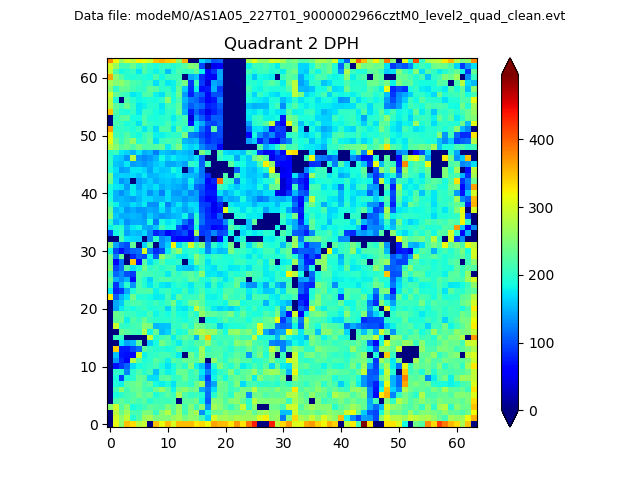
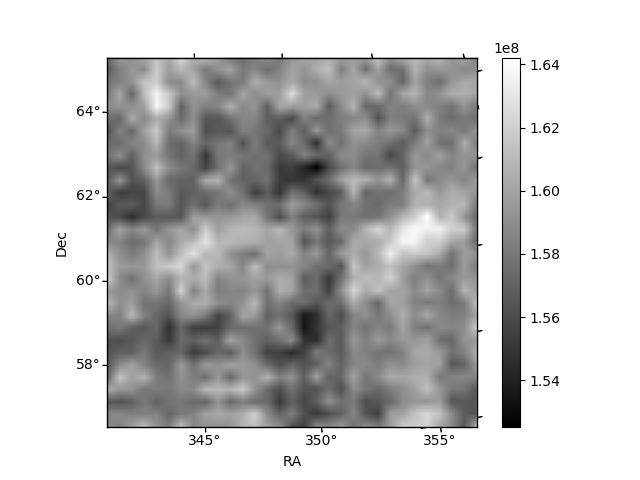
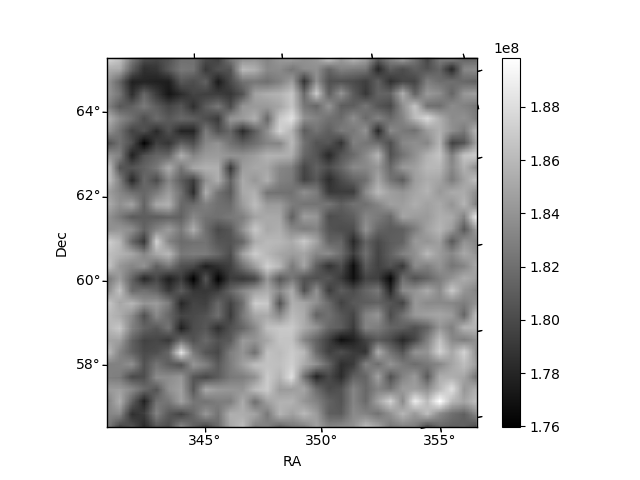
Histogram calculated using DETX and DETY for each event in the final _common_clean file
| Quadrant A | 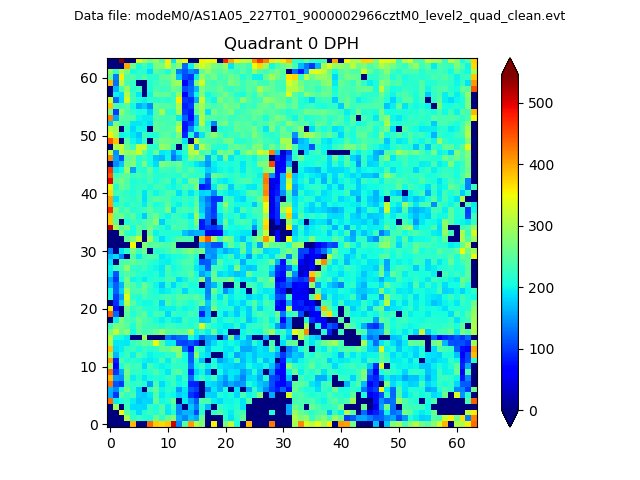 |
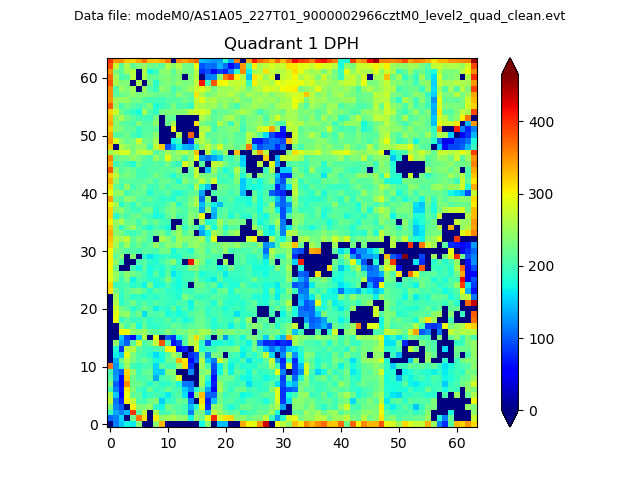 |
Quadrant B |
|---|---|---|---|
| Quadrant D | 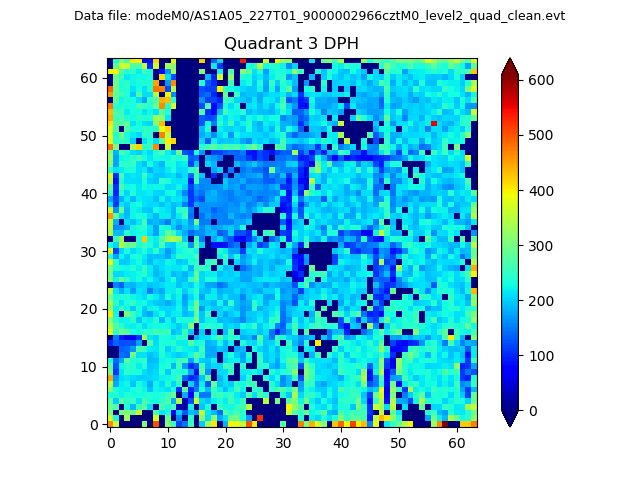 |
 |
Quadrant C |
| Plot type | Count rate plots | Images |
|---|---|---|
| Comparison with Poisson distribution Blue bars denote a histogram of data divided into 1 sec bins. Red curve is a Poisson curve with rate = median count rate of data. |
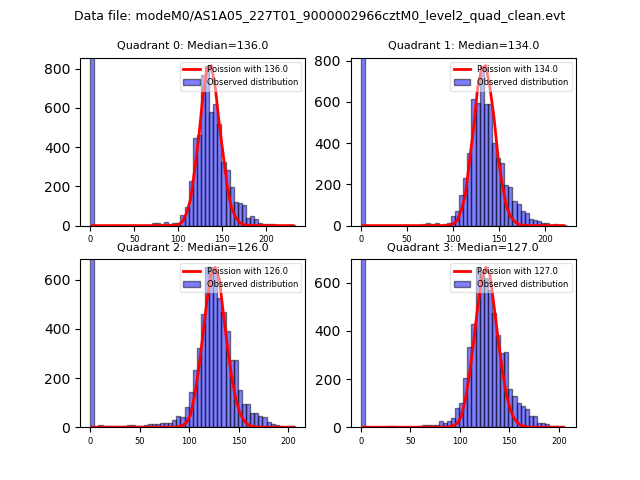 |
 |
| Quadrant-wise count rates Data is divided into 100 sec bins |
 |
|
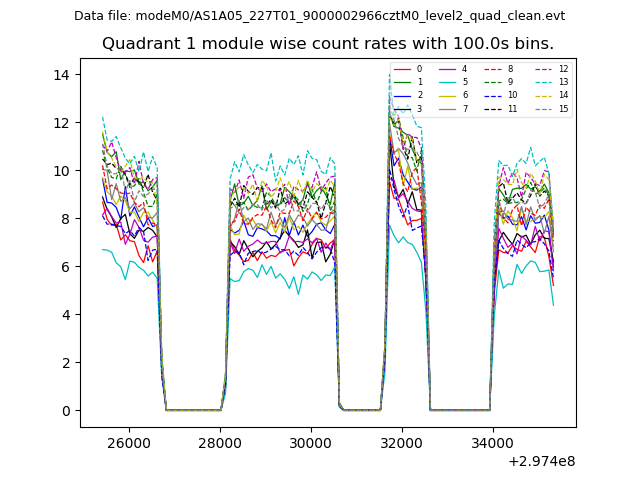
| Module-wise count rates for Quadrant A Data is divided into 100 sec bins |
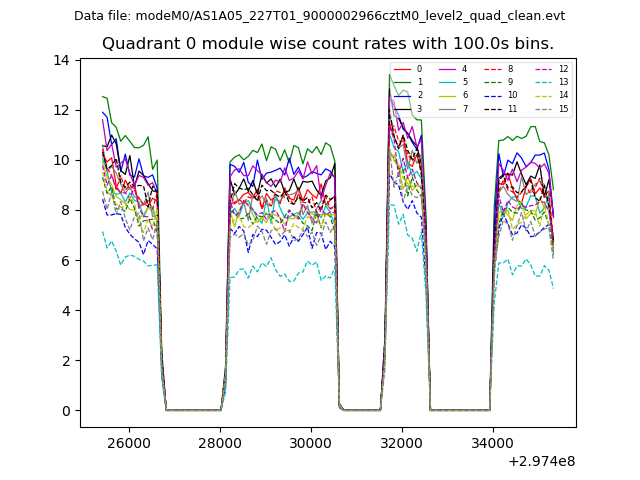 |
 |
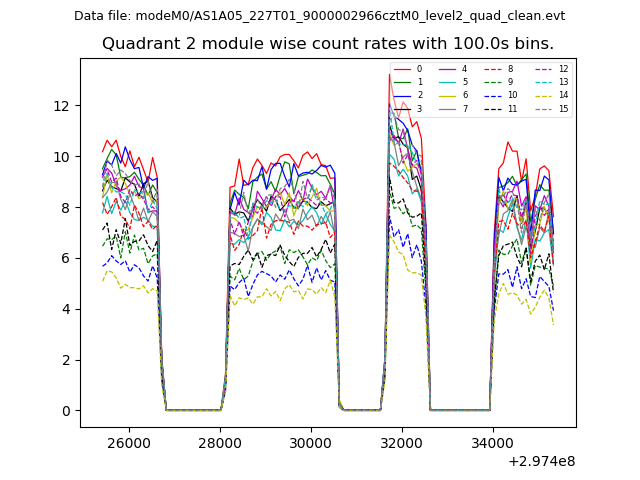
| Module-wise count rates for Quadrant B Data is divided into 100 sec bins |
 |
 |
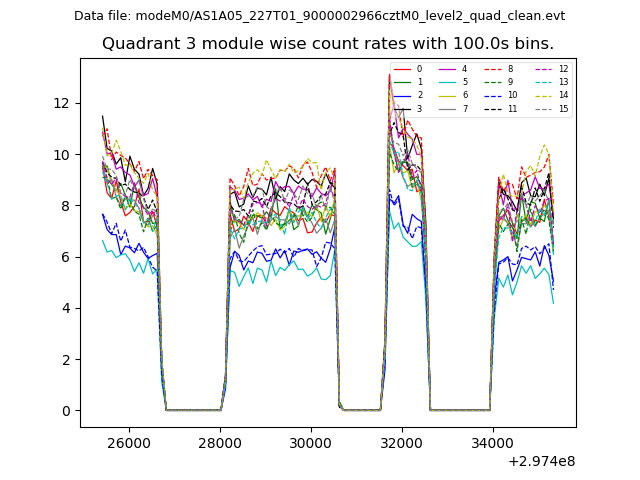
| Module-wise count rates for Quadrant C Data is divided into 100 sec bins |
 |
 |
| Module-wise count rates for Quadrant D Data is divided into 100 sec bins |
 |
 |
| Parameter | Plot |
|---|---|
| CZT HV Monitor | 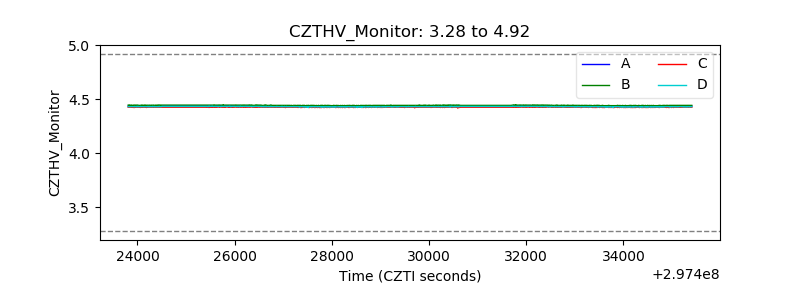 |
| D_VDD | 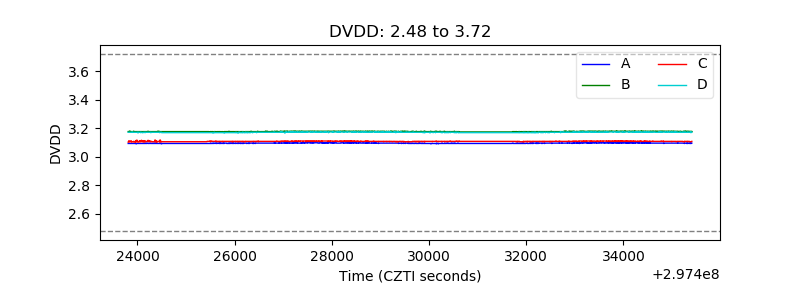 |
| Temperature 1 | 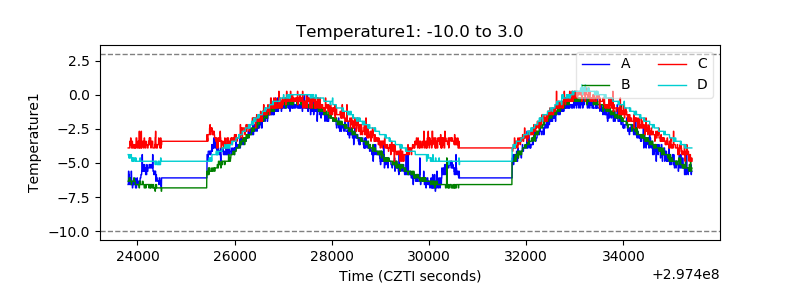 |
| Veto HV Monitor |  |
| Veto LLD | 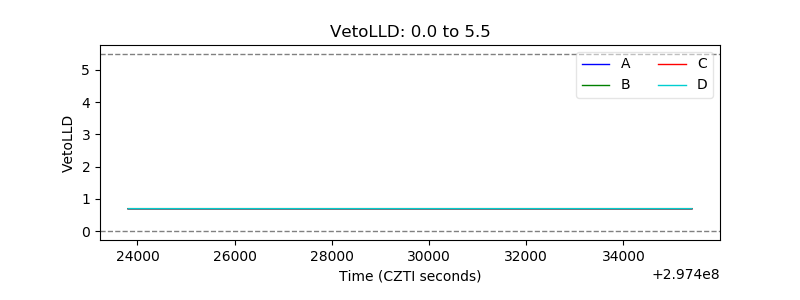 |
| Alpha Counter |  |
| _CPM_Rate | 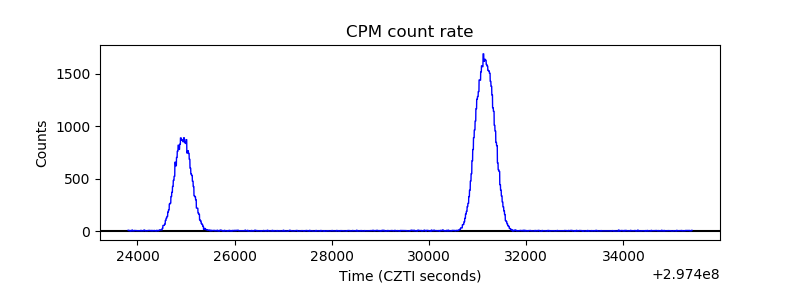 |
| CZT Counter |  |
| +2.5 Volts monitor |  |
| +5 Volts monitor |  |
| _ROLL_ROT | 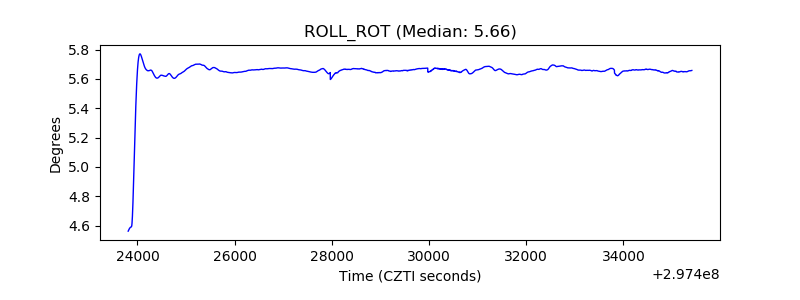 |
| _Roll_DEC | 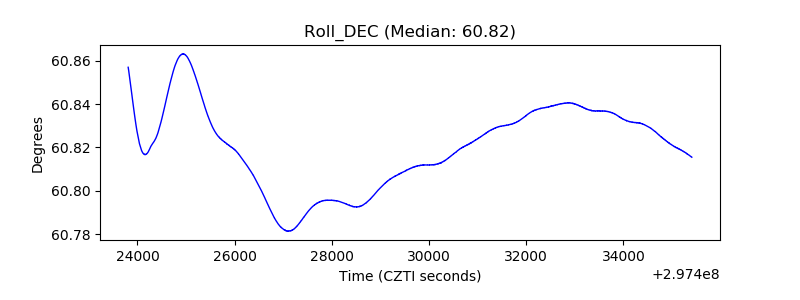 |
| _Roll_RA |  |
| Veto Counter |  |