| Param | Original file | Final file |
|---|---|---|
| Filename | modeM0/AS1A05_227T01_9000002966_19928cztM0_level2.evt | modeM0/AS1A05_227T01_9000002966_19928cztM0_level2_quad_clean.evt |
| Size (bytes) | 596,004,480 | 92,880,000 |
| Size | 568.4 MB | 88.6 MB |
| Events in quadrant A | 3,068,064 | 611,404 |
| Events in quadrant B | 3,472,778 | 609,363 |
| Events in quadrant C | 5,909,223 | 566,615 |
| Events in quadrant D | 5,165,435 | 577,318 |
| Mode SS | |||
|---|---|---|---|
| Quadrant | BADHDUFLAG | Total packets | Discarded packets |
| A | 0 | 130 | 0 |
| B | 0 | 130 | 0 |
| C | 0 | 130 | 0 |
| D | 0 | 130 | 0 |
| Mode M0 | |||
|---|---|---|---|
| Quadrant | BADHDUFLAG | Total packets | Discarded packets |
| A | 0 | 13191 | 1 |
| B | 0 | 14177 | 1 |
| C | 0 | 22077 | 1 |
| D | 0 | 19530 | 3 |
| Mode M9 | |||
|---|---|---|---|
| Quadrant | BADHDUFLAG | Total packets | Discarded packets |
| A | 0 | 11 | 0 |
| B | 0 | 11 | 0 |
| C | 0 | 11 | 0 |
| D | 0 | 11 | 0 |
| Quadrant | Total seconds | Saturated seconds | Saturation percentage |
|---|---|---|---|
| A | 6423 | 50 | 0.778452% |
| B | 6423 | 61 | 0.949712% |
| C | 6423 | 521 | 8.111474% |
| D | 6422 | 588 | 9.156026% |
Noise dominated data is calculated using 1-second bins in cleaned event files. If a bin has >2000 counts, and if more than 50% of those come from <1% of pixels, then it is considered to be noise-dominated and hence unusable.
| Quadrant | # 1 sec bins | Bins with >0 counts | Bins with >2000 counts | High rate bins dominated by noise | Noise dominated (total time) | Noise dominated (detector-on time) | Marked lightcurve |
|---|---|---|---|---|---|---|---|
| A | 7498 | 6423 | 0 | 0 | 0.00% | 0.00% | 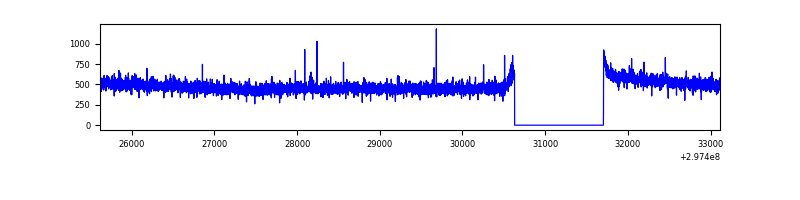 |
| B | 7498 | 6423 | 5 | 5 | 0.07% | 0.08% | 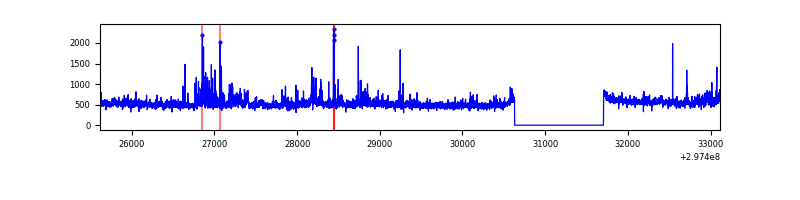 |
| C | 7498 | 6423 | 148 | 148 | 1.97% | 2.30% | 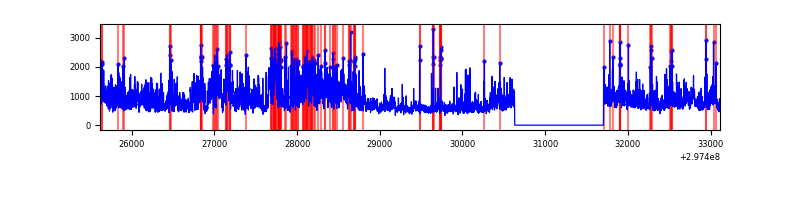 |
| D | 7497 | 6422 | 550 | 550 | 7.34% | 8.56% | 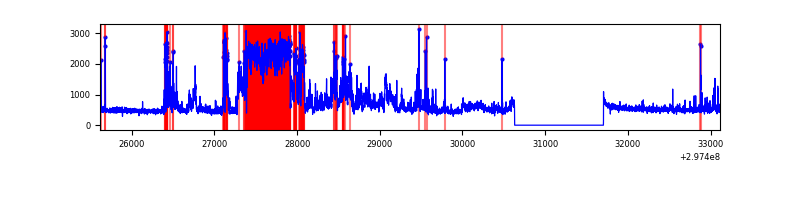 |
Top three noisy pixels from each quadrant. If the there are fewer than three noisy pixels in the level2.evt file, extra rows are filled as -1
| Pixel properties | Quadrant properties | ||||||
|---|---|---|---|---|---|---|---|
| Quadrant | DetID | PixID | Counts | Sigma | Mean | Median | Sigma |
| A | 0 | 226 | 7073 | 39.24 | 797 | 781 | 160.3 |
| A | 3 | 137 | 5949 | 32.23 | 797 | 781 | 160.3 |
| A | 12 | 194 | 5884 | 31.83 | 797 | 781 | 160.3 |
| B | 3 | 112 | 93096 | 626.55 | 785 | 768 | 147.4 |
| B | 0 | 189 | 77455 | 520.41 | 785 | 768 | 147.4 |
| B | 0 | 197 | 76833 | 516.19 | 785 | 768 | 147.4 |
| C | 9 | 221 | 1897194 | 11205.49 | 734 | 738 | 169.2 |
| C | 3 | 233 | 679725 | 4011.89 | 734 | 738 | 169.2 |
| C | 4 | 254 | 331833 | 1956.32 | 734 | 738 | 169.2 |
| D | 7 | 38 | 1860336 | 10130.53 | 752 | 729 | 183.6 |
| D | 12 | 32 | 141115 | 764.78 | 752 | 729 | 183.6 |
| D | 1 | 52 | 109762 | 593.98 | 752 | 729 | 183.6 |
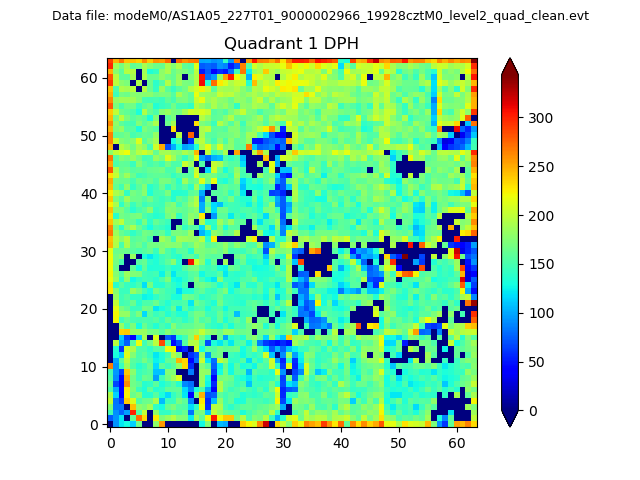
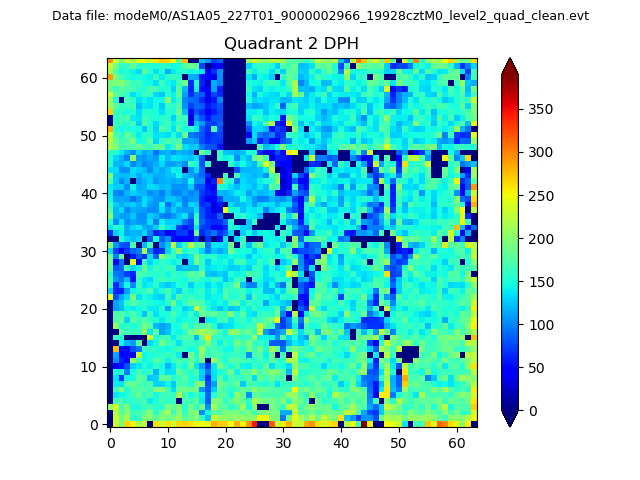
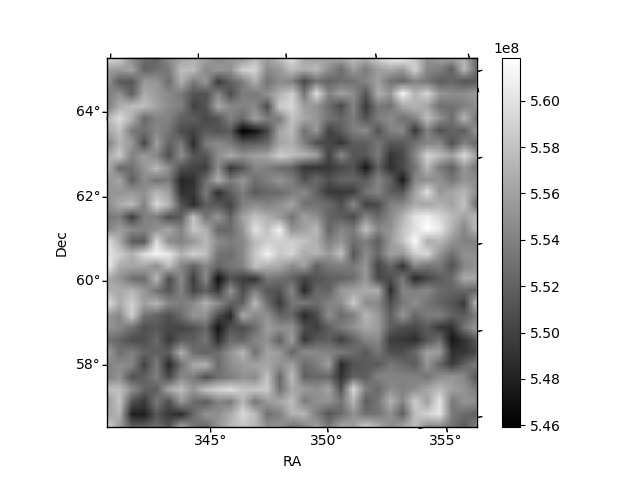
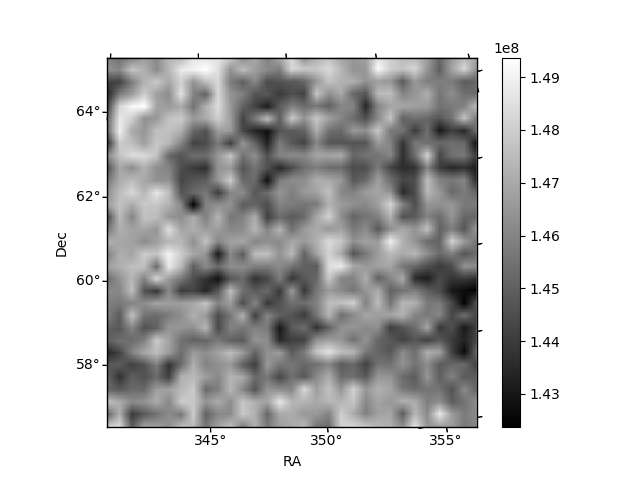
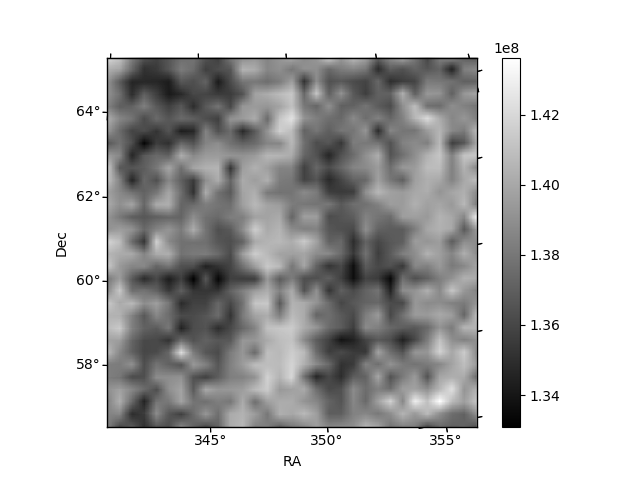
Histogram calculated using DETX and DETY for each event in the final _common_clean file
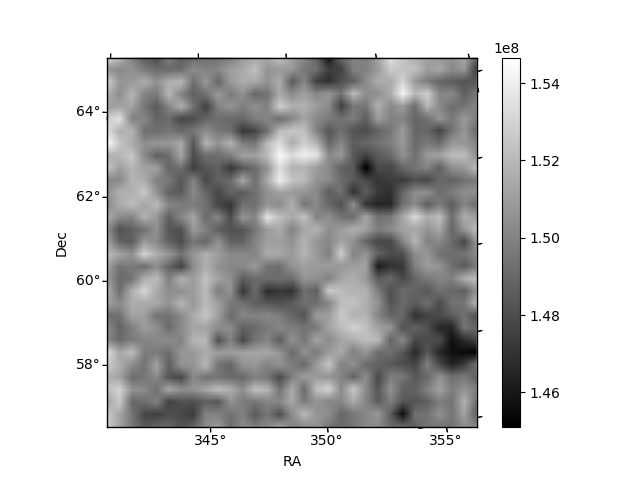
| Quadrant A |  |
 |
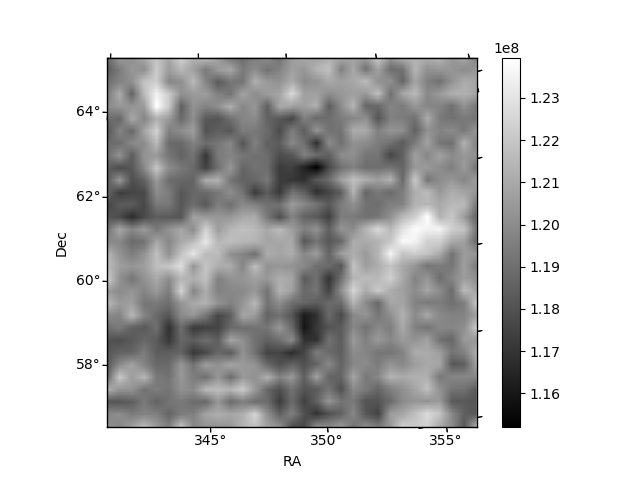
Quadrant B |
|---|---|---|---|
| Quadrant D | 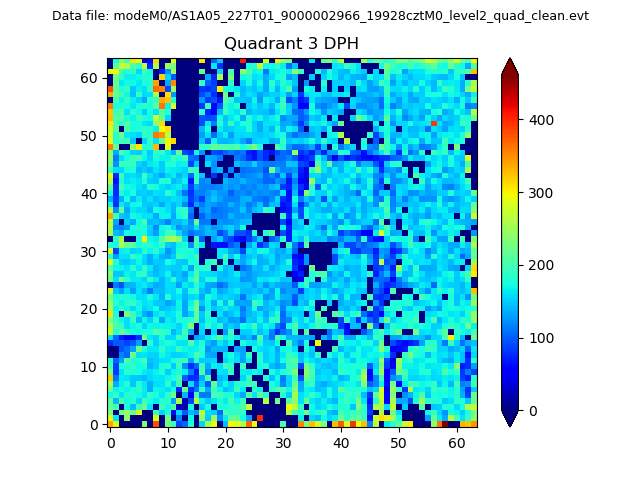 |
 |
Quadrant C |
| Plot type | Count rate plots | Images |
|---|---|---|
| Comparison with Poisson distribution Blue bars denote a histogram of data divided into 1 sec bins. Red curve is a Poisson curve with rate = median count rate of data. |
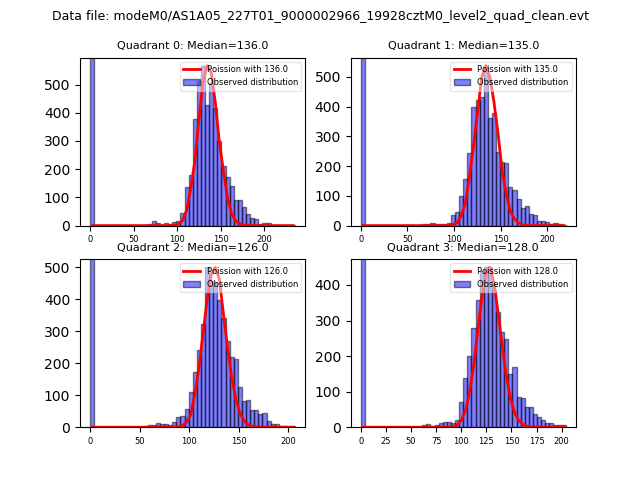 |
 |
| Quadrant-wise count rates Data is divided into 100 sec bins |
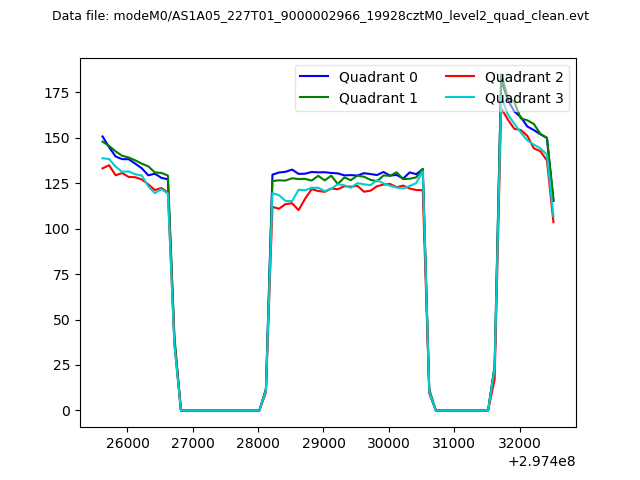 |
|
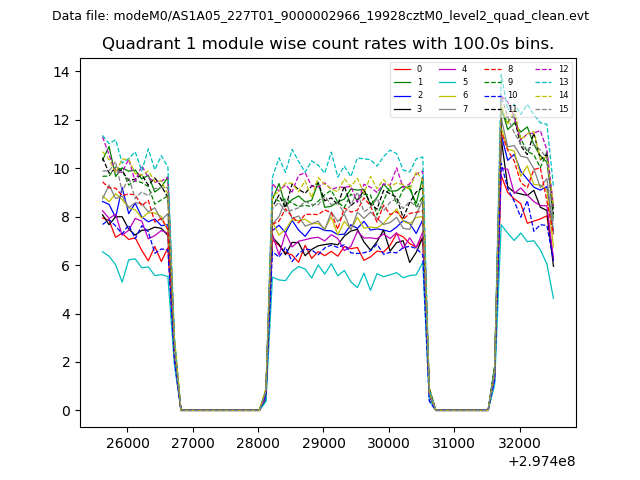
| Module-wise count rates for Quadrant A Data is divided into 100 sec bins |
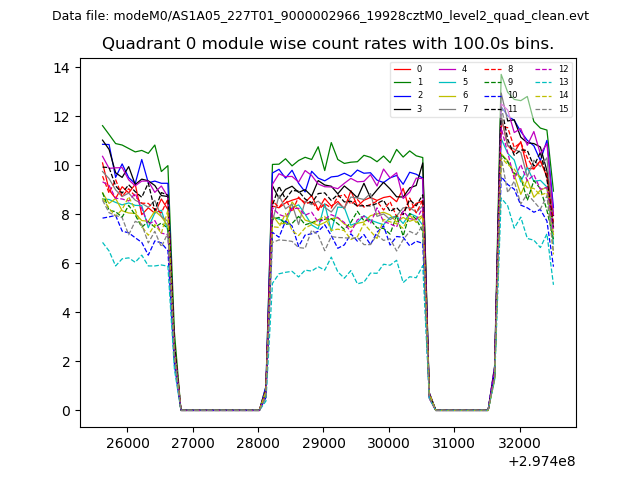 |
 |
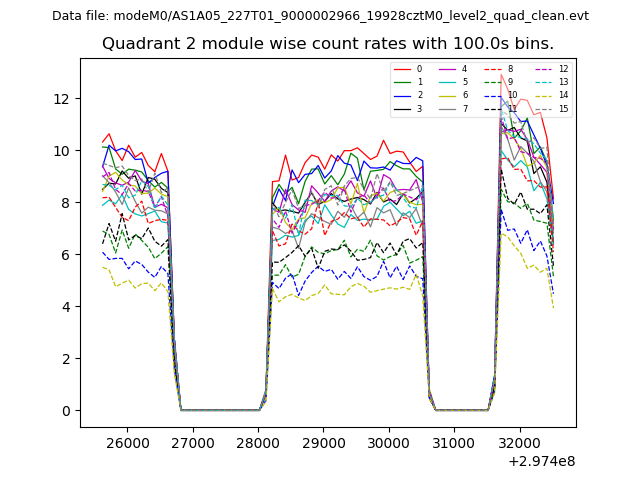
| Module-wise count rates for Quadrant B Data is divided into 100 sec bins |
 |
 |
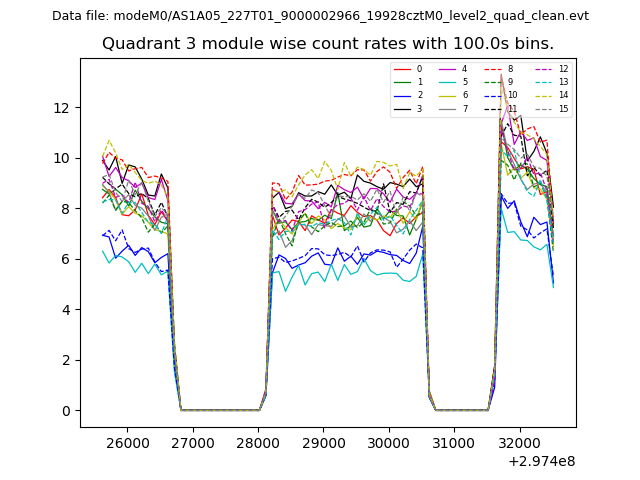
| Module-wise count rates for Quadrant C Data is divided into 100 sec bins |
 |
 |
| Module-wise count rates for Quadrant D Data is divided into 100 sec bins |
 |
 |
| Parameter | Plot |
|---|---|
| CZT HV Monitor | 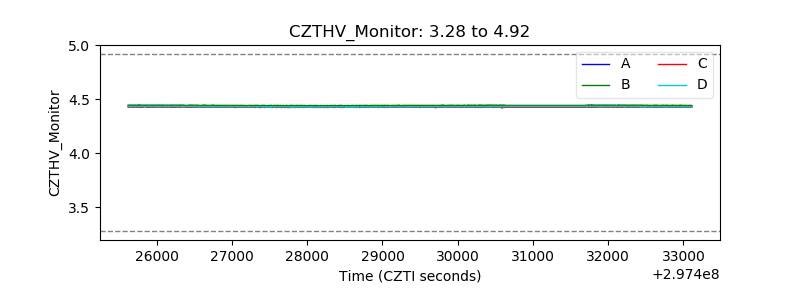 |
| D_VDD | 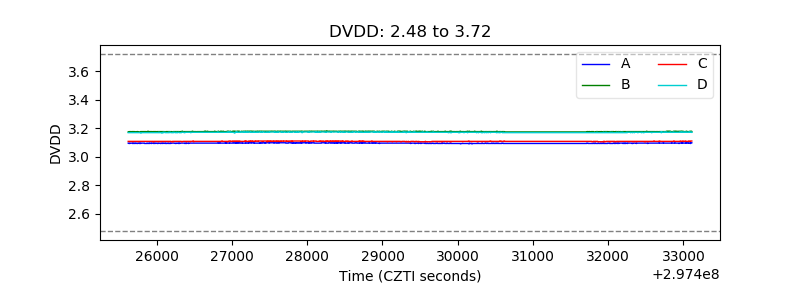 |
| Temperature 1 | 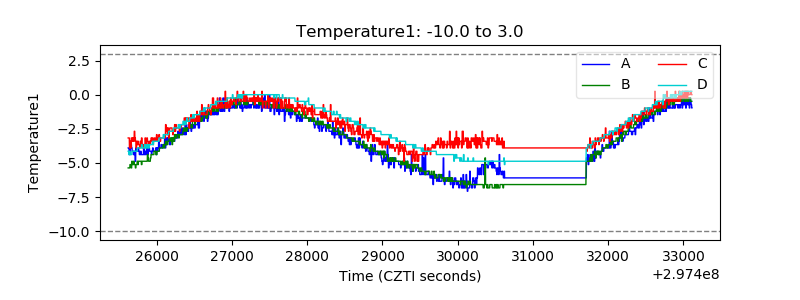 |
| Veto HV Monitor | 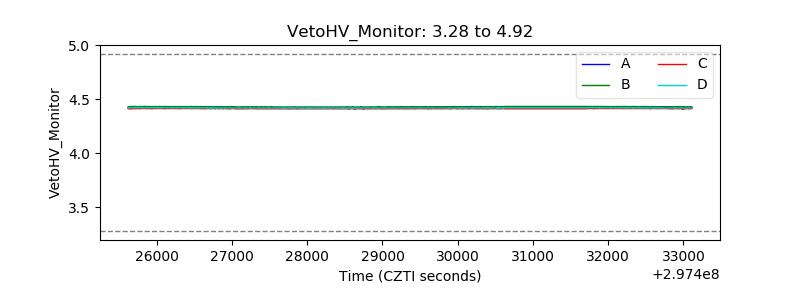 |
| Veto LLD | 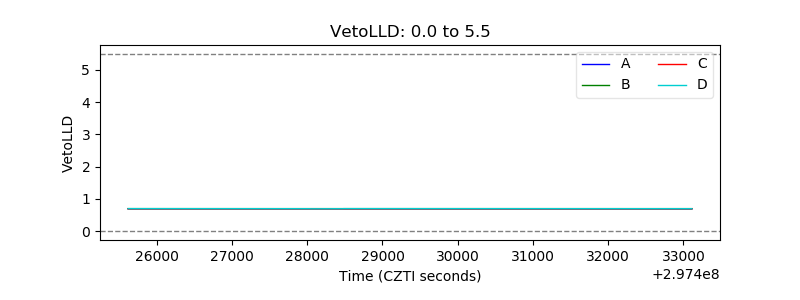 |
| Alpha Counter | 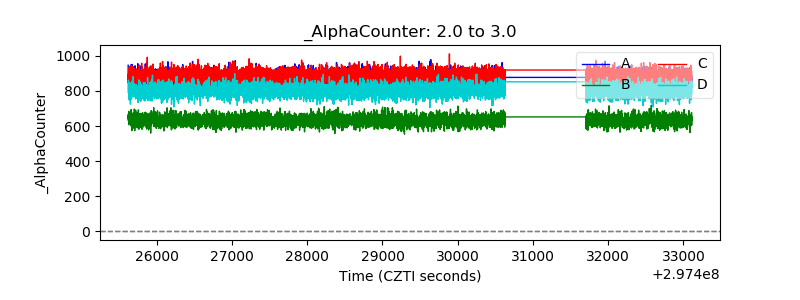 |
| _CPM_Rate | 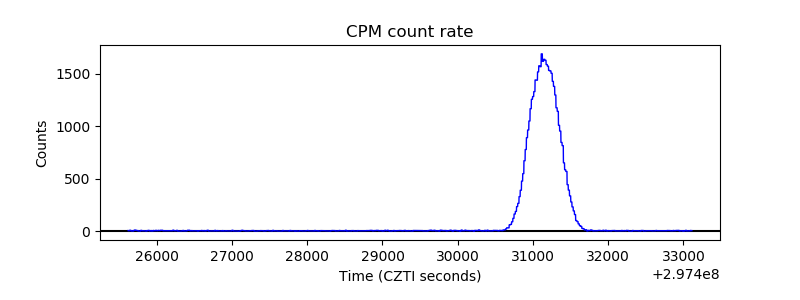 |
| CZT Counter | 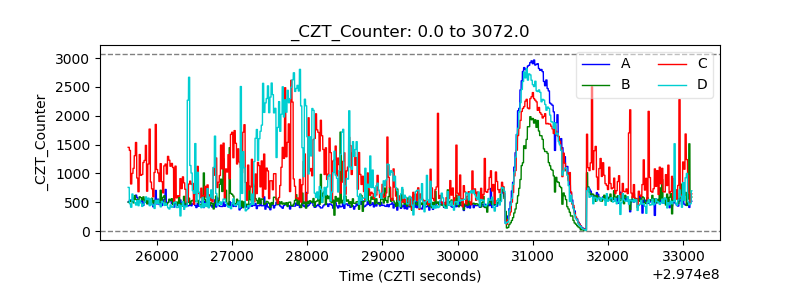 |
| +2.5 Volts monitor |  |
| +5 Volts monitor |  |
| _ROLL_ROT | 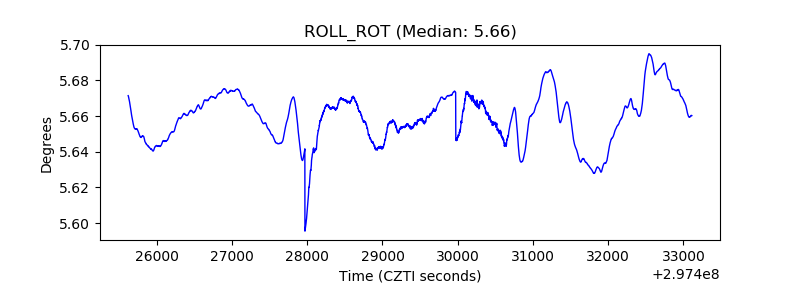 |
| _Roll_DEC | 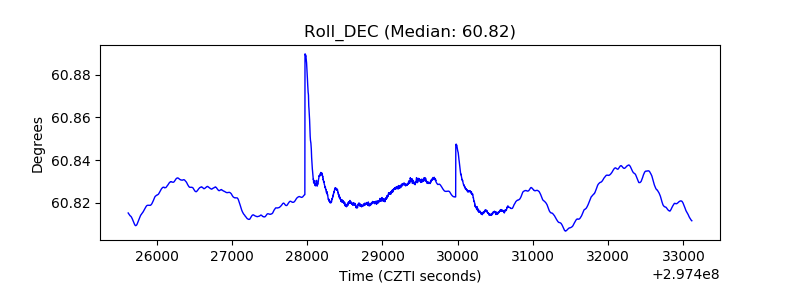 |
| _Roll_RA | 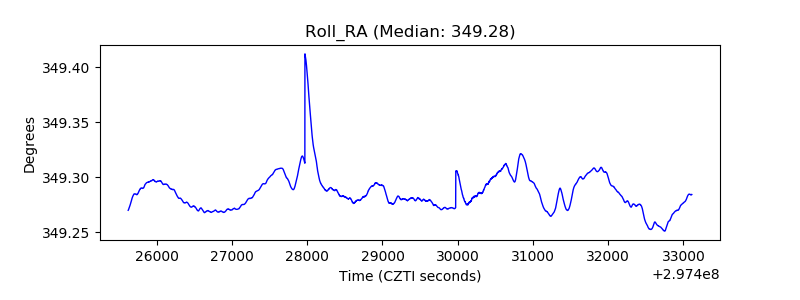 |
| Veto Counter | 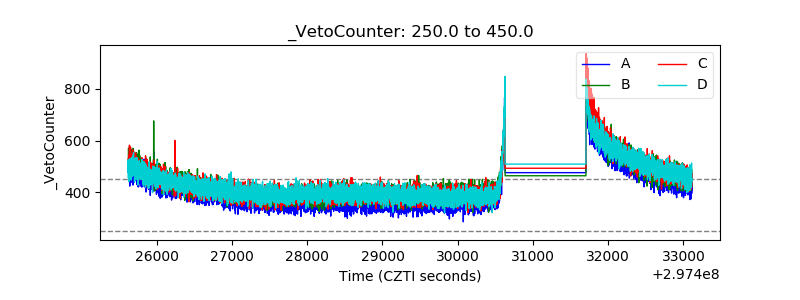 |