| Param | Original file | Final file |
|---|---|---|
| Filename | modeM0/AS1C04_009T05_9000002968cztM0_level2.fits | modeM0/AS1C04_009T05_9000002968cztM0_level2_quad_clean.evt |
| Size (bytes) | 59,843,520 | 54,590,400 |
| Size | 57.1 MB | 52.1 MB |
| Events in quadrant A | 377,794 | 330,444 |
| Events in quadrant B | 351,574 | 322,591 |
| Events in quadrant C | 353,724 | 301,811 |
| Events in quadrant D | 323,656 | 291,862 |
| Mode SS | |||
|---|---|---|---|
| Quadrant | BADHDUFLAG | Total packets | Discarded packets |
| A | 0 | 118 | 0 |
| B | 0 | 118 | 0 |
| C | 0 | 118 | 0 |
| D | 0 | 118 | 0 |
| Mode M0 | |||
|---|---|---|---|
| Quadrant | BADHDUFLAG | Total packets | Discarded packets |
| A | 0 | 12141 | 0 |
| B | 0 | 13200 | 0 |
| C | 0 | 19611 | 0 |
| D | 0 | 14655 | 0 |
| Mode M9 | |||
|---|---|---|---|
| Quadrant | BADHDUFLAG | Total packets | Discarded packets |
| A | 0 | 12 | 0 |
| B | 0 | 12 | 0 |
| C | 0 | 12 | 0 |
| D | 0 | 12 | 0 |
| Quadrant | Total seconds | Saturated seconds | Saturation percentage |
|---|---|---|---|
| A | 5803 | 55 | 0.947786% |
| B | 5803 | 72 | 1.240738% |
| C | 5803 | 498 | 8.581768% |
| D | 5803 | 128 | 2.205756% |
Noise dominated data is calculated using 1-second bins in cleaned event files. If a bin has >2000 counts, and if more than 50% of those come from <1% of pixels, then it is considered to be noise-dominated and hence unusable.
| Quadrant | # 1 sec bins | Bins with >0 counts | Bins with >2000 counts | High rate bins dominated by noise | Noise dominated (total time) | Noise dominated (detector-on time) | Marked lightcurve |
|---|---|---|---|---|---|---|---|
| A | 6998 | 5802 | 0 | 0 | 0.00% | 0.00% | 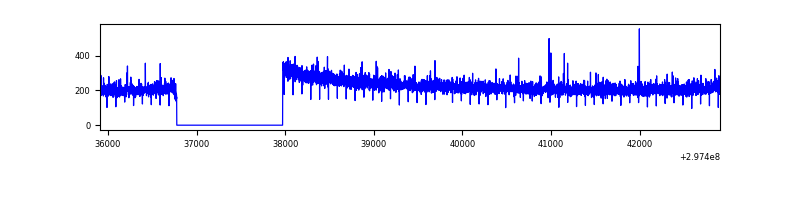 |
| B | 6998 | 5802 | 0 | 0 | 0.00% | 0.00% |  |
| C | 6998 | 5798 | 0 | 0 | 0.00% | 0.00% |  |
| D | 6998 | 5802 | 0 | 0 | 0.00% | 0.00% |  |
Top three noisy pixels from each quadrant. If the there are fewer than three noisy pixels in the level2.evt file, extra rows are filled as -1
| Pixel properties | Quadrant properties | ||||||
|---|---|---|---|---|---|---|---|
| Quadrant | DetID | PixID | Counts | Sigma | Mean | Median | Sigma |
| A | 0 | 29 | 350 | 9.92 | 98 | 93 | 25.9 |
| A | 7 | 110 | 325 | 8.96 | 98 | 93 | 25.9 |
| A | 9 | 19 | 291 | 7.65 | 98 | 93 | 25.9 |
| B | 3 | 17 | 237 | 7.21 | 93 | 90 | 20.4 |
| B | 4 | 146 | 222 | 6.48 | 93 | 90 | 20.4 |
| B | 5 | 128 | 219 | 6.33 | 93 | 90 | 20.4 |
| C | 1 | 81 | 275 | 7.39 | 93 | 88 | 25.3 |
| C | 1 | 80 | 260 | 6.79 | 93 | 88 | 25.3 |
| C | 9 | 242 | 249 | 6.36 | 93 | 88 | 25.3 |
| D | 6 | 231 | 262 | 6.74 | 92 | 84 | 26.4 |
| D | 10 | 189 | 241 | 5.95 | 92 | 84 | 26.4 |
| D | 4 | 160 | 241 | 5.95 | 92 | 84 | 26.4 |
Histogram calculated using DETX and DETY for each event in the final _common_clean file
| Quadrant A |  |
 |
Quadrant B |
|---|---|---|---|
| Quadrant D |  |
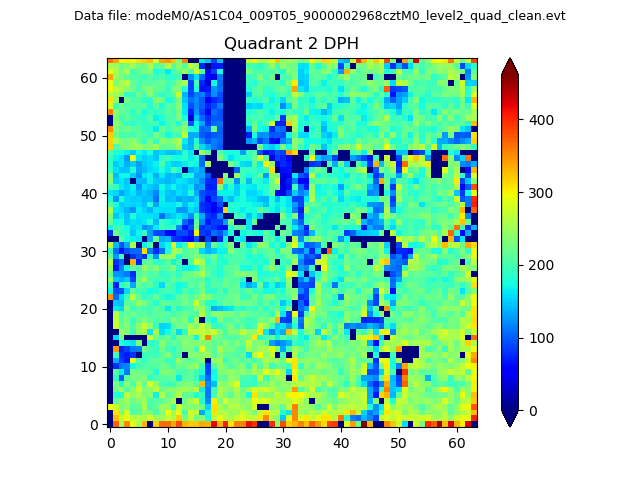 |
Quadrant C |
| Plot type | Count rate plots | Images |
|---|---|---|
| Comparison with Poisson distribution Blue bars denote a histogram of data divided into 1 sec bins. Red curve is a Poisson curve with rate = median count rate of data. |
 |
 |
| Quadrant-wise count rates Data is divided into 100 sec bins |
 |
|
| Module-wise count rates for Quadrant A Data is divided into 100 sec bins |
 |
 |
| Module-wise count rates for Quadrant B Data is divided into 100 sec bins |
 |
 |
| Module-wise count rates for Quadrant C Data is divided into 100 sec bins |
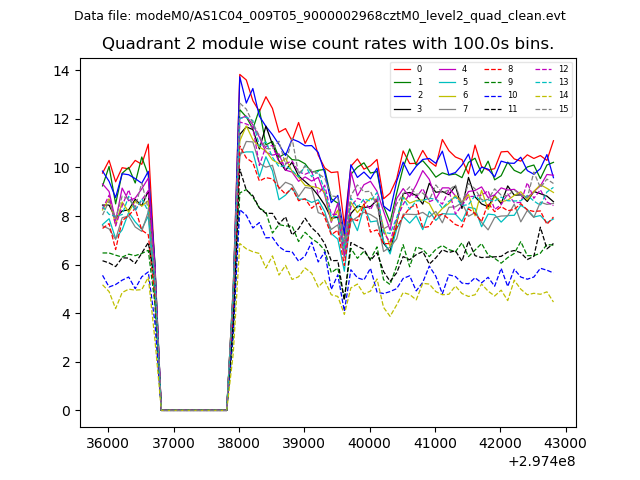 |
 |
| Module-wise count rates for Quadrant D Data is divided into 100 sec bins |
 |
 |
| Parameter | Plot |
|---|---|
| CZT HV Monitor |  |
| D_VDD |  |
| Temperature 1 |  |
| Veto HV Monitor |  |
| Veto LLD |  |
| Alpha Counter |  |
| _CPM_Rate |  |
| CZT Counter |  |
| +2.5 Volts monitor |  |
| +5 Volts monitor |  |
| _ROLL_ROT |  |
| _Roll_DEC |  |
| _Roll_RA |  |
| Veto Counter |  |